Physical Review B 84, 174208 (2011)

Dynamically Induced Locking and Unlocking Transitions in Driven Layered Systems with Quenched Disorder

C. Reichhardt and C.J. Olson Reichhardt

Theoretical Division, Los Alamos National Laboratory, Los Alamos, New Mexico 87545, USA

(Received 22 July 2011; published 21 November 2011)

Using numerical simulations, we examine a simple model of two or more coupled one-dimensional channels of driven particles with repulsive interactions in the presence of quenched disorder. We find that this model exhibits a remarkably rich variety of dynamical behavior as a function of the strength of the quenched disorder, coupling between channels, and external drive. For weaker disorder, the channels depin in a single step. For two channels we find dynamically induced decoupling transitions that result in coexisting pinned and moving phases as well as moving decoupled phases where particles in both channels move at different average velocities and slide past one another. Decoupling can also be induced by changing the relative strength of the disorder in neighboring channels. At higher drives, we observe a dynamical recoupling or locking transition into a state with no relative motion between the channels. This recoupling produces unusual velocity-force signatures, including negative differential conductivity. The depinning threshold shows distinct changes near the decoupling and coupling transitions and exhibits a peak effect phenomenon of the type that has been associated with transitions from elastic to plastic flow in other systems. We map several dynamic phase diagrams showing the coupling-decoupling transitions and the regions in which hysteresis occurs. We also examine the coexistence regime for channels with unequal amounts of quenched disorder. For multiple channels, multiple coupling and decoupling transitions can occur; however, many of the general features found for the two channel system are still present. Our results should be relevant to depinning in layered geometries in systems such as vortices in layered or nanostructured superconductors and Wigner or colloidal particles confined in nano-channels; they are also relevant to the general understating of plastic flow.
I. INTRODUCTION
II. SIMULATION
III. DECOUPLING TRANSITIONS FOR TWO LAYER SYSTEMS
IV. VARIED RELATIVE DISORDER STRENGTH AND HYSTERESIS
V. DENSITY DEPENDENCE AND DYNAMIC COMMENSURATION EFFECTS
VI. MORE THAN TWO CHANNELS
VII. DISCUSSION
VIII. SUMMARY
References


I.  INTRODUCTION

A collection of interacting particles on an ordered or disordered substrate undergoes a depinning transition under an applied drive from a pinned state with immobile particles to an elastic or plastic sliding state [1,2,3,4,5,6,7,8,9,10]. In an elastic sliding state, each particle keeps the same neighbors over time [1,2,3], while in a plastic sliding state, the particles do not keep the same neighbors [4,5,10,11,12,13,14]. Many systems show a transition from elastic depinning for weak substrates to plastic depinning for strong substrates that is associated with changes in the velocity force curves and the depinning threshold as well as the onset of strong hysteretic effects [5,11,15,16]. For example, the peak effect phenomenon for the transport of superconducting vortices, where a peak in the critical depinning force or critical current appears as a function of temperature or magnetic field, has been associated with a transition from elastic to plastic depinning and is known to be related to the disordering of the vortex lattice [5,11]. Although the peak effect is primarily associated with superconductors, it can in principle appear in other systems that undergo a transition from elastic to plastic depinning. Several recent studies of colloidal systems and frictional systems have revealed peak effect-like behavior [9,15,16].
Plastic depinning transitions exhibit a wide variety of characteristics depending on whether the substrate is random [4] or periodic [9,6,17,18,19,20,17]. The resulting plastic flow ranges from motion in winding channels to avalanche behaviors with strong fluctuations, coexistence of large pinned and flowing regions, or transitions from two-dimensional (2D) mixing phases to one-dimensional (1D) decoupled channel phases. For higher drives, many systems undergo a transition from plastic flow to a more ordered flow state, such as a moving smectic state where the particles organize into 1D channels that can slide past one another [21,14,15] or partially ordered moving crystal states [13,21,6,7].
Due to the complexity of plastic depinning phenomena in 2D and three-dimensional (3D) systems, numerous simpler systems have been proposed that still exhibit plastic depinning, such as particles flowing in a series of simple coupled layers. Many systems with depinning transitions can be modeled effectively as layered systems, including sliding charge density waves [1,22] and vortices in strongly layered superconductors [23,24]. Advances in fabrication techniques have made it possible to create nanostructured systems in which particles such as vortices move through effectively 1D coupled channels [25]. Marchetti et al. considered a mean field anisotropic slip model of coupled channels of particles oriented parallel to a driving force [26]. Along each channel, the particle interactions are elastic, but slip can occur between neighboring channels. In this model, when the depinning is elastic the channels show no slip or hysteresis, but for plastic depinning there is both slip and hysteresis. Further theoretical work on systems with only two layers demonstrated that a transition from non-hysteretic elastic depinning to hysteretic plastic depinning occurs as a function of disorder [27]. For 3D layered sliding charge density wave systems, a transition from elastic depinning to plastic hysteretic depinning has also been predicted [22], along with a second coupling transition at higher drives when the charge density waves begin to flow coherently. Numerical work on 3D layered superconducting vortex systems has shown a similar disorder-induced transition from elastic to plastic flow marked by a large increase in the depinning threshold when the layers decouple, which is typical of a peak effect behavior [23,24,28]. We note that although the transition to plastic depinning is marked by an increase in the depinning threshold, in real superconductors the depinning threshold decreases as the superconducting critical temperature or field is approached due to the changing penetration depth. This feature is generally not included in most simulations.
In this work we consider a simple depinning model consisting of two or more coupled 1D channels of repulsively interacting particles, all of which are subjected to a driving force and quenched disorder. This system could be experimentally realized using colloidal particles in coupled 1D channels with a disordered substrate and driven by an external electric field [29,30,31,32], coupled 1D wires containing Wigner crystal phases [33,34,35,36], or vortices on corrugated substrates driven parallel to the corrugation. Our simulations of this model include much more detail than can be captured in mean field studies [26,37,27]. In addition to confirming many of the predictions from the theoretical studies, we find a rich variety of new features. We induce decoupling transitions by changing the relative strength of the disorder from channel to channel, something that has not been considered in previous work on the depinning of layered systems. We also study commensuration effects by varying the particle density in one channel relative to the density in other channels. We drive all of the layers of particles; previous studies of this type of model considered transformer geometries with the drive applied to only one layer [38,39]. Despite the apparent simplicity of our model, we find that even the two layer system has a wide variety of dynamical phases and exhibits all the salient features found for elastic and plastic depinning phenomena, including a peak effect at the transition between the two types of depinning. We also show that the transport signatures of the dynamical coupling and recoupling transitions can be enhanced in systems where the channels do not all have the same amount of disorder, suggesting that experimental realizations of this geometry may be an excellent way to probe these dynamical states.
The paper is organized as follows. In Section II we describe our model and simulation technique. Section III discusses decoupling transitions in a two channel system as the spacing between channels is varied, as well as a peak effect appearing at the transition from elastic to plastic depinning. In Section IV, we consider two channel samples in which the strength of the disorder differs in the two channels, where we observe drag-induced pinning as well as hysteretic velocity-force signatures. In Section V, we find commensuration effects when the number of particles in each channel is varied for a two channel system, and we also study the effect of changing the particle-particle interaction prefactor. We introduce an eight channel system in Section VI and show that as disorder strength and channel coupling is varied, the behavior resembles that of the two channel system. We also study representative examples of eight channel systems in which not all channels contain the same number of particles. We conclude with a summary in Section VII.

II.  SIMULATION

We model an array of M coupled 1D channels separated by a distance d where channel j contains Nj particles [38]. The total number of particles in the system is N=∑j=1MNj. The particle-particle interactions are repulsive, and each particle interacts both with particles in the same channel as well as with particles in nearby channels. The number of randomly placed pinning sites in channel j is given by nj. All of the particles in the system are subjected to a uniform external driving force FD. We apply periodic boundary conditions in the x direction, along the length of the channels, and the total length of our system is L=72a0, where a0 is our unit of length that is typically a micron in colloidal systems. The boundaries are open along the y direction transverse to the channels. Fig. 1 shows a schematic of our system in several different configurations.
The particles interact via a Yukawa or screened Coulomb potential that is appropriate for charged colloids or for charge transport in the presence of screening. We show later that the same general dynamic phases also occur for repulsively interacting vortices in type-II superconductors. For the colloidal system, the dynamics of a particle i at T=0 is determined by integrating the following overdamped equation of motion:
Fig1.png
Figure 1: Schematic of the system. The particles (filled circles) are constrained to move along 1D channels that are separated by a distance d. Each channel contains Nj particles as well as nj randomly placed pinning sites (open circles) that each have a maximum pinning force of Fpj. A uniform drive FD is applied to all particles in the positive x direction. The particles interact via a repulsive Yukawa potential with other particles in the same channels and in neighboring channels. (a) A two channel system with N1=N2 and n1=n2. (b) Two channels with an equal number of particles in each channel, N1=N2, but with more pinning in the upper channel, n1 > n2. (c) Two channels with equal pinning in each channel, n1=n2, but more particles in the upper channel, N1 > N2. (d) Multiple channels each containing the same number of particles, Nj=N1, and pins, nj=n1.
η dRi

dt
= Fipp + Fsi + FD  .
(1)
Here Ri is the location of particle i and η is the damping coefficient that is set equal to one. The particle-particle interaction force is Fppi = −∑jiNV(Rij)Rij where V(Rij) = (q2E0/Rij)exp(−κRij), Rij=|RiRj|, Rij = (RiRj)/Rij, E0 = Z*2/4πϵϵ0, ϵ is the solvent dielectric constant, Z* is the effective charge of a colloidal particle, and q2 is the dimensionless squared colloid charge that is taken to be q2=2.0 unless otherwise noted. We take the screening length 1/κ = 4a0 and choose the distance between channels in the range d ≤ 3a0 (equivalent to d/κ ≤ 2) to ensure that particles in neighboring channels interact with each other. In the absence of pinning, the particles in an isolated channel would adopt a lattice spacing of aj=Nj/L. The substrate pinning force is given by Fsi=∑njk = 1Fpj(Rpik/Rp)Θ(RpRpik)Rikp. Here particle i sits in channel j, nj is the number of pinning sites in channel j, Θ is the Heaviside step function, Rkp is the location of pinning site k, Rikp = |RiRkp|, and Rikp=(RiRkp)/Rpik. The pinning site radius is Rp and the maximum strength of the pinning sites in channel j is Fpj. Within each channel the pins are placed in randomly chosen non-overlapping positions that are different for each channel. This pinning model has been used in previous simulations to represent quenched disorder for colloidal systems, classical electron systems, and vortices in superconductors. The external drive FD=FDx is applied in the positive x-direction. The drive is increased in increments of δFD = 0.001, and after each increment FD is held fixed for 105 simulation time steps to ensure that any transient effects have subsided. We measure the average particle velocity in each channel for every force increment, Vj = 〈Nj−1i=1Njvi〉, where vi=(dRi/dt) ·x. We also measure the net velocity of all the channels, V=∑i=1M Vi.

III.  DECOUPLING TRANSITIONS FOR TWO LAYER SYSTEMS

We first consider a two layer system in which we vary the interlayer distance d. We can effectively decrease the coupling between the layers by increasing d since the interaction between Yukawa particles becomes weaker for increasing interparticle distance. In Fig. 2 we plot the velocity force curves for channels 1 and 2 in a system with equal numbers of particles in each channel (N1=N2), in-channel lattice constant a1=a2=1.5a0, equal numbers of pins in each channel (n1=n2), n1/N1 = 0.25, Fp1 = Fp2 = 6.0, and Rp = 0.23 for varied d measured in terms of d/a1. For small d or strong coupling, the two channels depin simultaneously without any slipping between the channels, as shown in Fig. 2(a) for d/a1=1.333. All the particles keep the same neighbors, indicating that the depinning is elastic. The value of FD at which depinning first occurs is termed the critical depinning threshold, Fc.
As d increases there is a transition to a state where the channels depin individually, as shown in Fig. 2(b) for d/a1 = 1.47. Here channel 1 depins at FD = 0.32 while channel 2 remains pinned until FD = 0.36. Since both channels have equal numbers of pins, equal numbers of particles, and experience the same driving force, the difference in depinning threshold arises due to the random placement of the pinning sites in the two channels, which differs from channel to channel. As soon as channel 2 depins, the system transitions directly into a state where the moving channels are dynamically locked with each other and move at the same velocity, V1=V2, without any slipping. As the inset in Fig. 2(b) shows, the dynamic locking transition coincides with a drop in V1 indicative of negative differential conductivity (NDC), where a system of particles shows a decrease in the velocity under increasing drive, dV1/dFD < 0.0. The NDC occurs only in channel 1 at FD=0.36 when V2 jumps from zero to a finite value, which also corresponds to a peak in dV2/dFD.
Fig. 2(c) shows the velocity force curves for d/a1 = 1.57, where the depinning threshold for channel 1 is again lower than that for channel 2. In this case, after channel 2 depins the system does not immediately enter the moving locked phase. Instead, we find a region 0.39 < FD < 0.415 with V1V2, V1 > 0, and V2 > 0. Here both channels are moving but at different average velocities, indicating that the particles in channel 1 are sliding past the particles in channel 2. The channels become dynamically locked for FD > 0.415, where V1=V2. As d/a1 is further increased, the dynamical locking transition shifts to larger values of FD. For example, in Fig. 2(d) for d/a1 = 1.64, the channels are only dynamically coupled for FD > 0.742.
In the inset of Fig. 2(d) we plot the overall velocity V=V1+V2 versus FD for the samples with d/a1=1.47 and d/a1=1.64 from Fig. 2(b) and Fig. 2(d), respectively. These are the curves that would be obtained in an experimental measurement of net transport rather than individual channel transport. For d/a1 = 1.47, where NDC of V1 appeared in Fig. 2(b), the inset of Fig. 2(d) shows that there is no NDC in the overall velocity V. This is because the decrease in V1 at FD=0.36 is exactly compensated by the increase in V2, so there is no net drop in V at the second depinning transition. For both d/a1=1.47 and d/a1=1.64, V shows a characteristic step feature that indicates the presence of a two-step depinning transition. On the lower step in V, only channel 1 is depinned, while on the upper step, both channels are flowing. For this particular set of parameters, we find only a weak signature in V of the relocking transition that occurs at higher drives; however, for other parameters, we will show below that the onset of dynamical locking produces much more pronounced effects in V. We note that in the absence of any pinning, the particles in the two channels adopt a zig-zag arrangement that keeps the particles in the lower channel as far away as possible from the particles in the upper channel. The angle of the zig-zag depends on the value of d/a1 [39]. In the decoupled phase, the pinning disorders the lattice configuration, the zig-zag structure is absent, and the particles in the two rows slide past one another. In the locked phase the system regains the zig-zag ordering found in the absence of pinning since it lowers the repulsive interactions between the layers.
Fig2.png
Figure 2: The velocity of each channel, V1 (dark line) and V2 (light red line), in a two channel (M=2) system versus applied drive FD with fixed quenched disorder for varied distance d between the channels. Each channel has the same number of particles, N1=N2, and pinning sites n1=n2. Here n1/N1 = 0.25, Fp1 = Fp2 = 6.0, Rp = 0.23a0, and the in-channel lattice constant a1=a2=L/N1=1.5a0. (a) For d/a1 = 1.133, there is an elastic depinning transition and both channels depin simultaneously. (b) At d/a1 = 1.47, channel 1 depins first while channel 2 remains pinned. Once channel 2 depins, the channels become dynamically locked. The locking transition is associated with negative differential conductivity (NDC) in V1, as illustrated in the inset where dV1/dFD < 0.0 at FD=0.36. (c) For d/a1 = 1.57 near FD=0.39 there is a region where both channels are depinned but V1V2, indicating that the channels are sliding past one another. Dynamical locking occurs for FD > 0.415. (d) At d/a1 = 1.64, the recoupling transition is shifted to much higher FD. Inset: The sum of the velocities V=V1+V2 for d/a1=1.47 (dark line) and d/a1=1.64 (light green line) shows the occurrence of two step depinning; there is no NDC in V for the d/a1=1.47 sample.
By conducting a series of simulations we map the dynamic phase diagram for FD vs d/a1 for the sample from Fig. 2 with Fp1=Fp2=6.0 in Fig. 3(a) and for a sample with Fp1=Fp2=3.0 in Fig. 3(b). In the pinned (P) phase, both channels are pinned, V1=V2=0. In the coexistence (C) phase, one channel is pinned while the other is moving. The sliding (S) phase has both channels moving but not locked, V1 > 0 and V2 > 0 but V1V2, while in the locked (L) phase both channels move together without slipping, V1=V2 > 0. In Fig. 3(a), for d/a1 > 1.43 the layers decouple at depinning and the width of region S grows with increasing d/a1. The width of the coexistence phase saturates as d/a1 increases due to the decoupling of the particles, which causes the depinning thresholds of each channel that mark the borders of the C phase to be determined only by the quenched disorder configuration and the interactions among particles within the channel, and to be insensitive to the positions of the particles in the neighboring channel. The recoupling that marks the transition between the S and L phases rapidly shifts to higher FD with increasing d/a1 for d/a1 > 1.613. In Fig. 3(b) we show that in a sample with weaker pinning of Fp1=Fp2=3.0, the transition directly from P to L persists out to the higher value of d/a1=1.6 but that the same general features found for higher Fp in Fig. 3(a) still occur and are shifted to higher d/a1 and lower FD.
The dynamical phase diagrams in Fig. 3 have many similarities to the dynamical phase diagrams obtained for 2D and 3D driven vortex systems [14,26,37,15,24]. The 2D vortex system exhibits pinned, plastic, and dynamically ordered phases, with the vortex lattice ordering into either a moving smectic or moving crystal configuration [14,15,13]. Our system has the same pinned phase, while the coexistence phase that contains a mixture of moving and pinned channels corresponds to the plastic flow regime for the vortex system. The sliding phase we observe resembles the moving smectic phase found for vortices, while our locked phase is equivalent to the 2D dynamically reordered phase or, for 3D vortex systems, to the transition from decoupled layers to coupled 3D vortex lines [23,40,28]. In the vortex system, as the pinning strength increases or the vortex-vortex interactions are weakened, the reordering transition shifts to higher drives [14]. The dynamical reordering occurs because the pinning is effectively weakened when the vortices are moving rapidly. In our system, in the locked phase the effectiveness of the quenched disorder is dramatically reduced. As the inter-channel particle-particle interaction strength decreases for increasing d/a1, the quenched disorder becomes more effective, the recoupling transition shifts to higher FD, and the additional C and S phases appear between the P and L phases.
In the inset of Fig. 3(a) we plot a blowup of the region near d/a1=1.4 for the Fp1=Fp2=6.0 sample where the transition between elastic depinning directly into the locked phase and plastic depinning into the coexistence phase occurs. The critical depinning threshold Fc reaches a peak at d/a1=1.43 at the transition, while for d/a1 > 1.43, Fc decreases and then saturates with increasing d/a1. The Fc peak has all the hallmark features of the peak effect phenomenon found for vortices and other systems where a peak in the critical depinning threshold occurs near the transition from elastic to plastic depinning [5,11,15,16]. In many of these studies the Fc peak occurs inside the plastic depinning regime just beyond the transition point, while Fc for the elastic depinning is always lower than for the plastic depinning [5]. In our two layer system, the Fc peak falls right at the transition out of the elastic depinning regime, and Fc decreases with increasing d/a1 within the plastic depinning regime. We note that when d/a1 becomes sufficiently small, the channels are increasingly decoupled and the transition directly from elastic depinning to a locked phase is lost since one of the channels depins before the other channel. For different realizations of disorder, each channel has an equal chance of being the channel that depins first; however, since the pinning strength is equal in each channel, the difference in the critical depinning forces is small and therefore the coexistence phase is small. There is also another sliding phase that diverges with FD as d/a1 goes to zero. For the parameters we consider, the velocity drop at the onset of the locked phase always occurs in the channel that depins first. When the first channel depins, it moves at a higher velocity since it is not dragging any of the particles in the second channel. The particles in the second channel move at a lower velocity once they depin due to the stronger or more effective pinning in that channel; however, when locking occurs both channels must move at the same velocity so the particles in the faster moving channel (the first to depin) slow down while the particles in the slower channel move faster.
Fig3.png
Figure 3: Dynamic phase diagrams FD vs d/a1 for the M=2 system from Fig. 2 with N1=N2, n1=n2, n1/N1=0.25, Rp=0.23a0, and a1=a2=1.5a0. P: pinned phase with V1=V2=0; C: coexistence phase where one channel is moving but the other is pinned; S: sliding phase where both channels are moving but V1V2; L: dynamically locked phase where V1=V2 > 0. (a) The sample from Fig. 2 with Fp1 = Fp2 = 6.0. For d/a1 < 1.43 the system depins directly into the locked phase, while for d/a1 > 1.43, dynamically induced locking occurs at a value of FD that increases with increasing d/a1. Inset: A blowup of the main panel illustrating that the P phase reaches its maximum value of FD at the transition from elastic to plastic depinning. (b) A sample with Fp1 = Fp2 = 3.0 has the same features but the onsets of the S and C phases fall at higher values of d/a1 > 1.6.
Determining whether the effectiveness of the pinning in the plastic or decoupled phases is higher than in the elastic phase can be ambiguous when different quantities are measured [5,11]. If we consider only the overall velocity V at a fixed value of FD as we vary d/a1, we find that V drops in the decoupled regime, suggesting that the pinning is more effective in the decoupled state. This contrasts with the behavior of the depinning threshold Fc, which drops in the decoupled regime, suggesting that the pinning is less effective in the decoupled state. In Fig. 4, we plot V versus d/a1 for the sample from Fig. 3(a) with Fp1=Fp2=6.0 for fixed FD values ranging from FD=0.4 to FD=1.0. For FD ≤ 0.8, V drops or becomes zero at the decoupling transition, and for 0.6 ≤ FD ≤ 0.8 the value of V for d/a1 above the decoupling transition is smaller than the value of V for d/a1 below the decoupling transition. For FD > 0.8, the size of the dip in V at the decoupling transition gradually diminishes. This behavior is very similar to that observed across the peak effect for vortices in type-II superconductors, and indicates that for the moving particles, the pinning is more effective in the decoupled phase than in the coupled phase. The behavior of V differs from that of Fc because V is associated with moving particles while Fc is determined by the static configuration of the pinned particles.
Fig4.png
Figure 4: The summed velocity V=V1+V2 for the M=2 system in Fig. 3(a) with N1=N2, n1=n2, n1/N1=0.25, Rp=0.23a0, a1=1.5a0, and Fp1=Fp2=6.0 at FD = 0.2, 0.25, 0.3, 0.35, 0.4, 0.45, and 0.5, from bottom to top. Open circles: dynamically locked phase; filled diamonds: pinned phase; open triangles: coexistence phase; filled squares: sliding phase. The value of V in the decoupled regime is always lower than in the coupled regime, and the dip in V at the decoupling transition gradually fades away as FD increases.
In Fig. 5(a) we plot Fc versus d/a1 for a range of Fp values in the system from Fig. 3(a) to illustrate that the decoupling transition is associated with a peak in Fc. On average, Fc increases with increasing Fp and with increasing d/a1. The decoupling transition, and with it the peak in Fc, shifts to lower values of d/a1 with increasing Fp and becomes more prominent. In all cases the peak in Fc falls exactly at the transition from elastic to plastic flow. For a given value of d/a1, it is possible to induce a decoupling transition by increasing Fp; the value of Fp1 and Fp2 at the decoupling transition is termed Fpep. In Fig. 5(b) we plot Fpep versus d/a1, where we find that as d/a1 decreases and the coupling between the channels increases, Fpep increases faster than linearly.
Fig5.png
Figure 5: (a) The critical depinning threshold Fc vs d/a1 for the M=2 system in Fig. 3(a) with N1=N2, n1=n2, n1/N1=0.25, Rp=0.23a0, and a1=1.5a0 for varied Fp1=Fp2 = 15.0, 12.0, 9.0, 6.0, and 3.0, from top to bottom. In each case the peak in Fc falls at the transition from elastic to plastic depinning. (b) Fpep, the value of Fp1 and Fp2 at which a transition from elastic to plastic depinning occurs, vs d/a1 in the same system.
The velocity force signatures illustrated in Fig. 2 are generally robust against changes in pinning strength. For samples with stronger pinning, Fp1=Fp2 > 6.0, many of the features become more prominent. For sufficiently strong Fp, the system can depin directly into the sliding state with no intermediate coexistence state, as illustrated in Fig. 6(a) for Fp1=Fp2 = 15.0 and d/a1 = 1.147. Here both channels depin simultaneously at FD = 0.915, and for 0.915 < FD < 1.025 the channels move at different velocities with V1V2. We also find a larger number of jumps in the velocity force curves for higher Fp, as shown in Fig. 6(a) near FD = 1.08. The jumps are indicative of the soliton like nature of the particle motion in channels with strong pinning below the recoupling transition. Due to the random spatial placement of the pinning sites, the individual pins vary in their effectiveness at trapping particles. As the driving force is increased below depinning, particles escape from the least effective pins only to pile up behind particles that are trapped in the more effective pins. Since the channel is 1D, flowing particles cannot pass trapped particles. As the driving force further increases, particles in the pileup regions approach each other more closely and exert a greater force on the trapped particle that produced the pileup. At depinning, the trapped particle escapes from the pin and is immediately replaced by another particle that becomes pinned in its place. The trapped particle travels across the system and rejoins the pileup; the extra force it exerts on the particles ahead of it causes the trapped particle at the front of the pileup to depin and repeat the process. This picture is oversimplified; in actuality, each channel contains multiple trapping sites that create pileups and particles jump from one pileup to another above depinning. Each of the trapping sites is associated with some local depinning threshold Fcloc. As FD increases, one trapping site after another reaches the condition Fcloc < FD and ceases to trap particles. The resulting enhancement of the mobility of all the particles in the channel manifests itself as a jump in channel velocity Vj. As Fp increases, there is a greater spread in Fcloc, producing a larger number of steps in V1 and V2 above depinning. We note that such velocity force jumps are often called switching events in sliding charge density wave systems [1]. For vortex systems, near the peak effect regime a series of jumps and dips in the current-voltage curves and dV/dI curves can appear. These have been termed a fingerprint phenomenon since the same features repeat upon cycling the IV curves, indicating that the features result from the detailed configuration of the pinning sites [41,42]. The curves in Fig. 6(a) are obtained for a specific pinning realization. For a different pinning realization, the general features of the velocity force curves remain the same but the location and height of the velocity jumps will change. In Fig. 6(b), a sample with the same disorder configuration and strength but with d/a1 = 1.2 has separate depinning thresholds for channels 1 and 2 along with a sharp transition into the locked phase at FD=1.2. In the d/a1 = 1.27 sample of Fig. 6(c), we observe a strong negative differential conductivity signature in V1 at the transition between the sliding and locked phases. There is also a change in the rate at which V1 and V2 increase with FD in the locked phase, with a more rapid increase for 1.25 < FD < 1.365 and a slower increase for FD > 1.365. For d/a1 = 1.47 in Fig. 6(d), the channels do not lock until FD = 2.03, and V1 shows additional structure within the sliding phase. For increasing Fp beyond what we show here, we find similar features in the velocity force curves; however, the number of jumps and anomalies in the curves further increases as the microscopic configurations of the pinning sites begin to dominate the behavior completely.
Fig6.png
Figure 6: V1 (dark line) and V2 (light red line) vs FD for the M=2 system in Fig. 5(a) with N1=N2, n1=n2, n1/N1=0.25, Rp=0.23a0, a1=1.5a0, and Fp1=Fp2=15.0 for (a) d/a1 = 1.147, (b) d/a1 = 1.2, (c) d/a1 = 1.27, and (d) d/a1 = 1.47. Inset of (d): The dV1/dFD and dV2/dFD vs FD curves both peak at the dynamical coupling transition at FD=2.0; for FD > 2.0 above the transition, the fluctuations in both curves show increased correlation.
We next compare the velocity fluctuations in the individual channels in the unlocked and locked state. Fig. 7 shows the instantaneous velocities V1(t) and V2(t) for channels 1 and 2 as a function of time measured in simulation steps for the system in Fig. 2(c) at d/a1 = 1.57 with Fp1 = Fp2 = 6.0. At FD = 1.395 in Fig. 7(a), the system is in the S phase and both channels are moving with different average velocities V1 > V2 > 0. Both channels show a periodic response but channel 1 has a higher frequency and higher average velocity, while V2(t) drops nearly to zero during each cycle. In Fig. 7(b) we plot the corresponding power spectra S(ω) of the velocity signals, with ω measured in inverse simulation time steps. Channel 2 has greater spectral weight at the low frequency of ω = 1.1 ×10⁻⁴ corresponding to its fundamental frequency, while the peak at this frequency for channel 1 is orders of magnitude smaller in height. Channel 1 shows a response at this frequency due to its coupling with channel 2. Near ω = 1.62 ×10⁻⁴, the fundamental frequency of the faster moving channel 1, the peak in S(ω) is higher for channel 1 than for channel 2. This result shows that the two channels each have a periodic velocity signal corresponding to a different washboard frequency; however, since the channels are interacting, both velocity signals contain both washboard frequencies. In Fig. 7(c) we plot V1(t) and V2(t) for the same system at FD = 0.47 in the locked regime where the channels have the same average velocity. Here both channels exhibit the same fundamental frequency even though the shapes of V1(t) and V2(t) do not completely overlap. The corresponding S(ω) in Fig. 7(d) shows that both channels have nearly the same spectral weight at the fundamental frequency of ω = 1.48 ×10⁻⁴ and its harmonics, unlike the unequal peaks which appeared in the unlocked phase in Fig. 7(b).
Fig7.png
Figure 7: (a) The instantaneous velocity of each channel V1(t) and V2(t) versus time in simulation steps for channels 1 (dark black line) and 2 (light red line) for the M=2 system in Fig. 2(c) with N1=N2, n1=n2, n1/N1=0.25, Rp=0.23a0, a1=1.5a0, d/a1=1.57, and Fp1=Fp2=6.0 at FD = 0.395. The system is in the S phase and both channels are moving at different velocities. (b) S(ω) for the time series in panel (a) shows that channel 2 has greater spectral power at the lowest frequencies compared to channel 1. ω is reported in inverse simulation time steps. (c) V1(t) and V2(t) for the same system with FD = 0.47 where the channels are locked. (d) S(ω) for the time series in panel (c) shows nearly equal spectral weight in each channel at the fundamental frequencies.

IV.  VARIED RELATIVE DISORDER STRENGTH AND HYSTERESIS

We next consider the effects of varying the pinning strength from channel to channel in order to create one channel with high pinning strength and one channel with low pinning strength. Figure 8(a) shows the dynamic phase diagram of FD versus d/a1 for a two channel system with Fp1 = 15.0 and Fp2 = 0, while the inset illustrates a blowup of the area near the onset of plastic depinning. The strongly pinned particles in channel 1 are able to effectively pin the particles in channel 2 via particle-particle interactions alone, allowing the pinned regime to persist for finite values of FD in spite of the fact that the pins in channel 2 have zero strength. For low d/a1 when the interactions between particles in neighboring channels are strong, the depinning of both channels occurs simultaneously in a single step at Fc from the pinned state to the moving locked state. As d/a1 increases, Fc increases and reaches a maximum value at d/a1 = 1.16 corresponding to the decoupling transition. For d/a1 above the decoupling transition, the depinning force Fc for channel 2 decreases monotonically with increasing d/a1, unlike the saturation that occurred in Fig. 3 for samples with Fp1=Fp2. As d/a1 increases, the coupling between the channels decreases monotonically, and since the particles in channel 2 are pinned only due to their interactions with the pinned particles in channel 1, Fc for channel 2 decreases with increasing d/a1. The transition line between the C and S phases, which corresponds to the depinning force Fc for channel 1, grows more rapidly above the decoupling transition with increasing d/a1 in Fig. 8 than it did for samples with Fp1=Fp2 in Fig. 3. This is because the particles in channel 2 produce relatively little effective drag for the particles in channel 1 when there is no pinning in channel 2, and this drag rapidly becomes nearly zero as d/a1 increases and the coupling between the channels decreases. The transition from the S to L phases also grows more rapidly with increasing d/a1 in Fig. 8 than for the samples with Fp1=Fp2. Our results show that coupling-decoupling transitions can persist even when the pinning in one channel is completely absent.
Fig8.png
Figure 8: The dynamic phase diagram FD vs d/a1 for the M=2 system in Fig. 2 with N1=N2, n1=n2, n1/N1=0.25, Rp=0.23a0, a1=1.5a0, Fp1 = 0 and Fp2 = 15.0. P: pinned phase; C: coexistence phase where only one channel is moving; S: sliding phase where V1V2 > 0; L: locked phase. As d/a1 increases, the depinning threshold for channel 1 goes to zero and the system immediately enters region C for small nonzero FD. Inset: A blowup of the main panel near the transition from elastic to plastic depinning.
For the parameters examined so far in this work we observe only weak hysteresis in the velocity-force curves occurring near the sharp jumps in V1 or V2. Hysteresis is often absent in 1D systems, as shown with the no-passing rule [43]; however, in studies using phase-field modeling, hysteresis has been observed in 1D systems [6]. In our system we never find hysteresis when the depinning is elastic, but hysteresis can occur for plastic depinning, as illustrated in Fig. 9(a), for a system with the same parameters as in Fig. 8 at d/a1 = 1.27. Here hysteresis occurs at the depinning transition only for the pin-free channel 2 but not for channel 1. The summed velocity V=V1+V2 also exhibits hysteresis at depinning, but by examining the separate velocity signals we can determine that the hysteresis originates from only one of the channels. Figure 9(a) also shows that there is no hysteresis across the S-L transition at FD=0.526 in spite of the discontinuous jump in both V1 and V2 that occurs at this transition. In Fig. 9(b) we plot V1 and V2 for cycled FD in a more weakly coupled sample with d/a1=1.33, further from the value of d/a1=1.16 where the transition from elastic to plastic depinning occurs. In this case we find dynamic locking of the channels above FD = 1.43; however, there is no hysteresis across any of the transitions.
Fig9.png
Figure 9: V1 (dark line) and V2 (light red line) vs FD under a cycled drive for the M=2 system in Fig. 8 with N1=N2, n1=n2, n1/N1=0.25, Rp=0.23a0, a1=1.5a0, Fp1=15.0 and Fp2=0.0. (a) At d/a1 = 1.27 we find hysteresis in V2 near the transition to the pinned phase but there is no hysteresis in V1. The arrows indicate the V2 curves obtained for sweeping FD up and down. (b) For the weaker coupling of d/a1=1.33, there is no hysteresis and dynamic coupling occurs at FD = 1.43.
We can also examine the effects of varying the relative pinning strength in the two channels by altering Fp1/Fp2 for a system with N1=N2, n1=n2, n1/N1 = 0.182, Rp = 0.35a0, and d/a1 = 1.7 as shown in Fig. 10. Here Fp2 = 0.75 and Fp1 is varied. For this particular set of parameters at Fp1/Fp2 = 1.0 the depinning is elastic. For 0 < Fp1/Fp2 < 0.6, the system depins plastically into the coexistence state where channel 1 is moving and channel 2 is pinned, and for higher FD the system enters the locking regime without passing through the sliding phase. At Fp1/Fp2 = 0 the depinning threshold of channel 1 is nonzero due to the strong interaction of the particles in channel 1 with the pinned particles in channel 2. As Fp1 increases from zero the width of the pinned region grows as the depinning threshold of channel 1 rises; however, for 0 < Fp1/Fp2 < 0.6 the depinning threshold of channel 2 remains constant since Fp2 is fixed. For 0.6 < Fp1/Fp2 < 1.0 the depinning is elastic and both channels depin simultaneously; further, within this regime the pinned region has the most rapid growth for increasing Fp1/Fp2. For Fp1/Fp2 > 1.0 the depinning becomes plastic again and each channel depins separately; however, channel 2 now depins first since Fp1 > Fp2. As Fp1/Fp2 increases above 1, the width of the pinned phase passes through a small dip but remains nearly constant since the depinning threshold of channel 2 is determined by Fp2 which is held fixed. Near Fp1/Fp2=1.2 we find the onset of the sliding phase, which grows rapidly in width with increasing Fp1/Fp2. The sliding phase is followed at higher FD by the dynamically locked phase. If we increase the fixed value of Fp2 and sweep Fp1/Fp2, the extent of the elastic depinning window diminishes as Fp2 becomes larger until for sufficiently large Fp2 there is no longer an elastic depinning regime. Instead, the sliding phase appears for all values of Fp1/Fp2. In Fig. 10, in order to sweep Fp1/Fp2 we held Fp2 fixed and varied Fp1. It would also be possible to vary Fp2 for fixed Fp1; however, this would produce a significantly different phase diagram, with the C and S phases both diverging as Fp1/Fp2 goes to zero. We have also considered samples with Fp1=Fp2 but with different pinning densities n1n2, and we find the same general features as a function of n1/n2 as we have shown here for varying Fp1/Fp2.
Fig10.png
Figure 10: Dynamic phase diagram FD vs Fp1/Fp2 for an M=2 system with N1=N2, n1=n2, n1/N1 = 0.182, Rp=0.35a0, a1=1.5a0, d/a1 = 1.7, and fixed Fp2=0.75. P: pinned phase; C: coexistence phase; S: sliding phase; L: locked phase. Near Fp1/Fp2 = 1.0, where the pinning strength is the same in both channels, the system depins elastically. The depinning becomes plastic once Fp1/Fp2 moves sufficiently far away from 1 in either direction.
In Fig. 11 we plot the dynamic phase diagram for FD versus Fp1 in a sample with equal pinning strength in both channels, Fp2=Fp1, and with d/a1 = 1.7. For Fp1 < 0.7, the depinning is elastic and the depinning force Fc drops to zero as Fp1 drops to zero. For Fp1 > 0.8, the depinning is plastic and all of the dynamical transition lines shift to higher FD for increasing Fp1, with the S to L transition increasing the most rapidly. In the inset of Fig. 11 we plot dFc/dFp1 versus Fp1 where we find a roughly linear increase in the regime 0 < Fp1 < 0.55. This implies that Fc ∝ (Fp1)2, which is consistent with elastic depinning in the collective regime [14]. Just above the transition to plastic depinning, dFc/dFp1 passes through a strong drop and then recovers to a nearly constant value near 1, consistent with FcFp as expected for the single particle limit. This result indicates that the transition from elastic to plastic depinning is associated with clearly observable features in the transport curves. If we fix Fp1 and instead increase the density of pinning sites while holding n1=n2, we find dynamical phases with tendencies similar to those shown in Fig. 11.
For the range of parameters considered here, we find hysteretic responses in the system with equal amounts of pinning in each layer only when one layer has very strong pinning and the other layer has very weak or zero strength pinning, but not when the pinning is of equal strength in the two layers. In the case of no pinning in one layer and strong pinning in the other, the hysteresis occurs due to the fact that the pin-free layer is able to form an equally spaced structure in the moving state. As the driving force is decreased, this ordered structure persists down to drives below that at which it originally formed since the particles in the pin free layer experience no direct fluctuations from pinning sites and only slowly varying fluctuations due to the pinned particles in the other layer. It may be possible that additional hysteresis could arise for pinning parameters not considered here. For example, in our system the pinning sites are not allowed to overlap and the pinning sites all have the same strength, but it would also be possible to introduce pinning sites of varied strength.
Fig11.png
Figure 11: Dynamic phase diagram FD vs Fp1 for an M=2 sample with Fp2=Fp1, N1=N2, n1=n2, n1/N1=0.25, Rp=0.23a0, a1=1.5a0, and d/a1=1.7. P: pinned phase; C: coexistence phase; S: sliding phase; L: locked phase. The depinning is elastic for Fp < 0.8. Inset: dFc/dFp1 for the same system shows a pronounced dip near the transition from elastic to plastic depinning.

V.  DENSITY DEPENDENCE AND DYNAMIC COMMENSURATION EFFECTS

We next consider the effect of holding the distance d between channels fixed while varying the density of the particles which changes the lattice constants a1 and a2. In Fig. 12 we plot the dynamic phase diagram as a function of FD and density 1/a1 for varied a1=L/N1 in a system with an equal number of particles in each channel, N1=N2, Fp1=Fp2=3.0, and with fixed d=2.75. The depinning threshold Fc generally decreases with increasing density due to the increase in the particle-particle interactions relative to the pinning strength as the particles get closer together within each channel. For intermediate densities of 0.305 < 1/a1 < 0.47, the depinning is elastic, while for 0.07 < 1/a1 < 0.305, the depinning is plastic and the sample enters either the coexistence phase C, the sliding phase S, or a pulsed coexistence phase PC. Each channel is alternately pinned or moving in the PC phase, so that this phase resembles the C phase except that the stationary and moving channels keep switching places. At lower densities 1/a1 < 0.305, the system no longer depins elastically due to the increase of the effectiveness of the pinning, which induces a decoupling of the channels. For 1/a1 < 0.07, we have N1 > n1. Since there are more pinning sites than particles, the depinning occurs in the single particle limit and it is no longer meaningful to describe the pinning as plastic or elastic since the particles in the channels are essentially noninteracting at depinning. Additionally, since Fp1 and Fp2 are held fixed, at these low densities all the particles in each channel depin simultaneously and move at the same velocity so the C and S phases cannot occur.
Figure 12 shows that for 1/a1 > 0.47, the depinning is plastic again and the S-L transition shifts to higher FD with increasing 1/a1. This might seem surprising since at higher densities the interactions between particles in the same channel become stronger; however, it is known from studies of layered vortex systems that increasing the field can reduce the coupling between layers for fields well below Hc2 [40]. As the density increases, the interactions between particles in the same channel become stronger more rapidly than the interactions between particles in neighboring channels. This enhances the S phase since it becomes more difficult for the channels to lock. In order to minimize energy, the moving particles adopt a zig zag configuration with the particles in one channel offset relative to the particles in the other channel. This approximates a triangular lattice configuration. As 1/a1 increases, the lattice spacing along the channels shrinks but the lattice spacing perpendicular to the channels is fixed, producing an effectively increasingly anisotropic triangular lattice configuration. Eventually the spacing becomes so anisotropic that there is very little energy difference between an alternating configuration and one in which the particles are adjacent to each other, so the channels decouple.
The phase diagram in Fig. 12 exhibits a number of features found in phase diagrams for strongly layered superconductors containing disordered pinning sites. For example, the superconducting system undergoes a low field decoupling transition when the pancake vortices in each layer are far apart and only weakly interacting, while at higher fields there is a field induced decoupling [40]. In experiments, samples show both a low field disordering transition and a high field decoupling transition [44]. It was argued that the low field transition is pinning induced and occurs when the pinning energy overwhelms the weak vortex-vortex interactions at low vortex density, while the higher field disordering transition indicates the onset of the peak effect [44]. In our system, as we increase Fp the lower and upper endpoints of the elastic depinning regime approach each other until the elastic depinning disappears completely. Conversely as we decrease Fp the elastic depinning region becomes more extended. Although there is a small increase in Fc at the lower transition from plastic to elastic depinning, we find no feature in Fc at the upper transition from elastic to plastic depinning; however, if we measure the average particle velocity for fixed drive, the velocity drops across the higher density transition, similar to the effect illustrated in Fig. 4.
Fig12.png
Figure 12: Dynamic phase diagram FD vs density 1/a1 for an M=2 sample with N1=N2, n1=n2, a1=a2, n1/N1=0.25, Rp=0.35a0, d=2.75a0, and Fp1=Fp2=3.0. P: pinned phase; C: coexistence phase; S: sliding phase; L: locked phase. For 0.07 < 1/a1 < 0.305, the system transitions from a pinned phase into a pulsed coexistence phase PC.
We next examine the effects of varied particle ratio for a sample with Fp1=Fp2=6.0, n1=n2, d/a2=1.33, and n2/N2=0.167. We fix N2 and vary N1. In Fig. 13(a) we plot 2V1/N and 2V2/N versus FD for a sample with N1/N2=1/2. Here the velocities are normalized by N/2, where N=N1+N2. In this case, channel 2 contains a larger number of particles and depins at lower FD than channel 1. The slope of 2V2/N is also greater than that of 2V1/N. We replot the same curves in Fig. 13(b) with the normalizations V*1=V1/N1 and V*2=V2/N2. Under this normalization the curves have almost the same form as the velocity force curves in samples with an equal number of particles in each channel, and it is now possible to distinguish the transition into a locked phase, which also appears as a signature in the dV*1/dFD and dV*2/dFD curves shown in Fig. 13(b). At other fillings such as N1/N2 = 0.375 shown in Fig. 13(c), there is no dynamical locking within this range of FD. For lower fillings, dynamical locking appears again as shown in Fig. 13(d) for N1/N2 = 0.292. We find dynamical locking only for N1/N2 = 1.0, N1/N2=1/2, and N1/N2 < 0.333.
Fig13.png
Figure 13: Channel velocities vs FD for an M=2 system with Fp1=Fp2=6.0, n1=n2, n2/N2=0.167, Rp=0.23a0, and d/a2=1.33 for fixed N2 and varied N1. (a) 2V1/N (lower dark line) and 2V2/N (upper light red line) for N1/N2 = 1/2. The velocities are normalized by N/2, where the total particle number N=N1+N2. Channel 2 contains a larger number of particles than channel 1 and therefore V2 increases more rapidly than V1. (b) The same curves plotted as V*1=V1/N1 (lower dark line) and V*2=V2/N2 (upper light red line). Here a clear dynamical locking transition appears. Also shown are the corresponding dV*1/dFD (heavy green line) and dV*2/dFD (light blue line) curves. (c) V*1 (lower dark line) and V*2 (upper light red line) for N1/N2 = 0.375. Here no dynamical locking occurs within this range of FD. (d) V*1 (lower dark line) and V*2 (upper light red line) for N1/N2=0.292 where dynamical locking occurs.
Fig. 14(a) shows the dynamic phase diagram for FD versus N1/N2 for the system in Fig. 13. The solid line at N1/N2 = 1.0 indicates that at this ratio the depinning is elastic and the system passes directly from the pinned to the moving locked phase. For N1/N2 < 1.0, channel 2 depins first since it contains a larger number of particles, and the depinning threshold of channel 1 grows with decreasing N1/N2 until reaching a maximum value of Fc=Fp1=6.0 at the lowest values of N1/N2. The dotted line at N1/N2=1/2 in Fig. 14(a) indicates a transition from the S to the L phase at FD=4.5 as illustrated in Fig. 13(b). For lower fillings N1/N2 ≤ 0.33 the system enters the locked state above FD = 7.0. For N1/N2 > 1.0, channel 1 depins first since it now contains a larger number of particles than channel 2, and the depinning threshold for channel 2 remains nearly constant as N1/N2 increases. We note that there could be a dynamical locking at external drives much higher than the range of FD we consider here.
In Fig. 14(b) we plot a blowup of the phase diagram from Fig. 14(a) near the depinning transition. Clear local minima in Fc appear at N1/N2 = 1.0 where the depinning is elastic and at N1/N2 = 0.5 where the depinning is not elastic but where the dynamical locking occurs at a much lower drive than for nearby fillings. The behavior at these two fillings can be viewed as a commensuration effect, where the coupling between the layers is enhanced at integer and certain fractional ratios of the filling factors. Commensuration effects have been studied in a variety of solid-on-solid systems where there is matching between the number of particles and the number of potential minima [45]. An example of such a system is vortices in type-II superconductors with periodic pinning sites where peaks in the critical depinning force occur at integer [46] and rational [47] matching fields. In our system commensuration occurs not between the number of particles and the number of pinning sites but between the number of particles in the different channels. The depinning force is reduced at the commensurate fillings due to the enhanced coupling between the layers. The strongest dip in Fc occurs when the depinning is elastic at N1/N2 = 1.0, while for fillings just above and below this value Fc passes through local maxima. At the incommensurate fillings, there are geometrically necessary topological defects that enter the zig-zag structure formed by the particles in the two channels. These defects effectively soften the structure and reduce the coupling between the layers. This is similar to what occurs in the peak effect where the depinning force is higher for plastic depinning than for elastic depinning. We find no apparent anomaly at N1/N2 = 2.0 in Fig. 14(b); however, we expect that for other parameter values, more commensuration effects would be observable and that additional dynamical locking regimes would also appear at other fillings. Commensuration effects are also observed in two layer and three layer systems without pinning when only one layer is driven [39]. In these systems the commensuration effects occur at fillings where the channels are more strongly coupled, so that the drive at which relative slip begins to occur between the channels is much higher than for incommensurate fillings. Our results indicate that a distinct commensuration effect can occur in layered systems that differs from commensuration effects observed for particles moving over fixed substrates. At the incommensurate fillings in the moving phases, the particles attempt to form an equilibrium zig-zag structure of the type that appears at commensurate fillings. Away from commensurability, however, the zig-zag structure is defected or unable to form and the lattice structure does not lock the channels together, causing the loss of the locked phase at incommensurate fillings.
It is also possible to change the overall particle-particle interaction strength by varying q2. This can be achieved for colloidal systems by altering the effective charge on the particles or by changing the screening length. For vortex systems the vortex-vortex interactions can also change significantly due to thermal effects near Tc. In Fig. 14(c) we plot the dynamic phase diagram for FD versus q2 for the system in Fig. 14(a) with N1/N2=1, Fp1=Fp2 = 6.0 and d/a2 = 1.33. For q2 > 1.23 or strong particle-particle repulsion the system depins elastically and as q2 increases Fc gradually decreases. Unlike the case for constant q2 but increasing density 1/a1 shown in Fig. 12, we find in Fig. 14(c) that there is no elastic-plastic transition at high q2 since the zig-zag particle configuration is not affected by increasing q2. When q2 is lowered, Fc increases and a transition from elastic to plastic depinning occurs at q2=1.15. For q2 < 1.15, the system depins into the pulsed coexistence (PC) phase described earlier in Fig 12. The transition into the L phase also shifts to higher FD as q2 decreases. The overall features of the phase diagram in Fig. 14(c) resemble those of the dynamic phase diagrams constructed for 2D vortex systems when the vortex-vortex interaction strength is varied [15,48]. In the vortex case, Fc increases as the vortex-vortex interactions become weaker while the dynamical ordering transition shifts to higher values of the driving force. In the inset of Fig. 14(c) we plot dFc/dq2 versus q2, showing more clearly the change in the slope of Fc at the transition from plastic to elastic depinning at FD=1.15.
Fig14.png
Figure 14: (a) Dynamic phase diagram FD vs N1/N2 for the M=2 system in Fig. 13 with n1=n2, n2/N2=0.167, Rp=0.23a0, d/a2 = 1.33 and Fp1 = Fp2 = 6.0. P: pinned phase; C: coexistence phase; S: sliding phase; L: locked phase. The line at N1/N2 = 1.0 indicates that for this filling only the system depins elastically directly into the L phase. The dashed line at N1/N2 = 0.5 indicates a transition from the S phase into the L phase at this filling. (b) A blowup of panel (a) in the region near the depinning line shows dips in the depinning force Fc at N1/N2 = 0.5 and 1.0. (c) Dynamic phase diagram FD vs q2, where q2 is the dimensionless squared colloid charge, for a sample with n1=n2, n2/N2=0.167, N1/N2=1, Rp=0.23a0, Fp1 = Fp2 = 6.0, and d/a1 = 1.33. PC: the pulsed coexistence phase described in Fig. 12. For strong interactions (high q2) the depinning is elastic. For small q2 the depinning threshold is high. Inset: dFc/dq2 vs q2 for the same sample shows that at q2=1.15 at the transition from plastic to elastic depinning there is a peak corresponding to a change in the slope of the depinning curve.

VI.  MORE THAN TWO CHANNELS

We next consider the case of M > 2 coupled driven channels and in general find many of the same effects for the two channel system. Figure 15 shows the velocity-force curves V1 through V8 versus FD for an M=8 channel system with Nj=N1, nj=n1, d/a1 = 1.33, and n1/N1 = 0.17. In Fig. 15(a) at Fpj=Fp1 = 3.0, the depinning is elastic and the system immediately enters the locked phase upon depinning. All the channels depin simultaneously and the velocity curves overlap completely. In Fig. 15(b) at Fpj=Fp1 = 5.0 the depinning is plastic. Channels 1, 2, and 3 depin first and remain locked with each other, followed by the depinning of a group of four additional locked channels and then by the depinning of the final channel. At FD = 0.182 all the channels become dynamically locked together. For Fpj=Fp1 = 7.0 in Fig. 15(c), the system exhibits a hierarchy of dynamical locking transitions beginning at FD=0.186 when the first three channels to depin become locked together. This is followed by a second dynamic locking of four different channels at FD = 0.25. Channel 8 dynamically locks with these four channels near FD = 0.335, and a final locking of all the channels with each other occurs at FD = 0.37. As Fp increases the number of distinct dynamical locking transitions increases, as illustrated in Fig. 15(d) for Fpj=Fp1=11.0, while the final transition at which all of the channels lock together shifts to higher values of FD. Figure 15(d) also shows that it is possible for individual channels to exhibit negative differential conductivity at the onset of channel locking; however, there is generally no NDC in the summed velocity V=∑jMVj. In order to show that the C and S phases correspond to states with topological defects, in Fig. 16 we plot the Voronoi construction of the particle positions. Figure 16(a) shows the S phase from Fig. 15(c) at Fd = 0.3, where dislocations appear in the form of 5−7 pairs that are aligned with the direction of drive. The positions and number of dislocations fluctuate with time in this regime. For stronger pinning where more channels are uncoupled, there are more dislocation pairs. Figure 16(b) shows the locked phase at Fd = 0.5 where the channels move together and the particles form a triangular lattice without any dislocations or slipping between channels.
Fig15.png
Figure 15: Vj vs FD for an M=8 system with Nj=N1, nj=n1, n1/N1=0.17, Rp=0.23a0, a1=1.5a0, and d/a1=1.33. (a) At Fpj=Fp1 = 3.0, the depinning is elastic and all channels depin simultaneously into the locked state. (b) At Fpj=Fp1 = 5.0, plastic depinning occurs and groups of channels lock together with each group depinning at a different value of FD. At high drives all the channels lock. P: pinned phase; C: coexistence phase, defined as beginning when the first channel depins and ending when the final channel depins; L: locked phase. (c) At Fpj=Fp1 = 7.0, more channels depin individually. A window of the sliding (S) phase appears where all channels are moving but groups of channels are separately locked. (d) At Fpj=Fp1 = 11.0, the same four dynamical phases appear but are shifted to higher values of FD.
Fig16.png
Figure 16: The Voronoi construction for the system in Fig. 15(c). Dots: particle positions. Small black dots indicate sixfold coordinated particles, large black dots are sevenfold coordinated particles, and large grey dots are fivefold coordinated particles. (a) In the S phase at Fd = 0.3, dislocations appear as paired 7-5 fold coordinated particles that are aligned with the driving direction. (b) In the L phase at Fd = 0.5, all the particles keep their same neighbors and form a triangular lattice.
Fig17.png
Figure 17: Dynamic phase diagram FD vs Fp1 for the M=8 system in Fig. 15 with Nj=N1, nj=n1, Fpj=Fp1, n1/N1=0.17, Rp=0.23a0, a1=1.5a0, and d/a1=1.33. P: pinned phase; C: coexistence phase; S: sliding phase; L: locked phase.
Figure 17 shows the dynamic phase diagram FD versus Fp1 for the M=8 system in Fig. 15 with Fpj=Fp1. In Fig. 18 we plot the dynamic phase diagram FD versus d/a1 for the same M=8 system with Fpj=Fp1=3.0 and fixed a1=1.5a0. At low d/a1 the system depins elastically, and a transition to plastic depinning occurs near d/a1=1.4. For d/a1 > 1.4, the transition between the S and L phases shifts to higher FD with increasing d/a1, while the general shape of the phase diagram resembles that of the M=2 system shown in Fig. 3. The C and S phases again contain multiple depinning and dynamical locking transitions, respectively. In the inset of Fig. 18 we plot a blowup of the FD versus d/a1 phase diagram near the depinning transition to show that Fc passes through a peak at the transition from elastic to plastic depinning, similar to the peak found for the M=2 system in the inset of Fig. 3(a).
Fig18.png
Figure 18: Dynamic phase diagram FD vs d/a1 for the M=8 system in Fig. 17 with Fpj=Fp1 = 3.0, Nj=N1, nj=n1, n1/N1=0.17, Rp=0.23a0, and fixed a1=1.5a0. P: pinned phase; C: coexistence phase; S: sliding phase; L: locked phase. Inset: Blow up of the region near the transition from elastic to plastic depinning shows that the depinning force Fc peaks at the transition.
For systems in which the number of particles per channel is allowed to vary, NjN1, the dynamic behavior becomes more complex; however, it is possible to identify several general features. In Fig. 19 we plot Vj* versus FD for an M=8 channel with Fpj=Fp1=2.0 and d=1.7a0 where each channel contains either Nhigh particles with d/aj=1.33 or Nlow particles with d/aj=1.2267. The velocities are normalized by Vj*=Vj/Nhigh, and the number of pins in each channel is nj/Nhigh=1.67. In samples where all channels have equal numbers of particles, Nj=N1=Nhigh or Nj=N1=Nlow, the depinning is elastic for this set of parameters. The depinning becomes plastic when the number of particles differs from channel to channel. Figure 19(a) illustrates an alternating density system with N1=N3=N5=N7=Nhigh and N2=N4=N6=N8=Nlow. Here every channel has a unique depinning threshold. There are multiple locking and unlocking transitions as channels become locked with a nearest neighbor channel at lower drives only to unlock at higher drives. As FD increases, the effectiveness of the pinning is reduced and the density within each channel becomes more homogeneous. At the same time, the overall effectiveness of the pinning in channels with Nhigh is reduced relative to that of the pinning in channels with Nlow due to the stronger particle-particle interactions in the higher density channels. The velocity Vhigh in channels with Nhigh is therefore higher than the velocity Vlow in channels with Nlow, Vhigh > Vlow, which favors decoupling of adjacent channels in the alternating density system. For high enough drives FD > 0.14, the system enters a doubly locked phase where all channels containing the same number of particles are locked together, V1=V3=V5=V7 and V2=V4=V6=V8, but V1 > V2 by a small amount so that the two sets of locked channels slip with respect to each other.
There are many other possible ways to arrange the M=8 channels such that half of the channels contain Nhigh particles and half of the channels contain Nlow particles. For example, Fig. 19(b) shows Vj* versus FD in a density segregated system with N1=N2=N3=N4=Nlow and N5=N6=N7=N8=Nhigh. Here each group of channels with equal density acts as a unit and depins elastically into a locked moving state; however, the two groups of channels do not lock with each other. The depinning occurs in two steps with a lower depinning threshold for the set of channels containing Nlow particles. In Fig. 19(b) we find that V1* > V5* just above the second depinning transition but V1* < V5* at high FD, with a crossing of the velocity curves occurring near FD=0.105.
Fig19.png
Figure 19: Vj* vs FD for an M=8 system with NjN1, nj=n1, Fpj=Fp1=2.0, nj/Nhigh=0.167, Rp=0.23a0, and d=1.7a0. Each channel has one of two possible densities: d/aj=1.33 for Nj=Nhigh or d/aj=1.2267 for Nj=Nlow. All of the velocities are normalized by Vj*=Vj/Nhigh. (a) A sample with alternating density N1=N3=N5=N7=Nhigh and N2=N4=N6=N8=Nlow. All eight channels depin at different values of FD and undergo a series of locking and unlocking transitions until reaching a state at higher drives where all the low density channels are locked together and all the high density channels are locked together. (b) A sample with the same parameters but with segregated density N1=N2=N3=N4=Nlow and N5=N6=N7=N8=Nhigh shows a two step depinning process.
In samples with an equal number of particles per channel, particles in neighboring channels can organize into a two-dimensionally ordered state in order to minimize the particle-particle interaction energy. This ordered configuration can be perturbed by changing the number of particles in one or more channels, which causes defects to appear. To study this, we consider an M=8 system in which all channels initially contain Nj=Nlow particles with d/aj=1.133. We select R channels evenly spaced across the system with 0 ≤ RM and increase the number of particles in the selected channels to Nj=Nhigh with d/aj=1.216. As R varies, the system passes from a state in which all channels have Nj=Nlow at R/M=0 to one in which all channels have Nj=Nhigh at R/M=1. Fig. 20 shows Fcfirst, the value of FD at which the first channel depins, and Fclast, the value of FD at which the final channel depins, for different values of R/M. The geometrically necessary dislocations that form for intermediate values of R/M are aligned with the direction of the drive. At R/M=0 and 1, dislocations are absent and the depinning transition is elastic, but for other values of R/M when dislocations are present, the depinning is plastic and the depinning thresholds are shifted to higher values of FD. This can also be seen in Fig. 19: the alternating filling sample in Fig. 19(a) contains numerous topological defects and has much higher depinning thresholds than the segregated filling sample in Fig. 19(b), where there are only dislocations along the interface between the two fillings. The results in Fig. 19 and Fig. 20 are similar to previous work on mixtures of particles in the presence of a weak disordered substrate, which showed that the depinning force is minimized when only one particle species is present and there are no topological defects, but that for intermediate mixtures of particle species, topological defects appear and increase the depinning force [49].
Fig20.png
Figure 20: The depinning thresholds Fcfirst (lower curve) and Fclast (upper curve) vs R/M for the M=8 sample from Fig. 19(a) with nj=n1, Fpj=Fp1=2.0, nj/Nhigh=0.167, Rp=0.23a0, d=1.7a0, d/aj=1.133 for Nj=Nlow, and d/aj=1.216 for Nj=Nhigh. There are R evenly spaced channels with Nj=Nhigh and the remaining MR channels have Nj=Nlow. When the system is commensurate with Nj=N1 at R/M=0 or R/M=1, the depinning is elastic. For other values of R/M the depinning is plastic, and the maximum depinning thresholds appear when geometrically necessary dislocations form in the system.
Fig21.png
Figure 21: The time trace of the velocities of the individual channels, Vj(t), for the M=8 sample from Fig. 19(a) with N1=N3=N5=N7=Nhigh and N2=N4=N6=N8=Nlow. (a) At FD = 0.08 the system is in the coexistence phase. Channels 3 and 4 are pinned, channel 5 flows intermittently, channels 1 and 2 are locked at a low average velocity, and channels 6, 7, and 8 are locked at a higher average velocity. (b) At FD = 0.09 there is considerably more intermittency. Here channels 1, 2, 7 and 8 are locked continuously, while channels 3, 4, 5, and 6 show intermittent locking with the other channels. (c) At FD = 0.125 there is less intermittency and a larger number of the channels are locked with other channels. (d) At FD = 0.16, channels 1, 3, 5, and 7 are locked and due to their higher density move with a higher velocity than the remaining channels 2, 4, 6, and 8, which are locked together.
The locking-unlocking transition that occurs for the alternating density sample in Fig. 19(a) can be better characterized by analyzing the time series Vj(t) of the velocities of the individual channels at different values of FD. In Fig. 21(a), where we plot Vj(t) at FD = 0.08, the system is in the coexistence regime and channels 3 and 4 are pinned. Channel 5 switches between a temporarily pinned state and a sliding state, with occasional jumps to higher velocity flow. Channels 1 and 2 are locked together and have an average velocity of V1=V2=0.052, while channels 6, 7, and 8 are locked together at a slightly higher average velocity of V6=V7=V8=0.055 and show a pronounced modulation at a frequency which matches the frequency at which V5 drops to zero. The point at which V5 reaches zero corresponds to the point at which V6, V7, and V8 reach their maximum values. Numerous periodic oscillations appear in the velocities, such as the washboard frequency of the particles moving over the pinning sites. Additionally, each channel has a periodicity determined by the value of Nj, and since this frequency differs from channel to channel, the channels sliding past one another experience a dynamic periodic potential caused by the periodicity of the particles. This slipping process is not completely periodic but shows some changes over time. For lower drives, more channels are pinned and the velocity signals become increasingly periodic. We note that for the M=2 case illustrated in Fig. 7 the velocity time traces were dominated by the fundamental frequencies which were washboard signals.
Figure 21(b) shows Vj(t) in the same sample for FD = 0.09. Here there is considerable intermittency and several channels lock and unlock. Channels 1, 2, 7, and 8 are locked and move at V1=V2=V7=V8=0.0625. Channel 3 has the lowest average velocity and intermittently locks with channel 4, which has the second lowest average velocity. Channel 4 locks intermittently with both channels 3 and 6, as well as much more infrequently locking with the group of channels 1, 2, 7, and 8. Channel 6 also locks intermittently with the channel group 1, 2, 7, and 8 as well as with channel 4. Channel 5 has the highest average velocity and intermittently locks to the lower velocity value of the group of channels 1, 2, 7, and 8. In Fig. 21(c) at FD=0.125, the amount of intermittency is reduced. Channels 2, 4, 6, and 8 are locked together and have a lower average velocity, while channels 5 and 7 lock together and have a higher but strongly fluctuating velocity. Channel 1, which moves independently, reaches the highest velocity values, while channel 3, which also moves independently, reaches the lowest velocity values. At FD = 0.16, shown in Fig. 21(d), the high density channels 1, 3, 5, and 7 are locked together and move at a higher average velocity while the low density channels 2, 4, 6, and 8 also lock with each other and move at a lower average velocity.
The multiple channel system exhibits many of the features predicted in mean field studies of phase slip systems [37], such as the coexistence of sliding and pinned phases. There are, however, many features of the multiple channel system that are not captured by the mean field results, such as the multiple coupling and decoupling transitions between pairs of channels or groups of channels or the peak effect in the depinning threshold at the transition from elastic to plastic depinning. Additionally, for both the two channel and multiple channel systems, the case where different amounts of disorder exist in each channel has not been studied with mean field models. We note that that there are many more parameters that can be explored for the multiple channel systems, such as having different densities or pinning strengths for each channel; however, the results for the dynamic phase diagram for the multiple channel system suggest that many of the generic features observed for the two level system will persist in the multiple channel system. We will explore this in more detail elsewhere.

VII.  DISCUSSION

In our model the particles are strictly confined to 1D channels; however, in many real systems the channels can have a finite width and it is even possible to have a zig-zag pattern form within a single channel when the system becomes dense enough. To explore such issues, the first step would be to consider a single finite width channel and to test whether there is a change in the depinning threshold when the particles change from a 1D line to a buckled or zig-zag state within the channel. One might expect the depinning threshold to increase in the buckled phase since large pileups behind pinned particles are reduced when the particles can move around each other. There is also the question of whether the phases we observe would also occur for coupled 2D layers, where again particles can move around each other and avoid pile-ups. We note that a series of coupled 2D layers resembles layered vortex systems in which elastic-plastic transitions are observed along with a peak effect, suggesting that many of the phases we find can also occur in higher dimensions. Another issue is that fluctuations are generally strongly enhanced in 1D systems, suggesting that in sufficiently large systems, some rare regions containing large fluctuations would produce early decoupling. We found no size effects when we tested systems of different size except for samples considerably smaller than those presented here. Large fluctuations are reduced in our system both because we restrict ourselves to T = 0 and because we consider nonoverlapping pinning sites that are all the same strength within a channel. If we allowed overlapping pinning sites, then in sufficiently large systems we would have rare regions of very strong pinning that would induce a decoupling transition. The same effect would occur if we considered a broad distribution of pinning strengths. For higher dimensional systems, many of the effects we observe could in principle persist for finite temperatures and for pinning that is more random. Another interesting avenue to explore would be periodic or quasiperiodic pinning where additional commensuration effects could occur between the particles and the substrates as well as between particles in adjacent layers.

VIII.  SUMMARY

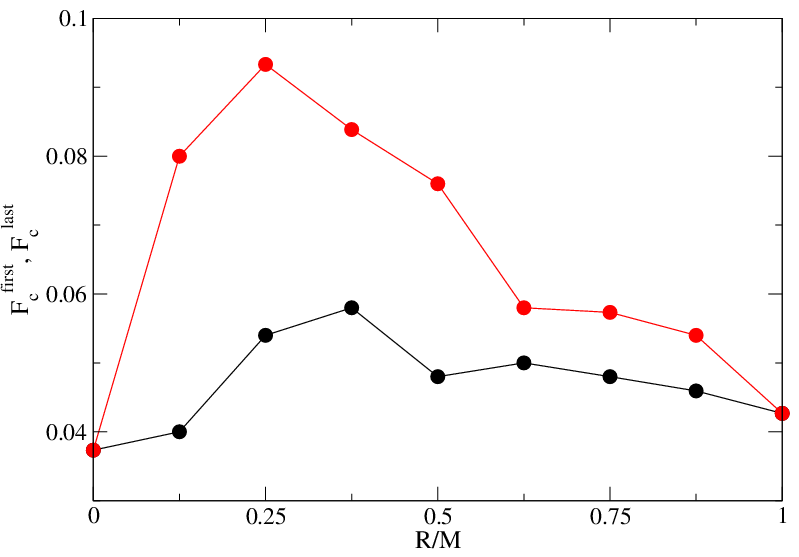
We have examined systems of two or multiple one-dimensional channels of coupled particles that interact repulsively within each channel and between the channels. The particles are uniformly driven with an external drive and in the presence of quenched disorder show a series of dynamic phases including a pinned phase, a coexistence between pinned and sliding phases, a sliding phase where the channels move at different average velocities and slip past one another, and a dynamically locked phase where the particle positions in the channels become locked and the channels move at the same velocity. The transitions between these different phases can be observed as clear features in the velocity force curve characteristics. These features include a sudden drop in the velocity or the onset of negative differential conductivity in one of more of the channels at the dynamically induced locking transition. For weak pinning or strong channel coupling, the depinning occurs elastically without any slipping between channels. When the system parameters are varied, such as by decreasing the coupling between channels, we find a transition to plastic depinning, with the initial flow above depinning in the coexistence regime where the channels depin separately. At the transition between elastic and plastic depinning, a peak in the depinning force appears which resembles the peak effect phenomenon found in more complicated models with transitions between elastic and plastic depinning. We have also examined channels containing unequal numbers of pinning sites or particles and find that even for a channel containing no pinning, there can be a finite depinning threshold due to the coupling of the particles in the pin-free channel with the particles in a channel containing pinning. For unequal numbers of particles in the channels we observe commensurability effects where the depinning threshold drops when the depinning becomes elastic for particle number ratios at which the coupling between particles in neighboring channels is enhanced, such as at 1:1 or 2:1. At the incommensurate fillings the channels always depin plastically. For multiple channels we find a hierarchy of dynamically induced coupling phases in which different groups of channels couple, while at higher drive all of the channels become coupled. Despite the apparent simplicity of our model, we find that even the two channel system exhibits many of the prominent features of depinning in more complex models such as the existence of multiple dynamical phases as well as elastic to plastic depinning transitions of the type that have been studied for more complicated systems including 3D layered systems.
The specific model studied in this paper could be realized using colloidal particles in coupled 1D channels or in superconductors with a one-dimensional corrugation combined with random pinning where the vortices move along the easy flow direction of the corrugation. Other possible realizations include coupled channels of 1D wires where Wigner crystallization may occur.

  Acknowledgments

This work was carried out under the auspices of the NNSA of the U.S. DoE at LANL under Contract. No. DE-AC52-06NA25396.

References

[1]
R.M. Fleming and C.C. Grimes, Phys. Rev. Lett. 42, 1423 (1979); G. Grüner, Rev. Mod. Phys. 60, 1129 (1988); R.E. Thorne, Physics Today 49(5), 42 (1996).
[2]
D.S. Fisher, Phys. Rev. B 31, 1396 (1985).
[3]
C.R. Myers and J.P. Sethna, Phys. Rev. B 47, 11171 (1993).
[4]
H.J. Jensen, A. Brass, Y. Brechet, and A.J. Berlinsky, Phys. Rev. B 38, 9235 (1988); D. Domínguez, Phys. Rev. Lett 72, 3096 (1994); M.C. Faleski, M.C. Marchetti, and A.A. Middleton, Phys. Rev. B 54, 12427 (1996); Q.-H. Chen and X. Hu, Phys. Rev. Lett. 90, 117005 (2003); E. Olive and J.C. Soret, Phys. Rev. Lett. 96, 027002 (2006); N. Mangan, C. Reichhardt, and C.J. Olson Reichhardt, Phys. Rev. Lett. 100, 187002 (2008); P. Moretti and M.-Carmen Miguel, Phys. Rev. B 79, 104505 (2009); Y. Fily, E. Olive, N. Di Scala, and J.C. Soret, Phys. Rev. B 82, 134519 (2010).
[5]
S. Bhattacharya and M.J. Higgins, Phys. Rev. Lett. 70, 2617 (1993).
[6]
J.A.P Ramos, E. Granato, S.C. Ying, C.V. Achim, K.R. Elder, and T. Ala-Nissila, Phys. Rev. E 81, 011121 (2010).
[7]
J. Tekic, O.M. Braun, and B. Hu, Phys. Rev. E 71, 026104 (2005).
[8]
Y. Yang, W.-S. Duan, J.-M. Chen, L. Yang, J. Tekic, Z.-G. Shao, and C.-L. Wang, Phys. Rev. E 82, 051119 (2010).
[9]
C. Reichhardt and C.J. Olson, Phys. Rev. Lett. 89, 078301 (2002); C. Reichhardt and C.J. Olson Reichhardt, Phys. Rev. E 77, 041401 (2008); C. Reichhardt and C.J. Olson Reichhardt, Phys. Rev. Lett. 103, 168301 (2009).
[10]
A. Pertsinidis and X.S. Ling, Phys. Rev. Lett. 100, 028303 (2008).
[11]
S.S. Banerjee et al., Phys. Rev. B 58, 995 (1998); W. Henderson, E.Y. Andrei, and M.J. Higgins, Phys. Rev. Lett. 81, 2352 (1998); Z.L. Xiao, E.Y. Andrei, P. Shuk, and M. Greenblatt, Phys. Rev. Lett. 86, 2431 (2001); L. Ammor, A. Ruyter, V.A. Shaidiuk, N.H. Hong, and D. Plessis, Phys. Rev. B 81, 094521 (2010); S. Okuma, Y. Tsugawa, and A. Motohashi, Phys. Rev. B 83, 012503 (2011); I. Guillamón, H. Suderow, S. Vieira, J. Sesé, R. Córdoba, J.M. De Teresa, and M.R. Ibarra, Phys. Rev. Lett. 106, 077001 (2011).
[12]
J. Watson and D.S. Fisher, Phys. Rev. B 54, 938 (1996).
[13]
A.E. Koshelev and V.M. Vinokur, Phys. Rev. Lett. 73, 3580 (1994).
[14]
K. Moon, R.T. Scalettar, and G.T. Zimányi, Phys. Rev. Lett. 77, 2778 (1996); F. Pardo , F. de la Cruz, P.L. Gammel, E. Bucher and D.J. Bishop, Nature (London) 396, 348 (1998); A.B. Kolton, D. Domínguez, and N. Grønbech-Jensen, Phys. Rev. Lett. 83, 3061 (1999).
[15]
C.J. Olson, C. Reichhardt, and F. Nori, Phys. Rev. Lett. 81, 3757 (1998).
[16]
A. Sengupta, S. Sengupta, and G.I. Menon, Phys. Rev. B 81, 144521 (2010); C.J. Olson Reichhardt, C. Reichhardt, and A.R. Bishop, Phys. Rev. E 83, 041501 (2011).
[17]
J. Gutierrez, A.V. Silhanek, J. Van de Vondel, W. Gillijns, and V.V. Moshchalkov, Phys. Rev. B 80, 140514(R) (2009); S. Avci, Z.L. Xiao, J. Hua, A. Imre, R. Divan, J. Pearson, U. Welp, W.K. Kwok, and G.W. Crabtree, Appl. Phys. Lett. 97, 042511 (2010).
[18]
P.T. Korda, M.B. Taylor, and D.G. Grier, Phys. Rev. Lett. 89, 128301 (2002); D.G. Grier, Nature (London) 424, 810 (2003); M.P. MacDonald, G.C. Spalding, and K. Dholakia, Nature (London) 426, 421 (2003); K. Xiao and D.G. Grier, Phys. Rev. Lett. 104, 028302 (2010).
[19]
A.M. Lacasta, J.M. Sancho, A.H. Romero, and K. Lindenberg, Phys. Rev. Lett 94, 160601 (2005); C. Reichhardt and C.J. Olson Reichhardt, Phys. Rev. E 79, 061403 (2009).
[20]
C. Reichhardt, C.J. Olson, and F. Nori, Phys. Rev. Lett. 78, 2648 (1997); C. Reichhardt, G.T. Zimányi, and N Grønbech-Jensen, Phys. Rev. B 64, 014501 (2001); C. Reichhardt and C.J. Olson Reichhardt, Phys. Rev. B 78, 180507(R) (2008).
[21]
L. Balents, M.C. Marchetti, and L. Radzihovsky, Phys. Rev. B 57, 7705 (1998); P. Le Doussal and T. Giamarchi, Phys. Rev. B 57, 11356 (1998).
[22]
V.M. Vinokur and T. Nattermann, Phys. Rev. Lett. 79, 3471 (1997).
[23]
C.J. Olson, G.T. Zimányi, A.B. Kolton, and N. Grønbech-Jensen, Phys. Rev. Lett. 85, 5416 (2000).
[24]
C.J. Olson, C. Reichhardt, and V.M. Vinokur, Phys. Rev. B 64, 140502(R) (2001).
[25]
R. Besseling, P.H. Kes, T. Dröse, and V.M. Vinokur, New J. Phys. 7, 71 (2005); K. Yu, M.B.S. Hesselberth, P.H. Kes, and B.L.T. Plourde, Phys. Rev. B 81, 184503 (2010).
[26]
M.C. Marchetti, A.A. Middleton, K. Saunders, and J.M. Schwarz, Phys. Rev. Lett. 91, 107002 (2003).
[27]
P. Le Doussal, M.C. Marchetti, and K.J. Wiese, Phys. Rev. B 78, 224201 (2008).
[28]
Z.G. Zhao, Y.X. You, J. Wang, and M. Liu, EPL 82, 47003 (2008).
[29]
Q-H. Wei, C. Bechinger, D. Rudhardt, and P. Leiderer, Phys. Rev. Lett. 81, 2606 (1998); J. Baumgartl, M. Brunner, and C. Bechinger, Phys. Rev. Lett. 93, 168301 (2004).
[30]
D.V. Tkachenko, V.R. Misko, and F.M. Peeters, Phys. Rev. E 80, 051401 (2009); P. Henseler, A. Erbe, M. Köppl, P. Leiderer, and P. Nielaba, Phys. Rev. E 81, 041402 (2010).
[31]
J.C.N. Carvalho, W.P. Ferreira, G.A. Farias, and F.M. Peeters, Phys. Rev. B 83, 094109 (2011).
[32]
B. Liu, K. Avinash, and J. Goree, Phys. Rev. Lett. 91, 255003 (2003).
[33]
P. Glasson, V. Dotsenko, P. Fozooni, M.J. Lea, W. Bailey, G. Papageorgiou, S.E. Andresen, and A. Kristensen, Phys. Rev. Lett 87, 176802 (2001); H. Ikegami, H. Akimoto, and K. Kono, Phys. Rev. Lett. 102, 046807 (2009); D.G. Rees, I. Kuroda, C.A. Marrache-Kikuchi, M. Höfer, P. Leiderer, and K. Kono, Phys. Rev. Lett. 106, 026803 (2011).
[34]
J. Baker and A.G. Rojo, J. Phys. Condens. Matter 13, 5313 (2001).
[35]
M. Yamamoto, M. Stopa, Y. Tokura, Y. Hirayama and S. Tarucha, Science 313, 204 (2006); V.M. Deshpande and M. Bockrath, Nature Phys. 4, 314 (2008).
[36]
G. Piacente and F.M. Peeters, Phys. Rev. B 72, 205208 (2005).
[37]
K. Saunders, J.M. Schwarz, M.C. Marchetti, and A.A. Middleton, Phys. Rev. B 70, 024205 (2004).
[38]
C. Bairnsfather, C.J. Olson Reichhardt, and C. Reichhardt, EPL 94, 18001 (2011).
[39]
C. Reichhardt, C. Bairnsfather, and C.J. Olson Reichhardt, Phys. Rev. E 83, 061404 (2011).
[40]
A. van Otterlo, R.T. Scalettar, and G.T. Zimányi, Phys. Rev. Lett. 81, 1497 (1998); C.J. Olson, C. Reichhardt, R.T. Scalettar, G.T. Zimányi, and N. Grønbech-Jensen, Physica C 384, 143 (2003); H. Fangohr, A.E. Koshelev, and M.J.W. Dodgson, Phys. Rev. B 67, 174508 (2003).
[41]
E.R. Nowak, N.E. Israeloff, and A.M. Goldman, Phys. Rev. B 49, 10047 (1994); S. Bhattacharya and M.J. Higgins, Phys. Rev. B 52, 64 (1995); M. Danckwerts, A.R. Goñi, and C. Thomsen, Phys. Rev. B 59, R6624 (1999).
[42]
N. Grønbech-Jensen, A.R. Bishop, and D. Domínguez, Phys. Rev. Lett. 76, 2985 (1996).
[43]
A.A. Middleton, Phys. Rev. Lett. 68, 670 (1992).
[44]
S.S. Banerjee et al., Phys. Rev. B 62, 11838 (2000).
[45]
Y.I. Frenkel and T. Kontorowa, Zh. Eksp. Teor. Fiz. 8, 1340 (1938); P. Bak, Rep. Prog. Phys 45, 587 (1982); S.N. Coppersmith, D.S. Fisher, B.I. Halperin, P.A. Lee, and W.F. Brinkman, Phys. Rev. B 25, 349 (1982).
[46]
M. Baert, V.V. Metlushko, R. Jonckheere, V.V. Moshchalkov, and Y. Bruynseraede, Phys. Rev. Lett. 74, 3269 (1995); C. Reichhardt, C.J. Olson, and F. Nori, Phys. Rev. B 57, 7937 (1998).
[47]
M. Baert, V.V. Metlushko, R. Jonckheere, V.V. Moshchalkov, and Y. Bruynseraede, Europhys. Lett. 29, 157 (1995); C. Reichhardt and N. Grønbech-Jensen, Phys. Rev. B 63, 054510 (2001).
[48]
C.J. Olson, C. Reichhardt, and S. Bhattacharya, Phys. Rev. B 64, 024518 (2001).
[49]
C. Reichhardt and C.J. Olson Reichhardt, Phys. Rev. E 77, 041401 (2008).


File translated from TEX by TTHgold, version 4.00.

Back to Home