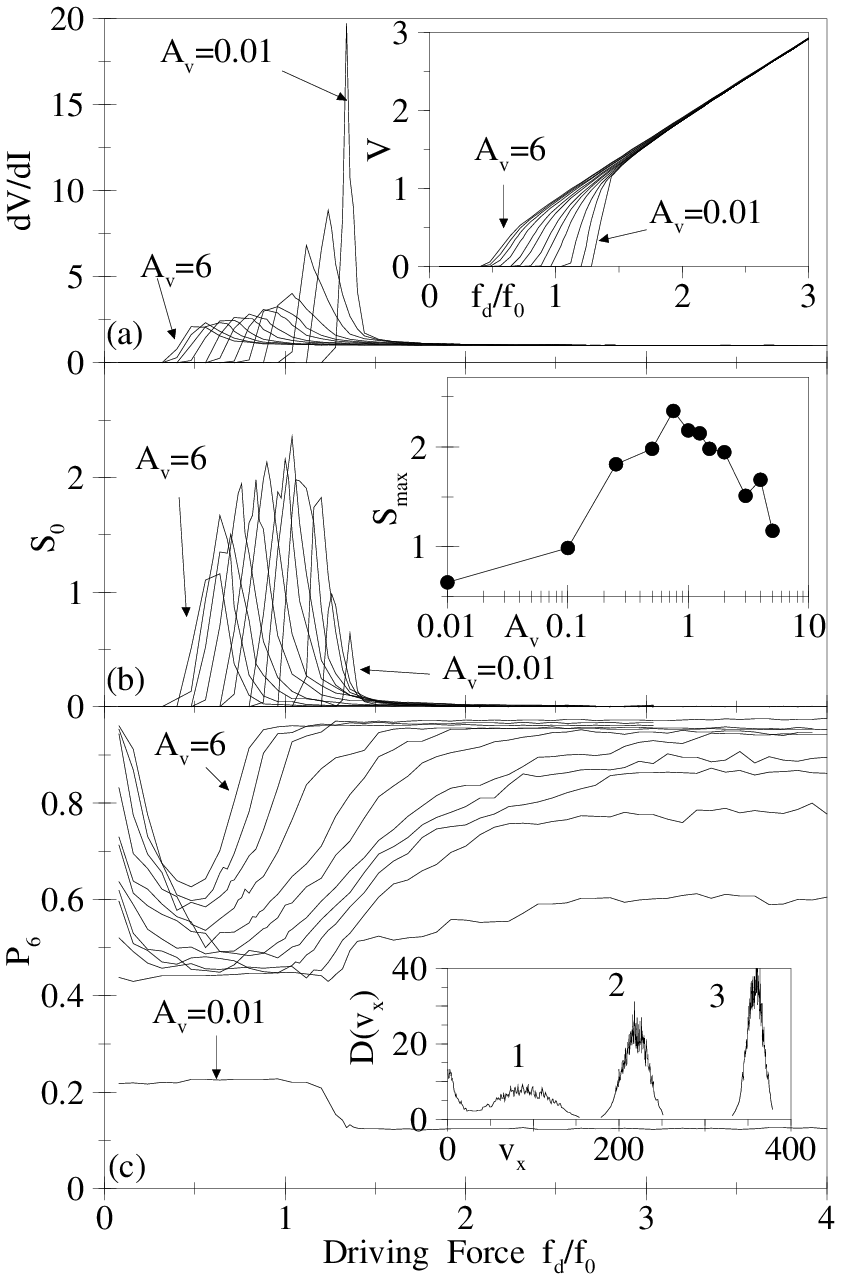
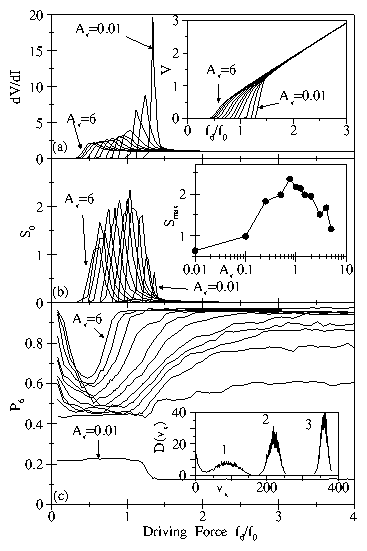
Physical Review Letters 81, 3757 (1998)

Nonequilibrium Dynamic Phase Diagram for Vortex Lattices

C. J. Olson, C. Reichhardt, and Franco Nori
Department of Physics, The University of Michigan, Ann Arbor, Michigan 48109-1120

(Received 23 April 1998)

The new dynamic phase diagram for driven vortices with varying lattice softness we present here indicates that, at high driving currents, at least two distinct dynamic phases of flux flow appear depending on the vortex-vortex interaction strength. When the flux lattice is soft, the vortices flow in independently moving channels with smectic structure. For stiff flux lattices, adjacent channels become locked together, producing crystalline-like order in a coupled channel phase. At the crossover lattice softness between these phases, the system produces a maximum amount of voltage noise. Our results relate spatial order with transport and are in agreement with experiments.
PACS numbers: 74.60.Ge
Nonequilibrium problems involving elastic lattices and disordered media, such as the nature of depinning transitions or the behavior of rapidly driven lattices, appear in a wide variety of systems including superconducting vortex lattices, charge-density waves, and solid-on-solid friction. Much recent interest has been devoted to the motion of a vortex lattice (VL) across a disordered substrate under applied currents both at and well beyond depinning. The reordering of a rapidly-driven VL is supported by simulations [1,2,3,4,5] as well as neutron scattering [6] and decoration experiments [7], but the nature of the order that appears remains a subject of debate. In addition, the relationship of the voltage noise observed near depinning to the microscopic vortex motion at higher currents has not been addressed.
Recent work on the behavior of a VL driven by a large current produced conflicting pictures of the VL order, ranging from a crystalline structure [2] to a moving smectic state [8]. In Ref. [9], the VL does not fully recrystallize, but instead enters a moving Bragg glass state with channels. Moreover, Ref. [8] describes the VL in terms of independently moving channels of vortices with overall smectic order. Other theories also focus on channels of vortices [10]. Smectic structure factors (S(q)) of the VL were observed in simulations of vortices moving over strong pinning [3,4], in agreement with Ref. [8].
Very recent decoration experiments [12] produced both crystalline-like and smectic order of the moving VL, depending on the magnitude of the applied magnetic field. Smectic order appears at low fields, when the vortices interact weakly, and crystalline-like peaks in S(q) appear at high fields, when the vortex interactions are stronger. This suggests that the softness of the VL is important in determining the vortex behavior at high driving currents.
In this paper, we propose a new dynamic phase diagram in which both smectic and crystalline-like order appear as the VL softness is varied. Using simulations of current-driven vortices, we clearly define regions of the phase diagram based on S(q), V(I) curves, voltage noise, velocity distributions, direct observation of the lattice, and defect density calculations. We compute experimentally relevant voltage noise spectra [11] at all currents from depinning to high drives, and find evidence for a washboard frequency in the stiff VL as well as broad-band noise in the plastic flow phase. As the VL softens, we observe a novel crossover to a regime in which smectic order is never destroyed even at high drives. At the crossover, the amount of voltage noise generated by the system during depinning is maximum, indicating that experimental voltage measurements can probe the VL order. Our results are in excellent agreement with experiments, and have implications for noise measurements in the peak effect regime [13].
We model a transverse two-dimensional slice (in the x-y plane) of a T=0 superconducting infinite slab containing rigid vortices that are parallel to the sample edge (H=Hz). The vortex-vortex repulsion is correctly represented by a modified Bessel function, K1(r/λ), where λ is the penetration depth. The vortices are driven through a sample with periodic boundary conditions, filled with randomly placed columnar defects, by a uniform Lorentz force fdx, representing an applied current. The columnar pins are non-overlapping, short-range parabolic wells of radius ξp=0.30λ. The maximum pinning force, fp, of wells has a Gaussian distribution with a mean value of fp = 1.5 f0 and a standard deviation of 0.1 f0, where f0 = Φ02/8π2λ3. The pin density np=1.0/λ2 is higher than the vortex density nv=0.7 Φ02. We concentrate on samples 36λ×36λ in size, containing 864 vortices and 1295 pins. We check for finite size effects using samples that range in size from 18λ×18λ to 72λ×72λ and contain up to 2484 vortices and 3600 pins.
The overdamped equation of vortex motion is fi=fivv+fivp+fdvi  , where the total force fi on vortex i (due to other vortices fivv, pinning sites fivp, and the driving current fd) is given by fi =  ∑j=1Nv Av f0   K1 ( |rirj | /λ) rij+ ∑k=1Np (fpp)  |rirk(p)|   Θ [(ξp − |rirk(p) |)/λ]  rik + fd. Here, Θ is the Heaviside step function, ri (vi) is the location (velocity) of the ith vortex, rk(p) is the location of the kth pinning site, ξp is the pinning site radius, Np (Nv) is the number of pinning sites (vortices), rij=(rirj )/|rirj|, rik=(rirk(p))/|rir(p)|.
Using the monotonic relationship between the shear modulus c66 and the dimensionless prefactor Av of the vortex-vortex interaction term, we model VLs with varying degrees of softness by changing Av over 3.5 orders of magnitude , from Av = 0.001 to Av = 6.0. This is in contrast to previous simulations [3,4,5,14,15] that considered only an extremely soft VL. For each value of Av, we simulate a voltage-current V(I) curve by initially placing the vortices in a perfect lattice. slowly increasing the driving force fd from zero to 3.0f0 and measuring the resulting voltage signal Vx = ∑fx(i)/Nv.
In order to identify the phase boundaries, each time the driving current fd increases by 0.08f0, we halt the increases in fd, check that the voltage signal Vx is stationary over time, and then collect detailed velocity and position information for a long time interval, 2 ×10⁵ molecular dynamics (MD) steps, at a single current. For a 36 λ×36 λ sample containing 864 vortices, each V(I) curve requires 8 ×10⁶ to 107 MD steps to complete, corresponding to about 10 days of CPU time on a SPARC Ultra. At each current, we are able to compute accurate voltage noise spectra S(ω) with a frequency window extending into relatively low frequencies on the order of the vortex time-of-flight across the sample. We also determine the voltage noise power S0 in one frequency octave, S0 = ∫ω0ω1 dωS(ω), where S(ω) = | ∫Vx(t) ei2πωtdt |2. The units of frequency are inverse MD time steps. Here, ω0 = 0.027 and ω1 = 0.054 were chosen to fall in the middle of our frequency window. The results are not affected if nearby values are used. To measure the order in the VL, we use the Delaunay triangulation of the instantaneous vortex positions to determine the fraction of six-fold coordinated vortices, P6, and we compute the structure factor, S(q) = |∑i=1Nv eiq ·ri|2/Nv, of the VL.
Fig1.png
Figure 1: (a): dV/dI curves for vortex-vortex interactions (right to left) Av = 0.01, 0.1, 0.25, 0.5, 0.75, 1, 1.5, 2, 3, 4, 5, 6. The peak in dV/dI increases in magnitude with decreasing Av. Inset to (a): Voltage-current V(I) curves for the Av values listed above. The depinning transition shifts to higher driving currents fd and becomes more abrupt as Av decreases. (b): Voltage noise power S0 versus fd for the Av values listed above. In each case the noise power peaks during the plastic flow regime. Inset to (b): Maximum noise power Smax as a function of Av. The peak value of Smax corresponds to Av ≈ 0.75, the same Av at which the system crosses between smectic and coupled channel behavior at high drives. (c): Fraction of six-fold coordinated vortices P6 as a function of fd for values of Av listed above. At zero drive and strong VL coupling, P6  ∼ 1 since the VL is field-cooled. The lowest value of P6 at each Av corresponds exactly to the peak in dV/dI. The VL eventually reorders to P6  ∼ 1 only when Av ≥ 1. For Av ≤ 0.75, P6 saturates at a value below 1. Inset to (c): Velocity distribution functions D(vx) for (1) plastic, (2) smectic, and (3) coupled channel phases.
The depinning of the VL appears in our simulated V(I) curves, shown in the inset to Fig. 1(a). Since a soft VL is able to deform and take better advantage of the available pinning sites, as Av decreases the depinning transition shifts to higher driving forces fd, from fd=0.48f0 at Av=6.0 to fd=1.36f0 at Av=0.01. The depinning also becomes more abrupt for softer VLs, producing a peak in dV/dI that grows in magnitude with lower Av, as seen in Fig. 1(a). The fact that a soft VL has a higher depinning current agrees well with experiments [12,13].
The VL also produces the greatest voltage noise at currents just above depinning , when the vortices are in a plastic flow regime. As seen in Fig. 1(b), for each value of Av the noise power S0 reaches its peak value Smax at a driving current fd above the current at which the peak in dV/dI occurs. The current fd at which the peak occurs is independent of sample size. The spectra S(ω) near Smax are of the form S(ω)  ∼ 1/ω, as illustrated in Fig. 3(A). As Av decreases and the VL softens, we observe a peak in Smax at Av  ∼ 0.75, shown in the inset to Fig. 1(b). It is important to point out that this result agrees well with experiments conducted in the peak effect regime [13], in which an observed peak in voltage noise power with changing magnetic field is interpreted to occur due to the softening of the VL as the externally applied magnetic field increases.
We quantify changes in the VL structure by calculating the fraction of six-fold coordinated vortices P6, shown in Fig. 1(c), and the structure factor S(q), shown in Fig. 2. The vortices are initially field-cooled, so P6 ≈ 1 at fd = 0. At driving currents below the depinning transition, the VL relaxes into the pinning sites, causing a gradual decrease in P6. The relaxation is most pronounced for soft VLs with low values of Av. A plastic flow state appears just above depinning, producing a liquid-like structure factor S(q), shown in Fig. 2(a). The Delaunay triangulation in Fig. 2(b) reveals the large number of defects in the VL in this regime. As shown in Fig. 1, we find that the peak in dV/dI corresponds exactly to the driving force at which P6 reaches its lowest value. Thus dV/dI can be used to probe the order in the VL.
As seen by the rise of P6 in Fig. 1(c) for Av ≥ 0.1, the VL regains order as the driving force fd is increased and the interactions with pinning sites become less important. In stiff VLs with large values of Av, the defects quickly heal out and P6 returns to a value near 1 for driving forces fd not much larger than the pinning force fp. As Av is lowered and the VL softens, higher and higher drives fd must be applied to bring P6 back to 1. In Fig. 1(c), for Av <~0.75, we see that P6 saturates at a value less than 1, and does not increase further even after applying driving forces fd considerably larger than those shown in the figure (fd  ∼ 6f0). The permanent presence of a significant number of defects represents an important change caused by the VL softness in the behavior of the system at high driving currents.
Fig2.png
Figure 2: Structure factor S(q) (a,c,e) and Delaunay triangulations (b,d,f) of the VL for: (a,b) Av = 1.5, fd = 1.12f0, in the plastic flow regime. S(q) is liquid-like, and the VL is filled with defects (marked with circles). (c,d) Av = 0.5, fd = 3.04f0, in the uncoupled channel regime. S(q) has smectic peaks, and the defects in the VL are oriented transverse to the x-direction driving force. (e,f) Av=4, fd=3.04f0, in the coupled channel regime. S(q) has slightly anisotropic crystalline-like peaks, and the VL contains almost no defects.
Computations of the structure factor S(q), shown in Fig. 2, verify that two different types of VL order appear at high driving currents depending on the lattice softness. When Av is low and the VL is correspondingly soft, the structure factor S(q) [Fig. 2(c)] has a smectic appearance, with well-defined peaks only along the qx = 0 axis. A Delaunay triangulation of the moving VL, shown in Fig. 2(d), reveals that the vortices are flowing in channels oriented in the x-direction (parallel to fd) and approximately regularly spaced in the y-direction. (This is in contrast to the plastic flow regime, in which vortices that remain pinned act as barriers and result in vortex motion transverse to the direction of flow, preventing the formation of longitudinal, straight channels.) Vortices in adjacent channels interact so weakly that each channel is able to move independently of nearby channels. All of the defects remaining in the VL have their Burgers vectors aligned transverse to fd, and each channel passes through at least one defect. Thus the channels can easily slip past each other as the defects glide, resulting in an uncoupled channel phase.
If Av is large and the VL is correspondingly stiff, S(q) has a crystalline-like structure, shown in Fig. 2(e), at high driving currents. The peaks in S(q) are anisotropic, with slightly higher peaks at qx = 0 than at qx ≠ 0. For larger samples, the same behavior is observed in S(q) except the peaks are better resolved. The VL is nearly defect-free, as seen in the Delaunay triangulation of Fig. 2(f). The vortices still move in channels oriented in the direction of drive, but these channels are now locked together by the strong vortex-vortex interactions. Thus, the system is in a coupled channel dynamic state.
Fig3.png
Figure 3: Dynamic phase diagram for different driving currents fd and vortex-vortex interaction strengths Av. At very low drives, the VL is pinned. In the plastic flow phase, we observe peaks in dV/dI (crosses) as well as peaks in the voltage noise power S0 (circles). When Av ≤ 0.75, the VL flows in uncoupled channels for all high driving currents. For larger Av, the VL passes through a transition region (UC) in which the channels progressively couple, until reaching a reordered state at high drives. A: Typical voltage noise spectrum S(ω)  ∼ 1/ω observed near Smax for Av = 0.1. B: Washboard frequency observed in the coupled channel regime for Av = 2. The magnitude of the narrow band signal decreases in samples larger than the 36λ×36λ sample shown here. The letters A,B refer to inset plots; a,c refer to Fig. 2 plots.
We summarize the transitions between different states of the moving VL when Av and fd are varied in the phase diagram shown in Fig. 3. The boundary between the pinned and plastic flow phases reflects the increase in depinning current as Av decreases, noted earlier. The plastic flow regime, identified by its liquid-like S(q) and by its bimodal vortex velocity distribution [inset to Fig. 1(c)], disappears above fd  ∼ fp. For fd > fp, the softness of the VL determines the behavior of the system. When Av <~0.75, the structure factor has a smectic appearance for all drives fd >~fp, corresponding to an uncoupled channel (UC) flow regime. For 1 <~Av <~3, the system enters this same smectic UC state immediately after leaving the plastic flow state. At slightly higher driving currents, however, the defect-filled VL enters a transition regime marked by the appearance of weak peaks in S(q) at qx ≠ 0. These peaks are significantly smaller than the smectic peaks at qx = 0, but are at least twice as large as the background observed in the smectic phase. Throughout the UC transition regime, the channels gradually couple as the number of defects in the VL drops. The unimodal vortex velocity distribution becomes less broad, as in the inset to Fig. 1(c). When Av >~4, the system goes directly into this transition state without ever passing through a truly smectic state. Eventually, for all VLs with Av >~1.0, the system reaches a coupled channel flow phase for large enough values of fd. The boundary of this phase is identified as the current at which P6 reaches a value of 1. At the transition Av  ∼ 0.75 below which the coupled channel phase never appears, the greatest maximum noise power Smax is observed, indicating that the noise power could be used as an experimental probe of this transition. At Av  ∼ 0.75, vortex-vortex and vortex-pin interactions are nearly balanced, allowing the system to sample the largest number of metastable states. The boundaries shown on the phase diagram mark crossover points rather than sharp phase transitions.
In the coupled channel regime, we find a washboard frequency [16] in the voltage noise signal, shown in Fig. 3(B), corresponding to the time required for a vortex to move one lattice constant. The magnitude of this washboard signal decreases when the system size is increased, indicating that the signal appears only when the region of the VL sampled is locked into a single domain. Thus experimentally it would be necessary to probe the voltage over a very small area of a sample to observe a washboard frequency, such as with local Hall probes.
In conclusion, we have obtained a new vortex dynamic phase diagram as a function of lattice softness and driving current. At high driving currents two distinct phases of flux flow appear: in soft lattices, uncoupled channels with a smectic structure, and in stiff lattices, coupled channels with crystalline-like order. A signature of the crossover is observed in the voltage noise, which is largest at the transition between the two phases. In the coupled channel phase, a washboard frequency appears in the voltage noise spectrum for small sample sizes. Our results are in agreement with experiments.
We acknowledge helpful discussions with F. Pardo and S. Bhattacharya, and help from the UM CPC, funded by NSF Grant No. CDA-92-14296. CO was supported by NASA.

References

[1]
F. Nori, Science 271, 1373 (1996); A.-C. Shi and A.J. Berlinsky, Phys. Rev. Lett. 67, 1926 (1991).
[2]
A.E. Koshelev and V.M. Vinokur, Phys. Rev. Lett. 73, 3580 (1994).
[3]
K. Moon et al., Phys. Rev. Lett. 77, 2778 (1996).
[4]
S. Spencer and H.J. Jensen, Phys. Rev. B 55, 8473 (1997); S. Ryu et al. , Phys. Rev. Lett. 77, 5114 (1997).
[5]
M.C. Faleski et al., Phys. Rev. B 54, 12427 (1996); C. Reichhardt et al., Phys. Rev. Lett. 78, 2648 (1997).
[6]
U. Yaron et al. , Nature (London) 376, 753 (1995).
[7]
A. Duarte et al. , Phys. Rev. B 53, 11 336 (1996); F. Pardo et al. , Phys. Rev. Lett. 78, 4633 (1997); M. Marchevsky et al. , ibid. 78, 531 (1997).
[8]
L. Balents et al., Phys. Rev. B 57, 7705 (1998).
[9]
T. Giamarchi and P. Le Doussal, Phys. Rev. Lett. 76, 3408 (1996); Phys. Rev. B 57, 11356 (1998).
[10]
S. Scheidl, V.M. Vinokur, Phys. Rev. E 57, 2574 (1998).
[11]
G. D'Anna et al., Phys. Rev. Lett. 75, 3521 (1995); T. Tsuboi et al., Phys. Rev. Lett. 80, 4550 (1998).
[12]
F. Pardo et al., preprint.
[13]
A.C. Marley et al., Phys. Rev. Lett. 74, 3029 (1995).
[14]
H.J. Jensen et al. , Phys. Rev. B 38, 9235 (1988).
[15]
C.J. Olson et al. , Phys. Rev. Lett. 80, 2197 (1998).
[16]
J.M. Harris et al. , Phys. Rev. Lett. 74, 3684 (1995).


File translated from TEX by TTHgold, version 4.00.
Back to Home