 Figure 4:
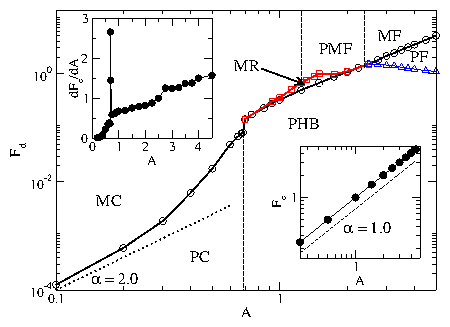
The dynamic phase diagram for Fd vs A with Nc/Ns = 2.0.
Open circles: depinning threshold.
Dotted line: a fit to a power law with α = 2.0.
PC, pinned triangular crystal; PHB, pinned herringbone;
PF, pinned ferromagnetic;
MC, moving triangular crystal; MR, moving random;
MF, moving ferromagnetic; and PMF, partially-ordered moving ferromagnetic.
Upper left inset: dFc/dA vs A for the depinning curve
in the main panel. The sharp peak separates the PC and PHB states.
Lower right inset: Fc vs A for a single isolated particle,
showing a linear scaling.
Figure 4:
The dynamic phase diagram for Fd vs A with Nc/Ns = 2.0.
Open circles: depinning threshold.
Dotted line: a fit to a power law with α = 2.0.
PC, pinned triangular crystal; PHB, pinned herringbone;
PF, pinned ferromagnetic;
MC, moving triangular crystal; MR, moving random;
MF, moving ferromagnetic; and PMF, partially-ordered moving ferromagnetic.
Upper left inset: dFc/dA vs A for the depinning curve
in the main panel. The sharp peak separates the PC and PHB states.
Lower right inset: Fc vs A for a single isolated particle,
showing a linear scaling.
|