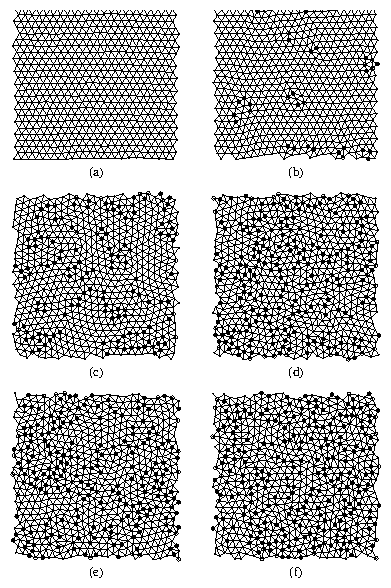
Physical Review B 64, 024518 (2001)

Critical Depinning Force and Vortex Lattice Order in Disordered Superconductors

C. J. Olson and C. Reichhardt

Department of Physics, University of California, Davis, California 95616.

S. Bhattacharya

NEC Research Institute, 4 Independence Way, Princeton, New Jersey 08540.

(Received 9 October 2000; published 21 June 2001)

We simulate the ordering of vortices and its effects on the critical current in superconductors with varied vortex-vortex interaction strength and varied pinning strengths for a two-dimensional system. For strong pinning the vortex lattice is always disordered and the critical depinning force only weakly increases with decreasing vortex-vortex interactions. For weak pinning the vortex lattice is defect free until the vortex-vortex interactions have been reduced to a low value, when defects begin to appear with a simultaneous rapid increase in the critical depinning force. In each case the depinning force shows a maximum for non-interacting vortices. The relative height of the peak increases and the peak width decreases for decreasing pinning strength in agreement with experimental trends associated with the peak effect. We show that scaling relations exist between the distance between defects in the vortex lattice and the critical depinning force.
I. INTRODUCTION
II. SIMULATION
III. VORTEX ORDER AND PINNING FOR VARIED VORTEX-VORTEX INTERACTION STRENGTH
IV. HEIGHT AND WIDTH OF CRITICAL DEPINNING FORCE PEAK
V. CRITICAL DEPINNING FORCE DEPENDENCE ON DEFECT DENSITY
VI. CONCLUSION
References

I.  INTRODUCTION

A large class of condensed matter systems can be represented as an elastic lattice interacting with a quenched random substrate. Vortices in type II superconductors, which can be pinned by random defect sites in the material, are a particularly ideal example of such a system since the substrate and lattice interactions can be readily tuned experimentally. In this case, a rich variety of static [1,2,3,4,5,6] and dynamical phases [2,7,8] can occur due to the competition between the repulsive vortex-vortex interactions, which tend to order the vortex lattice, and the attractive vortex-pin interactions, which tend to disorder the vortex lattice. Unlike the early studies of collective pinning of a defect-free elastic lattice, recent experimental and theoretical work point to the importance of topological defects in pinned vortex matter. If the pinning in the sample is sufficiently strong, the vortex lattice will be highly defected; conversely, in a sample with weak pinning the vortex lattice can be relatively ordered and contain only a few defects. In contrast with the purely elastic model, however, the relationship between the critical force and the density of flux line defects is not known. Moreover, applications of superconducting materials require that the critical current be high, and so a key question is how the number of defects in the vortex lattice can affect the critical current.
In a given sample, i.e., with a given realization of quenched disorder, the relative strength of the pinning can be increased by lowering the vortex-vortex interaction strength, i.e., by softening the lattice. Vortex-vortex interactions become weak at low applied fields, when vortices are dilute, as well as very near Hc2 and Tc, where the induction of the vortices overlap significantly. In the latter regime one encounters the peak effect: a rapid increase in the critical current before it collapses to zero at the superconducting - normal phase boundary. At these two extreme field values, the pinning interaction dominates and the vortex lattice is expected to be highly disordered. Indeed, direct evidence for vortex lattice disordering through the peak effect regime has been observed in neutron scattering measurements [9]. A reentrant disordering has been found in the low field regime where the vortex lattice again softens [4,10]. Bitter decoration experiments have also provided evidence for the disordering of the vortex lattice at low fields [11]. In each of these cases the critical current Jc is high due to the dominance of pinning.
Experiments on superconducting samples with different amounts of pinning have revealed some systematic trends. The peak effect is much sharper and more pronounced in cleaner samples [6,5,12], while in samples with stronger pinning, the width of the peak region increases and the relative valley-to-peak height decreases, although the overall critical current is higher [6,12]. In samples with the strongest pinning, Jc is high through most of the applied field range, and the peak is completely absent. A possible interpretation of this behavior connects vortex lattice defects with high critical currents. A detailed understanding of the observed effects as a possible transition/crossover between regimes with low and high critical currents, i.e., between, say, a Bragg glass-like ordered phase with few defects and a Vortex glass/ pinned liquid-like disordered vortex phase is still lacking. A key reason for this uncertainty is the absence of a systematic connection between the number of defects in the vortex lattice, the softness of the lattice, and the critical current.
In this work, we directly examine the effect of vortex lattice softness on the critical current through a series of numerical simulations of samples with different pinning strengths. For strong pinning the vortex lattice is highly defective for the entire range of vortex-vortex interactions investigated. The critical depinning force, which is proportional to the critical current, only weakly increases with decreasing vortex-vortex interaction strength, reaching a maximum for non-interacting vortices. For the weakest pinning strengths, on the other hand, the lattice is almost defect-free over a large range of vortex-vortex interaction strengths. When defects begin to appear in the softest vortex lattices, the critical depinning force increases sharply from its low value to a peak at zero vortex-vortex interaction. The behavior for intermediate pinning is intermediate between these extremes. We find that the relative height of the critical current peak increases for decreasing pinning while the width of the peak decreases. Thus, the most pronounced peaks occur for the weakest pinning. These results are in agreement with the experimental trends described above. We discuss how these results can be connected to the behavior of the peak effect in superconductors with varying pinning strength.

II.  SIMULATION

We consider a 2D slice of a system of superconducting vortices interacting with a random pinning background. The applied magnetic field H=Hz is perpendicular to our sample, and we use periodic boundary conditions in x and y. The T=0 overdamped equation of motion for a vortex i is
fi = η d ri

dt
= fivv + fivp + fd = ηvi ,
(1)
where vi is the velocity of vortex i and η = 1 is the damping coefficient. The total force on vortex i from the other vortices is fivv = ∑j = 1NvAv  f0K1(|rirj|/λ)rij, where ri is the position of vortex i, λ is the penetration depth, f0 = Φ02/8π2 λ3, the prefactor Av is used to vary the vortex lattice softness, and K1 is the modified Bessel function. The pinning fivp is modeled as randomly placed attractive parabolic wells of radius rp=0.15λ with fivp = (fp/rp)(|rirk(p)|) Θ(rp − |rirk(p)|) rik(p), where rk(p) is the location of pin k, fp is the maximum pinning force, which is varied from 0.1 f0 to 3.0 f0, Θ is the Heavside step function and rik(p) = (rirk(p))/| rirk(p)|. The pin density is np = 3.0/λ2 and the vortex density is nv = 0.75/λ2. We simulate a 36λ×36λ system containing Nv = 864 vortices and Np = 3887 pins. We initialize the vortex positions by performing simulated annealing, starting from a high temperature and slowly cooling to T=0. This method of preparing the lattice is similar to field cooled experiments. To identify the depinning force fc we apply a slowly increasing uniform driving force fd on the vortices in the x direction, which would correspond to a Lorentz force from an applied current J=Jy. We use a time step of dt=0.02 and spend 104 time steps at each current value. For each drive increment we measure the average vortex velocity in the direction of drive, Vx = (1/Nv) ∑1Nvvx. The fd versus Vx curve corresponds experimentally to a V(I) curve. The depinning force fc is defined as the drive at which Vx > 0.03.

III.   VORTEX ORDER AND PINNING FOR VARIED VORTEX-VORTEX INTERACTION STRENGTH

Fig1.png
Figure 1: The Delaunay triangulation of the vortex lattice for decreasing vortex-vortex interaction strength Av in a sample with fp = 0.25f0. Dark circles indicate 5-fold coordinated vortices; open circles indicate 7-fold coordinated vortices. (a) Av = 4.0, (b) 3.0, (c) 2.0, (d) 1.0, (e) 0.75 and (f) 0.50. The vortex lattice is relatively ordered in (a). In (b) more defects appear. (c) and (d) show different domains of vortex orientation. In (e) and (f) the vortex lattice is highly disordered.
We first consider the effect of the vortex lattice softness on the stationary vortex lattice. In Fig. 1 we show the Delaunay triangulation for a system with fp = 0.25f0 for decreasing vortex-vortex interaction Av, after the lattice has been annealed and with no driving force applied. Defect sites in the vortex lattice are indicated by circles. In Fig. 1(a) for Av = 4.0, the vortex lattice contains no defects. In Fig. 1(b) for Av = 3.0 a small number of 5-7 defect pairs appear. In Fig. 1(c), at Av = 2.0 the vortex lattice is considerably disordered but some domains of order are still present. For softer vortex lattices in Fig. 1(d-f), the vortex lattice becomes progressively more disordered by the underlying random pinning. Since the simulation is for a two-dimensional system, we expect the system to be defective for any pinning strength [13]. The defect-free situation likely results from the finite size of the sample.
Fig2.png
Figure 2: (a) The critical depinning force fc versus Av for a sample with fp = 0.25 f0. (b) The fraction of six-fold coordinated vortices P6 versus Av. As the vortex-vortex interaction is lowered fc increases while P6 decreases.
By applying a transport current to the annealed lattices, we determine the critical depinning force fc that must be applied before the vortices begin to move. In Fig. 2(a) we plot fc versus Av for a sample with fp=0.25f0. For comparison, we measure the amount of order in the lattice before depinning using the Delaunay triangulation, and in Fig. 2(b) we plot P6, the fraction of six-fold coordinated vortices, versus Av. Here P6 = 1.0 indicates a perfect triangular lattice. As Av is lowered fc increases and simultaneously the order in the lattice, P6, decreases. The maximum value of fc occurs at Av  ∼ 0 which coincides with the minimum value of P6. Thus the softer lattices with low values of Av and large amounts of disorder are more strongly pinned than stiffer, more ordered lattices.

IV.  HEIGHT AND WIDTH OF CRITICAL DEPINNING FORCE PEAK

Fig3.png
Figure 3: Scaled critical depinning force and P6 versus Av for samples with different pinning strengths. Open circles: fp = 0.10 f0; filled squares: fp = 0.25 f0; open diamonds: fp = 0.75 f0; filled triangles: fp = 1.5 f0; plus signs: fp = 3.0 f0. (a) The plot of fc/fp versus Av shows that the peak at low Av becomes sharper for weakening pinning strength fp. (b) The corresponding P6 values show that for large fp = 3.0 the vortex lattice is disordered over the entire range of Av.
The shape and magnitude of the critical current peak at Av = 0 are affected by the strength of the pinning in the sample. To demonstrate this, in Fig. 3(a) we plot fc/fp versus Av. Scaling the curves with fp in this way causes all of the curves to approach fc/fp = 1 at Av = 0. We find that the relative height of the peak increases as the pinning becomes weaker. For example, comparing fp = 0.25 (bottom curve) with fp = 3.0 (top curve), the critical current fc increases by a factor of 8 from fc = 0.1 at Av = 6.0 to fc = 0.8 at Av = 0.01 in the weakly pinned sample, whereas in the strongly pinned sample, fc increases only by a factor of 2 from fc = 0.38 at Av = 6.0 to fc = 0.8 at Av = 0.01. The peak not only becomes higher for weaker pinning, but also it becomes much narrower as can be seen by comparing the widths of the peaks in Fig. 3(a). As shown in Fig. 3(b), in the strongly pinned samples such as fp = 3.0f0 with broad low peaks, P6 is low over the entire range of Av, indicating that the vortex lattice is always strongly disordered by the pinning. In contrast, for weakly pinned samples such as fp = 0.25f0, P6 drops a large amount from P6 ≈ 1 at large Av, indicating a nearly perfect lattice, to P6 ≈ 0.4 at the lowest Av, indicating a large amount of disorder in the lattice.
Fig4.png
Figure 4: Squares: the relative height H = fc(Av=0.01)/fc(Av=6.0) of the peak in fc for samples with different pinning strength fp. Circles: The width of the peak dW at half-maximum as a function of fp. The peak becomes sharper and more pronounced for weaker pinning.
In Fig. 4 we show explicitly how the relative peak height, H = fc(Av = 0.01)/fc(Av = 6.0), and the width at half maximum, dW, vary with pinning strength fp. Here we see that the relative strength and sharpness of the peak increase with weaker pinning. The width dW depends linearly on fp, while the relative height H shows a nonlinear increase that can not be fitted by a simple functional form.
The results in Fig. 3 and Fig. 4 suggest that in clean superconductors, where the vortex lattice softness has a much more significant impact on the effectiveness of the pinning, the critical current enhancements should be both sharper and of larger relative height than in strongly pinned superconductors. This behavior agrees with the results of recent experiments [5,6] on the peak effect. Our results also suggest that the peak can be made arbitrarily sharp simply by adjusting the disorder strength, and that such large peaks in the critical current must be accompanied by the proliferation of defects.

V.  CRITICAL DEPINNING FORCE DEPENDENCE ON DEFECT DENSITY

Fig5.png
Figure 5: (a) Scaled critical depinning force fc/fp versus P6. (b) fc/fp versus the distance between defects dd showing a collapse for dd < 3.0 coinciding with a rapid increase in fc.
Using the data obtained by varying Av, we can determine the relationship between the critical current and the density of defects. In Fig. 5(a) we plot fc/fp versus P6, showing that the curves for samples with different pinning strengths roughly collapse. At lower values of P6 when the vortex lattice becomes defected, the critical current increases rapidly with the onset of defects. In Fig. 5(b) we plot fc/fp versus the distance between vortex lattice defects, dd = 1/√{1.0 − P6}. In samples with weak pinning there is a range of high Av values that produce well ordered vortex lattices. In this regime, when there are very few defects in the vortex lattice which are far apart, we find that the fc/fp values do not collapse, and that the rate at which fc/fp changes with dd is slow. For dd < 3.0, or when the lattice contains approximately 10% or more defects, all the curves collapse and fc/fp increases rapidly with decreasing dd. The behavior of fc versus dd suggests that there is a critical distance between defects below which Jc begins to rapidly increase.
Fig6.png
Figure 6: (a) Shaded symbols: fc/fp as predicted by LO theory. (b) Filled symbols: fc/fp computed from the distance between dislocations. (c) Open symbols: fc/fp measured in the simulations. (d) All three methods of obtaining fc are scaled by the value at Av = 0.01, and plotted together. For all panels, circles: fp = 0.10 f0; squares: fp = 0.25 f0; diamonds: fp = 0.75 f0; triangle up: fp = 1.5 f0; triangle left: fp = 3.0 f0.
We can compare the dependence of the critical depinning force on the defect density with the collective pinning results of the Larkin-Ovchinnikov (LO) theory [14]. In Fig. 6(a) we plot fc as predicted by LO, using fcfp2 / Av. Fig. 6(b) shows fc computed from the distance between dislocations, using fcfp/dd. The value of fc measured in the simulations is shown in Fig. 6(c). We compare fc obtained by the LO and dislocation distance methods with the actual fc in Fig. 6(d). The agreement with the LO prediction is poor, but that with the dislocation distance is good out to values Av/fp  ∼ 5, beyond which dd becomes of order the system size.

VI.  CONCLUSION

We have investigated the dependence of the critical depinning force fc and vortex lattice topological order P6 on the vortex lattice rigidity for different values of pinning strength. The study is restricted to the two dimensional case which is appropriate for vortex lattices where the longitudinal correlation length is large enough to be effectively given by the sample thickness. In all cases, fc increases with decreasing vortex-vortex interaction strength, reaching a maximum for non-interacting vortices, as expected. Although for very weak pinning and strong vortex-vortex interaction, the lattice is relatively defect-free, for strong pinning the lattice is defective for the entire vortex interaction range investigated. These results are in accord with previous studies. We have, in addition, studied the systematic variation of fc with varying pinning and inter-vortex interaction. The results show that the pinning force variation departs significantly from the expectations of an elastic picture. The increase in fc towards the maximum occurs very rapidly with decreasing interaction or increasing pinning. The relative height increases while the width decreases with decreasing pinning strength, strongly remniscent of the peak effect phenomenon. Furthermore, a pseudo-Larkin picture where a plastic length, the distance between topological defects, replaces the elastic correlation length, provides a good account of the variation of fc. We also find evidence that there is a critical value of the plastic length, typically spanning 3-5 vortices on each side, at which the rapid crossover occurs. These results should be relevant to experiments in very weak pinning (quasi-2D) flux lattices, as well as to the general systems of two-dimensional lattices with quenched disorder where the lattice interaction can be tuned.
We thank P. LeDoussal, T. Giamarchi, M. Higgins, P. Kes, M. Marchevsky, and V. Vinokur for helpful discussions. This work was supported by CLC and CULAR (LANL/UC) and by NSF-DMR-9985978.

References

[1]
G. Blatter, M.V. Feigel'man, V.B. Geshkenbein, A.I. Larkin, and V.M. Vinokur, Rev. Mod. Phys. 60, 1125 (1994).
[2]
S. Bhattacharya and M.J. Higgins, Phys. Rev. Lett. 70, 2617 (1993); M.J. Higgins and S. Bhattacharya, Physica C 257, 232 (1996).
[3]
G. Ravikumar, V.C. Sahni, P.K. Mishra, T.V. Chandrasekhar Rao, S.S. Banerjee, A.K. Grover, S. Ramakrishnan, S. Bhattacharya, M.J. Higgins, E. Yamamoto, Y. Haga, M. Hedo, Y. Inada, and Y. Onuki, Phys. Rev. B 57, R11069 (1998); S.S. Banerjee, N.G. Patil, S. Ramakrishnan, A.K. Grover, S. Bhattacharya, P.K. Mishra, G. Ravikumar, T.V. Chandrasekhar Rao, V.C. Sahni, M.J. Higgins, C.V. Tomy, G. Balakrishnan, and D. Mck. Paul, Phys. Rev. B 59, 6043 (1999); S. Sarkar, D. Pal, S.S. Banerjee, S. Ramakrishnan, A.K. Grover, C.V. Tomy, G. Ravikumar, P.K. Mishra, V.C. Sahni, G. Balakrishnan, D. McK. Paul, and S. Bhattacharya, Phys. Rev. B 61, 12394 (2000); G. Ravikumar, P.K. Mishra, V.C. Sahni, S.S. Banerjee, A.K. Grover, S. Ramakrishnan, P.L. Gammel, D.J. Bishop, E. Bucher, M.J. Higgins, and S. Bhattacharya, Phys. Rev. B 61, 12490 (2000).
[4]
K. Ghosh, S. Ramakrishnan, A.K. Grover, G.I. Menon, G. Chandra, T.V. Chandrasekhar Rao, G. Ravikumar, P.K. Mishra, V.C. Sahni, C.V. Tomy, G. Balakrishnan, D. McK. Paul, and S. Bhattacharya, Phys. Rev. Lett. 76, 4600 (1996).
[5]
J. Shi, X.S. Ling, R. Liang, D.A. Bonn, and W.N. Hardy, Phys. Rev. B 60, R12593 (1999).
[6]
S. Banerjee et al., to be published.
[7]
H.J. Jensen, A. Brass and A.J. Berlinsky, Phys. Rev. Lett. 60, 1676 (1988); A.-Ch. Shi and A.J. Berlinsky, Phys. Rev. Lett. 67, 1926 (1991); A.E. Koshelev and V.M. Vinokur, Phys. Rev. Lett. 73, 3580 (1994); N. Grønbech-Jensen, A.R. Bishop, and D. Dominguez, Phys. Rev. Lett. 76, 2985 (1996); K. Moon, R.T. Scalettar and G.T. Zimányi, Phys. Rev. Lett. 77, 2278 (1996); S. Ryu, M. Hellerqvist, S. Doniach, A. Kapitulnik, and D. Stroud, Phys. Rev. Lett. 77, 5114 (1996); M.C. Faleski, M.C. Marchetti, and A.A. Middelton, Phys. Rev. B 54, 12477 (1996); S. Spencer and H.J. Jensen, Phys. Rev. B 55, 8473 (1997); C.J. Olson, C. Reichhardt and F. Nori, Phys. Rev. Lett. 81, 3757 (1998); A.B. Kolton and D. Dominguez, Phys. Rev. Lett. 82, 181 (1999).
[8]
M.C. Hellerqvist, D. Ephron, W.R. White, M.R. Beasley, and A. Kapitulnik, Phys. Rev. Lett. 76, 4022 (1996); W. Henderson, E.Y. Andrei, M.J. Higgins, and S. Bhattacharya, Phys. Rev. Lett. 77, 2077 (1996).
[9]
P.L. Gammel, U. Yaron, A.P. Ramirez, D.J. Bishop, A.M. Chang, R. Ruel, L.N. Pfeiffer, E. Bucher, G. D'Anna, D.A. Huse, K. Mortensen, M.R. Eskildsen, and P.H. Kes, Phys. Rev. Lett. 80, 833 (1998).
[10]
Y. Paltiel, E. Zeldov, Y. Myasoedov, M.L. Rappaport, G. Jung, S. Bhattacharya, M.J. Higgins, Z.L. Xiao, E.Y. Andrei, P.L. Gammel, and D.J. Bishop, Phys. Rev. Lett. 85, 3712 (2000).
[11]
D.G. Grier, C.A. Murray, C.A. Bolle, P.L. Gammel, D.J. Bishop, D.B. Mitzi, and A. Kapitulnik, Phys. Rev. Lett. 66, 2270 (1991).
[12]
S. Kokkaliaris, A.A. Zhukov, P.A.J. de Groot, R. Gagnon, L. Taillefer, and T. Wolf, Physica C 332, 393 (2000).
[13]
C. Zeng, P.L. Leath, and D.S. Fisher, Phys. Rev. Lett. 82, 1935 (1999).
[14]
A.I. Larkin and Yu.N. Ovchinnikov, J. Low Temp. Phys. 34, 409 (1979).


File translated from TEX by TTHgold, version 4.00.

Back to Home