Physical Review Letters 78, 2648 (1997)

Dynamic Phases of Vortices in Superconductors with Periodic Pinning

C. Reichhardt, C. J. Olson, and Franco Nori
Department of Physics, The University of Michigan, Ann Arbor, Michigan 48109-1120

(Received 23 December 1996)

We present results from extensive simulations of driven vortex lattices interacting with periodic arrays of pinning sites. Changing an applied driving force produces a rich variety of novel dynamical plastic flow phases which are very distinct from those observed in systems with random pinning arrays. Signatures of the transition between these different dynamical phases include sudden jumps in the current-voltage curves as well as marked changes in the vortex trajectories and vortex lattice order. Several dynamical phase diagrams are obtained as a function of commensurability, pinning strength, and spatial order of the pinning sites.
PACS numbers: 74.60.Ge, 74.60.Jg
The dynamics of driven vortex lattices interacting with quenched disorder have recently attracted considerable attention. Both theoretical [1,2,3,4,5] and experimental [6] studies have suggested the exciting possibility that these systems exhibit novel dynamic phase transitions between different flow regimes as a function of driving force. In samples with random pinning, evidence for a transition from a plastic flow phase to a strongly driven ordered homogeneous phase has produced current debate over whether the strongly driven phase forms a moving crystal[2] or moving ordered glass [3,4]. The dynamic phases may also be relevant to many other systems, such as Josephson junction arrays, charge-density waves, and electron crystals. Although much work has been done on dynamic phases in systems with random disorder, the case of periodic pinning has not been addressed. We show that driven vortex lattices interacting with periodic pinning exhibit a number of novel plastic flow phases which are not observed in random pinning arrays. Further, the onset of these different phases produces microscopic features in the vortex structure and flow patterns and gives rise to very pronounced features in macroscopically measurable current-voltage curves.
General interest in periodic arrays of pinning sites has increased now that it is possible to construct samples with well defined periodic pinning structures in which the microscopic pinning parameters, such as size, depth, periodicity, and density, can be carefully controlled [7,8,9]. Interesting commensurability effects are observed both in magnetization measurements [7] and with direct imaging [8]. Periodic pinning arrays are also of technological importance since they can produce higher critical currents than an equal number of randomly placed pins [9].
When the pinning radius is much smaller than the lattice spacing, the "disorder" in the system can be fine tuned by changing the commensurability. At B/Bϕ = 1, where Bϕ is the field at which the number of vortices Nv equals the number of pinning sites Np, the vortex lattice locks into a periodic pinning array [7,8,9] and the pinning force is maximized. For B/Bϕ > 1, the vortex lattice contains two species of vortices: the pinned vortices that are commensurate with the pinning array, and the generally more weakly pinned interstitial vortices that are caged by vortices at the pinning sites. When B/Bϕ < 1, the vortex lattice contains a well defined number of vacancies which have their own dynamical behavior.
In order to study the two-dimensional (2D) dynamics of rigid flux lines driven over periodic arrays of pinning sites, we have performed a large number of T = 0, current-driven molecular dynamics (MD) simulations. Unlike previous current-driven simulations [1,2,4,5], we examine the effects of periodic pinning arrays rather than random arrays, and cover a much larger range of the microscopic pinning and system parameters, allowing us to construct a series of detailed dynamical phase diagrams.
We numerically integrate the overdamped equations of motion[10]: fi = fivv + fivp + fd = ηvi. Here fi is the total force acting on vortex i and we take η = 1. The force from the other vortices is fivv =  ∑j=1Nv  f0 K1(|rirj| / λ)  rij , where K1(r/λ) is a modified Bessel function, λ is the penetration depth, and rij = (rirj)/|rirj|. A cut off is placed on K1(r/λ) after it reaches an extremely small value at r = 6λ. The pinning force is fivp =  ∑k=1Np(fp/rp)|rirk(p)| Θ( (rp − |rirk(p)|)/λ) rik(p). Here, Θ is the step function, rk(p) is the location of pinning site k, fp is the maximum pinning force, and rik(p) = (rirk(p))/|rirk(p)| . The Lorentz force is modeled as a uniform force fd. All lengths, fields and forces are given in units of λ, Φ02, and f0 = Φ02/8π2λ3, respectively.
We focus on experimentally accessible parameters that are close to those used in recent experiments [7]. Fixing the sample size at 36λ×36λ, with periodic boundary conditions, and the pinning radius at rp = 0.3λ, we examine an 18×18 square pinning array with Np = 324, giving a pinning density of np = 0.25/λ2. We slowly increase the driving force fd along the horizontal symmetry axis (x-axis) of the pinning lattice and compute the average velocity in the x-direction, Vx = (1/Nv)∑i=1Nvvi·x. This quantity is proportional to a macroscopically measured voltage-current V(I) curve. In order to separate the different effects that each of the pinning and system parameters have on the vortex dynamics, we fix all the parameters and vary only one at a time.
Fig1.png
Figure 1: Average vortex velocity Vx versus driving force fd, for B/Bϕ = 1.062, fp = 0.625f0, rp = 0.3λ, and Bϕ = 0.25Φ02, with the pinning sites located in a square array; fd is increased from 0 to 0.8f0. Several remarkable jumps in the curve can be clearly seen which correspond to transitions in the dynamical behavior of the driven lattice. To better identify the phases we have numbered them I-IV. The inset shows the hysteresis curve as fd is increased to 0.7f0 and then decreased (phases now shown with unbold Roman numerals) to zero. Some phase boundaries, II-III and III-IV, show hysteresis while others do not.
In Fig. 1 we present a typical V(I) curve for B > Bϕ as the driving force is linearly increased from 0 to 0.8f0 with fp = 0.625f0, Bϕ = 0.25Φ02, and B/Bϕ = 1.062. The V(I) curve exhibits several remarkable features which clearly appear as discontinuous jumps and drops in Vx. We label each of the features as regions I through V, and approximate the fraction of flux lines which are mobile at a specific driving force with: σ = Vx/fd. As fd is increased in region I, Vx is zero, indicating that the vortex lattice is pinned. At fd = 0.146f0, the onset of region II is marked by a finite Vx, caused by the depinning of interstitial vortices. Here, σ = 0.06, confirming that only the interstitial vortices are mobile since the percentage of vortices above Bϕ is also (BBϕ)/Bϕ = 0.06. Region III begins at fd = 0.406f0, where a very sharp jump up in Vx is seen, along with an increase in the number of mobile vortices to σ = 0.44. The velocity fluctuations δVx are also much larger. At fd = 0.462f0, region IV appears with a sudden drop in Vx, with σ = 0.23 and a reduction in δVx. Finally, at fd = 0.612f0, just under the pinning force of each pinning site ( fp = 0.625f0), the entire lattice becomes mobile with σ = 1, and the system enters region V.
To further characterize the dynamic phases, we have performed a number of hysteresis runs where the driving force is slowly increased and then decreased. In the inset of Fig. 1 we show a typical curve for the system with the same parameters as in Fig. 1. There is little hysteresis for the transition IV-V. However, there is a very strong hysteresis at the transitions II-III and III-IV that persists in larger system sizes and also for low values of the spatial disorder. The hysteresis and the sharp jumps suggest that the II-III and III-IV phase boundaries might be first order. Details will be presented elsewhere [11].
Fig2.png
Figure 2: Trajectories of the east-bound flowing vortices, for the voltage-current curve in Fig. 1, for regions: II, interstitial flow (a); III, disordered flow (b); IV, incommensurate 1D flow (c); and V, moving (in)commensurate rows (d). The vortices are represented by black dots and pinning sites by open circles. For clarity, only a 20λ×20λ subset of the 36λ×36λ sample is shown.
We use a series of snapshots of the vortex position and vortex flow paths for regions II through V to show explicitly that the features in the V(I) curve correspond to different plastic flow phases. Figure 2(a) shows the vortex trajectories in region II of the current-voltage curve from Fig. 1. It is clear that in region II only the interstitial vortices are mobile while the commensurate vortices remain pinned. The motion is confined to 1D channels between the rows of pinning sites due to the square symmetry imposed by the pinned vortices. Such flow behavior for vortices in square pinning arrays has recently been experimentally observed [8].
Figure 2(b) illustrates that the vortex trajectories differ greatly from region III to II. The vortex lattice is now disordered, and the flow is no longer 1D but consists of channels that wind in both the x and y directions. Pin-to-pin motion also appears. Unlike the motion in region II, where only the interstitial vortices move and vortices at the pinning sites remain pinned, all the vortices in region III take part in the motion, with any one vortex moving for a time and then being temporarily trapped [12].
Another significant change in the vortex motion appears when the system enters region IV, as seen in Fig. 2(c). The vortex trajectories become more ordered and return to an exclusively 1D flow, with the mobile vortices moving along the pinning rows rather than between the rows as in region II. Only certain rows are mobile, and in these rows the additional vortices above Bϕ leave their positions between the pinning rows to create moving incommensurate 1D structures along the pinning row. An entire row does not move continuously, but instead a pulse appears in which only four vortices, near the incommensurate segment of the vortex row, are mobile. As this pulse or discommensuration moves across the sample, each vortex in the row is displaced by a single pinning lattice constant a. This disturbance is thus crossing the sample much more rapidly than the vortices themselves.
The vortex trajectories for region V, in which the entire lattice is moving, are shown in Fig. 2(d). Some portions of the vortex lattice have a distorted triangular order, although the incommensurabilities from region IV are still present. The flow remains strictly 1D and along the pinning rows as in region IV, except that now all the rows are mobile. Rows with an incommensurate number of vortices move faster than the commensurate rows. As fd is increased further, the density of incommensurabilities and the vortex lattice structure do not change, so the system is always undergoing plastic flow and a moving crystal is not formed.
The onset of these different phases is described with force balance arguments that take into account the coupling of the two different species of vortices, interstitial and (pinned) commensurate. In region II, while the commensurate vortices remain pinned, the interstitial vortices begin flowing at a well defined driving force and exert a force fcic on the pinned commensurate vortices. The total force on a commensurate vortex thus consists of the driving force fd, pinning force fp, and forces fcc from commensurate and fcic interstitial vortices. The commensurate vortex will remain pinned as long the following inequality holds:
|fp| > | fd + fcic + fcc|  .
(1)
Since here we are using a square pinning lattice, from symmetry we have fcc = 0. If there are no incommensurate vortices, fcic = 0, and commensurate vortices depin at |fd| = |fp|. When interstitial vortices are present, the term fcic causes commensurate vortices to depin before | fd| = |fp|. These vortices depin more vortices so that the number of mobile vortices increases and region III appears. As long as | fd| < |fp|, not all the vortices will be mobile so that σ < 1. For the parameters used in Fig. 1, the density of interstitial vortices is sufficiently low that they do not interact significantly with each other. In this case, we can solve Eq. (1) for the transition from region II to region III to give

fp =
fd2 + f02K12
a + rp


1/2

 
 .
(2)
With the parameters for the onset of region III, Eq. (2) gives fp = 0.621f0, which is in very good agreement with the value of fp = 0.625f0 used in the simulation.
The appearance of 1D motion exactly along the rows of pins in region IV might seem counterintuitive since for B/Bϕ > 1 and fd = 0 , when the vortices are not moving, an incommensurate vortex located along a pinning row is unstable to perturbations in the y-direction and will fall into the interstitial area between rows. For moving vortices, the situation is quite different since the vortices spend part of their time in the pinning sites. The pinning sites create a stabilizing force against perturbations in the transverse direction, confining the motion along the pinning rows. When the density of interstitial vortices is low, the onset of region IV occurs when the driving force is strong enough that interstitial vortices can depin commensurate vortices from a distance a/2 in the longitudinal direction. This distance, and especially the repulsion from the remaining pinned vortices, allow the interstitial vortex to move towards the just-vacated pin site. For sufficiently strong fd, it will remain moving along the pinned rows [11]. The transition from region III to region IV should occur at
fp =

fd + f0

√2
K1(r1)
2

 
+ f02

2
K12(r1)
1/2

 
 ,
(3)
where r1 = (a/√2 + rp)/λ. With the parameters used in Fig. 1 at the onset of the 1D incommensurate flow, Eq. (3) gives fp = 0.624f0, which is in very good agreement with the numerical value for fp shown in Fig. 1.
Fig3.png
Figure 3: Dynamic phase diagrams with a square pinning lattice. Here, B/Bϕ = 1.062, Bϕ = 0.25Φ02, rp = 0.3λ, and fp = 0.625f0, unless otherwise noted. 
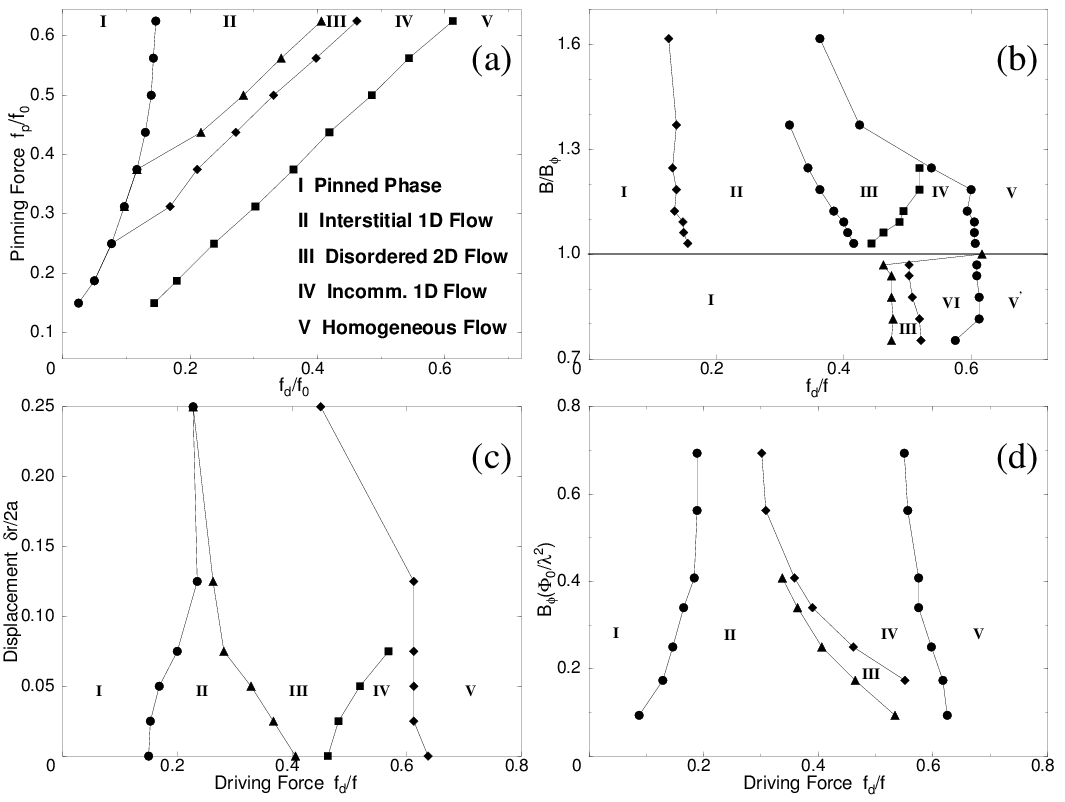
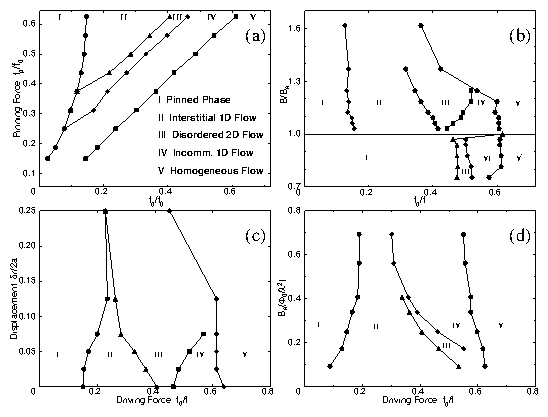
(a) Pinning force fp versus driving force fd. As fd is increased, the phase boundaries II-III, III-IV, and IV-V become linear. (b) B/Bϕ versus fd. For B/Bϕ > 1, regions I through V can be observed, with the disordered region III growing and the ordered-flow regions II and IV reducing in size. A similar situation occurs in (c) for gradually increasing the amount of disorder in the location of the pins. (d) Dynamic phase diagram for Bϕ versus fd.
To better characterize the flow behavior, we systematically vary fp with the rest of the parameters fixed. The resulting phase diagram in Fig. 3(a) outlines the onset of the different dynamical phases. As fp is increased, region I saturates at a value of fd ≈ 0.146f0. This occurs because, although the pinning force fp of the pinning sites is being increased, the vortex-vortex interactions which determine the interstitial pinning force are not changed. Region II only occurs when fp > 0.37f0, since for fp < 0.37f0, Eq. (2) cannot be satisfied even for very low fd, and as soon as the interstitial vortices move they start to depin commensurate vortices. The same argument applies for the onset of region IV, which extends to even lower fp values. The II-III phase boundary follows Eq. (2), which for high fd goes as fpfd, in agreement with the phase diagram. Similarly, the III-IV boundary follows Eq. (3), which is also linear for large fd. The onset of region V also goes as fpfd.
Next we vary the commensurability, from B/Bϕ = 0.75 to 1.7, producing the phase diagram in Fig. 3(b). Just above B/Bϕ = 1, the five phases of Fig. 1 are present. As B/Bϕ is increased, the disordered-flow region III grows while the ordered-flow regions II and IV shrink. This is expected since an increase in B/Bϕ effectively introduces more disorder via the addition of more interstitial vortices. For B/Bϕ > 1.3 , the flow becomes more disordered, the II-III phase boundary becomes ill-defined, and the flow in region V is no longer composed of 1D incommensurate flow along the pinning rows but has a number of vortices flowing between the pinning rows. At B/Bϕ = 1, the commensurate case, we find only two phases: pinned and flowing, with the onset of flow occurring at fdfp. The vortex flow for the commensurate case is elastic since, unlike the case for B/Bϕ > 1, there are no discommensurations that cause certain rows to move faster. For B/Bϕ < 1, where a number of vacancies appear in the vortex lattice, we observe a new vacancy flow phase, marked region VI. The depining force for the onset of vacancy motion is considerably higher than that for the onset of interstitial motion, in agreement with experiments [8]. Flow in V' is like in V, but now the faster-moving rows have vacancies.
Figure 3(c) shows a phase diagram in which the positions of the pinning sites are gradually disordered by randomly displacing them up to an amount δr from the ordered pinning lattice position. In terms of the pinning lattice constant a, we consider the case δr = a/2 to be a good approximation to a random pinning array. The disordered region III grows and dominates the phase diagram for disorder greater then δr = a/6, so that only three phases occur, in agreement with other simulations of random pinning arrays [2,4,5].
Figure 3(d) shows the phase diagram for increasing both vortex nv and pin np density, determined by Bϕ. Here, the ordered-flow phase IV grows while the disordered flow region III shrinks. Increasing Bϕ, increases nv and thus effectively decreases fp. As seen in Fig. 3(a), this suppresses II and III, while favoring IV. Phase diagrams for varying pinning radius rp, angle of drive, temperature, and triangular pinning arrays will be presented and discussed in detail elsewhere [11].
In conclusion, we have demonstrated several novel dynamical phases which are very distinct from those found in random pinning arrays. These phases are marked by pronounced changes in the V(I) curves and noise fluctuations which should be very accessible experimentally. We have directly related these features to the pronounced changes in the vortex lattice structure and flow pattern. These phases result from the coupling between two species of vortices. We have shown that certain phases show strong hysteresis while others do not. The dependence of these phases on various pinning and system parameters has been extensively studied and summarized in a series of phase diagrams [11]. We hope that these results encourage the experimental search of these new dynamic phases.
Computing services were provided by the University of Michigan Center for Parallel Computing, partially funded by NSF grant CDA-92-14296.

References

[1]
H.J. Jensen, Y. Brechet, and A. Brass, J. Low Temp. Phys. 74, 293 (1989); A.-C. Shi and A.J. Berlinsky, Phys. Rev. Lett. 67, 1926 (1991).
[2]
A.E. Koshelev and V.M. Vinokur, Phys. Rev. Lett. 73, 3580 (1994).
[3]
T. Giamarchi and P. Le Doussal, Phys. Rev. Lett. 76, 3408 (1996).
[4]
K. Moon, R.T. Scalettar and G.T. Zimányi, Phys. Rev. Lett. 77, 2778 (1996); S. Ryu et al., ibid 5115 (1996).
[5]
N. Gronbech-Jensen, A.R. Bishop, and D. Dominguez, Phys. Rev. Lett. 76, 2985 (1996); M.C. Faleski, M.C. Marchetti and A.A. Middleton, Phys. Rev. B 54, 12427 (1996).
[6]
U. Yaron et al., Nature 376, 753 (1995); A.C. Marley, M.J. Higgins and S. Bhattacharya, Phys. Rev. Lett. 74, 3029 (1995); M.C. Hellerqvist et al., ibid76, 4022 (1996).
[7]
M. Baert et al., Phys. Rev. Lett. 74, 3269 (1995); E. Rosseel et al., Phys. Rev. B 53, R2983 (1996); V.V. Moshchalkov et al., ibid 7385 (1996); J.Y. Lin et al., ibid, R12714 (1996).
[8]
K. Harada et al., Science 274, 1167 (1996).
[9]
C. Reichhardt, et al., Phys. Rev. B 53, R8898 (1996); ibid, 54, 16108 (1996).
[10]
G. Blatter, et al., Rev. Mod. Phys. 66, 1125 (1994).
[11]
C. Reichhardt, C.J. Olson, F. Nori, unpublished. In [12].
[12]
Videos illustrating the different dynamical phases described here are available at: http://www-personal.engin.umich.edu/~nori


File translated from TEX by TTHgold, version 4.00.
Back to Home