Physical Review Letters 103, 168301 (2009)

Random Organization and Plastic Depinning

C. Reichhardt and C. J. Olson Reichhardt
Theoretical Division, Los Alamos National Laboratory, Los Alamos, New Mexico 87545

(Received 17 December 2008; published 14 October 2009)

We provide evidence that the general phenomenon of plastic depinning can be described as an absorbing phase transition, and shows the same features as the random organization which was recently studied in periodically driven particle systems [L. Corte et al., Nature Phys. 4, 420 (2008)]. In the plastic flow system, the pinned regime corresponds to the absorbing state and the moving state corresponds to the fluctuating state. When an external force is suddenly applied, the system eventually organizes into one of these two states with a time scale that diverges as a power law at a nonequilibrium transition. We propose a simple experiment to test for this transition in systems with random disorder.

DOI: 10.1103/PhysRevLett.103.168301
PACS numbers: 82.70.Dd, 64.60.Ht, 83.50.-v


In plastic depinning in two-dimensional (2D) systems with random disorder, which appears in a wide range of different systems, particle motion occurs in the form of intricate fluctuating channels in which some particles are mobile while others remain pinned [1,2]. This depinning process has been studied extensively over the years in many systems, including vortices in type-II superconductors [1,2,3,4], vortex motion in Josephson-junction arrays [5], plastic depinning in electron crystals on random landscapes [6], charge transport in disordered metallic dot arrays [7], and fluid flow on a rough substrate [8,9]. Other systems which exhibit similar behavior include the unjamming and depinning of dislocations [10,11] and the motion of magnetic domain walls [12]. Complex plastic flow patterns were observed directly at the depinning transition in recent simulations and experiments on a model system of colloids interacting with random pinning [13,14]. Evidence that plastic depinning is a nonequilibrium phase transition includes the fact that the velocity force curves scale as v ∝ (FFc)β, where Fc is the depinning threshold. Many simulations of filamentary plastic flow find β ≥ 1.5 [5,7,9,13,14], but this exponent has not been explained theoretically. The true nature of the pinned to plastic flow transition is still not fully understood despite the ubiquity of the phenomenon.
The pinned to plastic flow transition can be characterized as a transition from a nonfluctuating (pinned) state to a to fluctuating (plastic flow) state. The same type of transition from a nonfluctuating to a fluctuating state was recently examined by Corte et al. in a system of sheared colloids, which exhibits a diffusive liquid behavior rather than plastic flow in the fluctuating state [15]. A novel protocol was used to show that there is a nonequilibrium continuous phase transition between the fluctuating and nonflutuating states. The system was suddenly subjected to a shear and the amount of time required for the system to organize into either the fluctuating or nonfluctuating state diverged as a power law at the transition. Since the system is always spatially disordered or random, Corte et al. termed the transition "random organization." By using the same type of protocol, here we show that plastic depinning exhibits exactly the same critical behaviour found in the shearing work, strongly suggesting that the transitions in the two systems fall into the same universality class.
In Ref. [15], Corte et al. performed a 2D colloidal shearing simulation and suddenly applied a periodic shearing force to a collection of colloids with short range interactions. The colloids experience a random force when they collide. The system always starts in a fluctuating state where the colloids are diffusing, and organizes into either a fluctuating or nonfluctuating state after a transient time τ. This transient time diverges as a power law at a well defined shearing threshold. The experiments of Ref. [15] also exhibit a power law divergence of the transient time at the transition; however, the exponents are smaller than those found in the simulation which may be due to the three dimensional (3D) nature of the experiments. From the exponents and the general behavior of the shearing system, the transition between the fluctuating and nonfluctuating states is most consistent with an absorbing phase transition in the universality class of directed percolation [16]; however, it has been proposed that this particular system falls into the class of conserved directed percolation (CDP) since the number of colloids is fixed [17].
Here we use a similar protocol to show that the transition from pinned to plastic flow exhibits the same power law diverging transient times as the system organizes into either a nonfluctuating pinned state or a fluctuating plastic flow state. The exponents of the divergence are close to those observed in the colloidal shearing system of Ref. [15]. We also examine quantities that were not measured in the shearing work and show that there is a power law decay in the number of active particles at the transition with an exponent that is in agreement with that predicted for 2D (CDP). We note that the idea of elastic depinning transitions falling into a class of absorbing phase transitions was previously proposed for the depining of elastic lines which fall into the class of 1D (CDP) [18]; however, this is a very different system from plastic depinning since there is no tearing. Additionally, the exponents for the elastic system are very different from what we find.
We specifically model a 2D colloidal system with random quenched disorder, where it has been well established in simulations and experiments that a plastic flow phase occurs for sufficiently strong disorder [13,14]. Since the colloid-colloid interactions are relatively short ranged, we can perform much larger simulations for much longer times near the depinning transition than have previously been done for 2D plastic flow systems. Previous work for a periodically driven vortex system showed a transition from reversible to irreversible flow [19]; however, in Ref. [19] the particles were moving in both states and there was no pinned state, placing the system in a distinctly different regime than that studied here.
We consider a 2D system of size L ×L with periodic boundary conditions in the x and y directions. The sample contains Nc colloidal particles with density nc=Nc/L2 and the time evolution of colloid i at position Ri is governed by the overdamped equation of motion ηdRi/dt = Fcci + Fsi + Fd [13], where the damping constant η = 1. The colloid-colloid interaction potential has a Yukawa form, V(Rij) = (E0/Rij)exp(−κRij), where Rij=|RiRj|, E0=Z*2/(4πϵϵ0 a0), ϵ is the solvent dielectric constant, Z* is the effective charge, 1/κ is the screening length, and the force Fcci = −∑jiNcV(Rij). Lengths are measured in units of a0, assumed to be of the order of a micron, forces in units of F0 = E0/a0, and time in units of ηa02/E0. We neglect hydrodynamic interactions since we are in the low volume fraction, highly charged, electrophoretically driven limit and since the pinned colloids provide the equivalent of a porous medium [20]. The substrate force Fs=−∑k=1NpVp(Rik(p)) arises from Np randomly placed pinning sites of density np=Np/L2, radius rp=0.2, and maximum force Fp, with Vp(Rik(p))=−(Fp/2rp)(Rik(p)rp)2Θ(rpRik(p)), where Θ is the Heaviside step function and Rik(p)=|RiRk(p)| is the distance between particle i and a pin at position Rk(p). The driving force Fd=Fd x represents the effect of an applied electric field [14], and here we consider Fd=0.1. The initial colloid configuration is prepared by simulated annealing with Fd=0. Starting from a fully ordered state does not change the long-time response of the system. We measure the total velocity V=∑iNcdRi/dt ·x. We consider two system sizes, L = 24 and 48, with nc=2.9 and np=3.0. For L = 24, Nc = 1672 and Np=1727, while for L=48, Nc=6688 and Np=6912, the largest system of this type studied to date [21,22]. In the 2D shearing simulations of Ref. [15], 1000 particles were used to explore the diverging time scale, so our system should be sufficiently large to capture the divergence.
Fig1.png
Figure 1: Colloid positions (black dots) and trajectories (black lines) over a fixed time of 5×10³ simulation time steps in a sample with L=24. (a-d) Fp/Fpc=0.93 after (a) 2.5×10³, (b) 1.5×10⁴, (c) 1.5×10⁵, and (d) 1.5×10⁵ simulation time steps, showing that the initial motion settles into a steady fluctuating state. (e-h) Fp/Fpc=1.05 after (e) 2.5 ×10³, (f) 1 ×10⁴, (g) 5×10⁴, and (h) 1 ×10⁵ simulation time steps, showing that the system settles into a pinned state.
In Ref. [13], we showed that a system with quenched disorder exhibits a regime of plastic flow as a function of Fp, and that there is a well-defined depinning threshold Fc as a function of Fd. In this work, we perform a series of simulations for different values of Fp in which we suddenly apply a constant Fd. The system exhibits a transient motion before settling into a completely pinned state or steady moving state. Similar results appear for a periodic driving force with a sufficiently long period. For fixed Fd, there is a critical pinning strength Fcp such that for all Fp > Fcp the system settles into a pinned (absorbing) state, while for FpFcp the system stabilizes in a fluctuating state. For Fd = 0.1, Fpc = 0.3470; thus, the transition from a pinned to a fluctuating state is not simply determined by when the driving force is higher then the pinning force, but is instead affected by the colloid-colloid interactions. In Figs. 1(a)-1(d), we show an example of a system with Fp/Fpc=0.93, below the threshold. Shortly after the drive is applied, Fig. 1(a) indicates that a large portion of the system is in motion. After 1.5 ×10⁴ simulation time steps, Fig. 1(b) shows that the number of moving colloids decreases, while for longer times the number of active colloids settles down to fluctuate around an average value, as shown in Fig. 1(c) at 1 ×10⁵ simulation time steps and in Fig. 1(d) at 1.5 ×10⁵ simulation time steps. For Fp/Fcp > 1.0, the number of active particles decreases to zero over time and the system reaches the pinned state, as illustrated in Figs. 1(e)-1(h) for Fp/Fc = 1.05.
Fig2.png
Figure 2: (a) V(t) for a system with L = 48. Upper curve: Fp = 0.3 and Fp/Fpc=0.86; lower curve: Fp=0.35 and Fp/Fpc=1.008. In both cases a transient appears which is much longer near Fp/Fpc=1. Smooth lines are guides to the eye. (b) The transient time τ versus Fp to decay to the steady fluctuating state (circles) or to the pinned state (squares) for the system in Fig. 2 with L=48. Solid lines: power law fits to the form τ ∝ |FpFcp|−ν, where ν = 1.37 ±0.06. (c) The curves from (b) on a log-log scale.
In Fig. 2(a) we plot V(t), the time trace of the total velocity, for a system with L = 48 at Fcp = 0.35, where the system settles into a fluctuating state, and Fcp = 0.3, where the system reaches a pinned state. To measure the transient time, we use the same procedure as Ref. [15] and fit the decaying V(t) curves to the function V(t) = (V0Vs)exp(−t/τ)/tα + Vs, where V0 is the initial velocity and Vs is the steady state velocity. This functional form approaches a power law at the transition when τ→ ∞, and the value of α only becomes relevant very close to this transition. Performing the same fit for different quantities, such as the fraction of moving particles or the diffusion in the transverse direction, produces the same results. In Fig. 2(b) we plot the transient time τ versus Fp for the sample in Fig. 2(a) on both sides of the transition. A clear divergence in the transient time occurs near Fp = 0.3470. On both sides of the transition, the τ versus Fp curves can be fit with a power law form,
τ = |FpFcp|−ν ,
(1)
with ν = 1.37±0.06. Power law fits appear as solid lines in Fig. 2(b), and in Fig. 2(c) we plot the same data on a log-log scale. Our system sizes are adequate to obtain exponents of this type [21], and our exponent is in good agreement with the value ν = 1.33 found in the 2D shear simulation [15]. The shearing experiments of Ref. [23] gave ν = 1.1; however, since the experiments were conducted in 3D, the exponents could be expected to differ from the 2D case. For example, in conserved directed percolation (CDP), the relaxation time exponent ν|| ≈ 1.29 in 2D and ν|| ≈ 1.12 in 3D, while in directed percolation (DP), ν|| ≈ 1.295 and ν|| ≈ 1.105, respectively [16]. In Fig. 3 we plot τ versus Fp for a sample with L = 24, where we find the same behavior with ν = 1.36 ±0.05. The value of Fcp shifts slightly down to Fpc=0.317. For even smaller systems with L < 24, the periodic boundary conditions begin to affect the results since it becomes possible to stabilize single channels of moving colloids.
Fig3.png
Figure 3: τ versus Fp for the steady fluctuating state (circles) and the pinned state (squares) in a system with L=24. Solid lines: power law fits with ν = 1.36 ±0.06. Inset: the same curves on a log-log scale.
Fig4.png
Figure 4: 
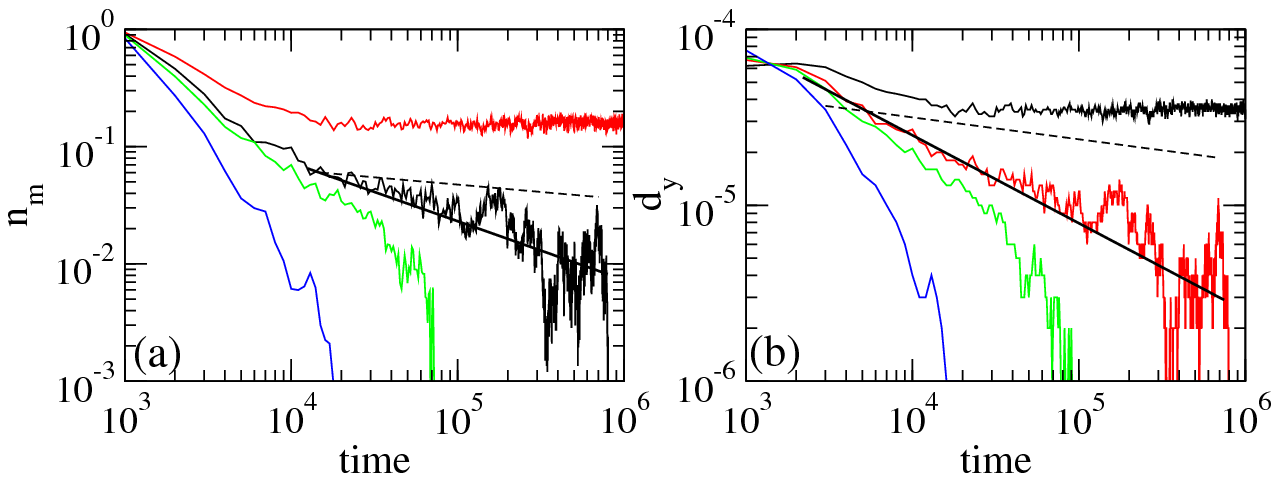
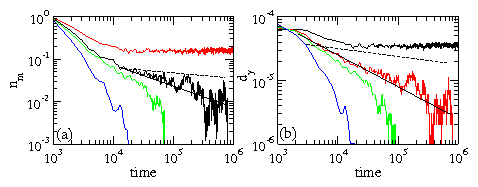
The L=48 system from Fig. 2(b). (a) nm, the fraction of moving particles, versus time for Fp/Fpc=0.927, 1.008, 1.05, and 1.2 (from top to bottom). Straight line: a power law fit with α = 1/2. Dashed line: a power law fit with α = 0.125. (b) dy, the displacements in the y directions, versus time for Fp/Fpc=0.927, 1.008, 1.05, and 1.2 (from top to bottom). Straight line: a power law fit with α = 1/2. Dashed line: a power law fit with α = 0.125.
In absorbing phase transitions, it is expected that very close to the transition, the transient states should show a power law decay with I(t) ∝ t−α [16,24]. We consider two quantities: the fraction of moving colloids, nm(t)=Nc−1iNcΘ(|Ri(t)−Ri(t−δ)|−∆), with δ = 1000 and ∆ = 0.0005, and the transverse displacements, dy(t)=∑iNc|(Ri(t)−Ri(t−δ))·y|. In Fig. 4(a) we plot the time decay of nm(t) at Fp/Fcp = 0.927, 1.008, 1.05 and 1.2, while in Fig. 4(b) we show the decay of dy(t) for the same pinning strengths. In both cases, curves close to the transition can be fit to a power law decay with α = 1/2, as indicated by the solid lines in Figs.  4(a) and 4(b). A similar power law decay with α = 1/2 has recently been observed for systems exhibiting absorbing phase transitions in 2D [24]. Because of the anisotropy introduced by the driving force, it is possible that our system could exhibit 1D CDP; this would give α = 0.125, and we plot a line with this slope in Fig. 4(b) for comparison. It would be interesting to examine similar power law decays in the colloidal shearing simulations and experiments. We have also measured the order parameter exponent β = 0.6±0.06. In 2D, DP gives α ≈ 0.451 and β ≈ 0.583 while CDP gives α ≈ 0.50 and β ≈ 0.64 [16]; our exponents are not accurate enough to distinguish between these two models. We are unable to perform a finite size scaling analysis since systems with Nc > 7000 take a prohibitively long time to simulate while systems with Nc < 1500 suffer from persistent channels of flow induced by the periodic boundaries. Finite temperature can smooth the transition, but it should remain observable at sufficiently low temperatures [25].
Our results could be directly tested in experiments with colloidal particles [14]. It is possible to trap colloids optically [26], so it should also be possible to create a disordered optical trap array in which the strength of the traps can be controlled by the adjusting the laser strength. In this way, a constant drive could be applied to the system while the trap strength is varied. Additionally, it should be straightforward to conduct similar experiments for vortices in samples that are in the plastic flow regime. For example, experiments performed near the peak effect where plastic flow is expected to occur have revealed a decaying voltage signal when a driving force is suddenly applied [27]. The voltage is proportional to the average vortex velocity, indicating that the vortices are undergoing transient motion. With this type of system, the effectiveness of the pinning changes sharply with the applied magnetic field near the peak effect; thus, it should be possible to apply a constant current and decrease or increase the magnetic field in order to observe a transition between a regime that decays into a pinned state to one that decays to a fluctuating state, and then measure the transient times near the transition.
In summary, we have shown that a 2D plastic depinning system exhibits behavior that is very similar to that of the recently studied random organization phenomenon observed in 2D sheared particle systems. Under a sudden applied drive, there is a well-defined critical transition where the system organizes into either a nonfluctuating (absorbing) state or into a fluctuating state. The transient time diverges as a power law at the transition with exponents that are the same as those found in a system subjected to shear. Our results provide evidence that plastic depinning falls into the class of absorbing phase transitions which include directed or conserved directed percolation. We also propose simple experimental tests for this transition in colloidal and vortex systems.
This work was carried out under the auspices of the NNSA of the U.S. DoE at LANL under Contract No. DE-AC52-06NA25396.

References

[1]
H.J. Jensen, A. Brass, and A.J. Berlinsky, Phys. Rev. Lett. 60, 1676 (1988); H.J. Jensen, A. Brass, Y. Brechet, and A.J. Berlinsky, Phys. Rev. B 38, 9235 (1988); M.C. Faleski, M.C. Marchetti, and A.A. Middleton, ibid. 54, 12427 (1996); N. Grønbech-Jensen, A.R. Bishop, and D. Domínguez, Phys. Rev. Lett. 76, 2985 (1996); E. Olive and J.C. Soret, Phys. Rev. B 77, 144514 (2008); C.J. Olson, C. Reichhardt, and F. Nori, Phys. Rev. Lett. 80, 2197 (1998).
[2]
A.P. Mehta, C. Reichhardt, C.J. Olson, and F. Nori, Phys. Rev. Lett. 82, 3641 (1999); K.E. Bassler, M. Paczuski, and G.F. Reiter, ibid. 83, 3956 (1999).
[3]
S. Bhattacharya and M.J. Higgins, Phys. Rev. Lett. 70, 2617 (1993); M.C. Hellerqvist et al., ibid. 76, 4022 (1996).
[4]
A. Tonomura et al., Nature 397, 308 (1999).
[5]
D. Domínguez, Phys. Rev. Lett. 72, 3096 (1994).
[6]
M.-C. Cha and H.A. Fertig, Phys. Rev. B 50, 14368 (1994).
[7]
A.A. Middleton and N.S. Wingreen, Phys. Rev. Lett. 71, 3198 (1993); C. Reichhardt and C.J. Olson Reichhardt, ibid. 90, 046802 (2003).
[8]
O. Narayan and D.S. Fisher, Phys. Rev. B 49, 9469 (1994).
[9]
J. Watson and D.S. Fisher, Phys. Rev. B 55, 14909 (1997).
[10]
P. Moretti, M.-C. Miguel, M. Zaiser, and S. Zapperi, Phys. Rev. B 69, 214103 (2004).
[11]
M.-C. Miguel, A. Vespignani, M. Zaiser, and S. Zapperi, Phys. Rev. Lett. 89, 165501 (2002).
[12]
M.C. Marchetti and K.A. Dahmen, Phys. Rev. B 66, 214201 (2002).
[13]
C. Reichhardt and C.J. Olson, Phys. Rev. Lett. 89, 078301 (2002).
[14]
A. Pertsinidis and X.S. Ling, Phys. Rev. Lett. 100, 028303 (2008).
[15]
L. Corte, P.M. Chaikin, J.P. Gollub, and D.J. Pine, Nature Phys. 4, 420 (2008).
[16]
H. Hinrichsen, Adv. Phys. 49, 815 (2000); G. Odor, Rev. Mod. Phys.76, 663 (2004).
[17]
G.I. Menon and S. Ramaswamy, Phys. Rev. E 79, 061108 (2009).
[18]
J.A. Bonachela, H. Chaté, I. Dornic, and M.A. Muñoz, Phys. Rev. Lett. 98, 155702 (2007).
[19]
N. Mangan, C. Reichhardt, and C.J. Olson Reichhardt, Phys. Rev. Lett. 100, 187002 (2008).
[20]
D. Long and A. Ajdari, Eur. Phys. J. E 4, 29 (2001); M. Rex and H. Löwen, ibid. 26, 143 (2008).
[21]
C. Heussinger and J.-L. Barrat, Phys. Rev. Lett. 102, 218303 (2009).
[22]
P. Olsson and S. Teitel, Phys. Rev. Lett. 99, 178001 (2007).
[23]
D.J. Pine, J.P. Gollub, J.F. Brady, and A.M. Leshansky, Nature 438, 997 (2005).
[24]
K.A. Takeuchi, M. Kuroda, H. Chaté, and M. Sano, Phys. Rev. Lett. 99, 234503 (2007).
[25]
A.M. Ettouhami and L. Radzihovsky, Phys. Rev. B 67, 115412 (2003).
[26]
P.T. Korda, M.B. Taylor, and D.G. Grier, Phys. Rev. Lett. 89, 128301 (2002).
[27]
Z.L. Xiao, E.Y. Andrei, and M.J. Higgins, Phys. Rev. Lett. 83, 1664 (1999).


File translated from TEX by TTHgold, version 4.00.
Back to Home