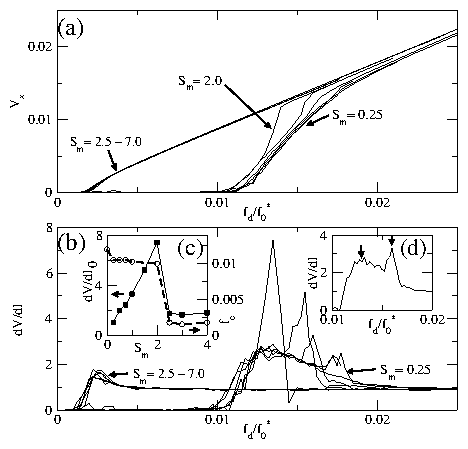
 Figure 4: (a) Vx(I) curves for samples with different values of sm.
From right to left, sm=0.25, 0.5, 0.75, 1.0, 1.5, 2.0, 2.5, 3.0,
4.0, 5.0, 6.0, and 7.0.
(b) dV/dI curves for the same samples, from right to left, as listed
above.
(c) Filled squares: The value of dV/dI0, the maximum in the dV/dI
curve, for samples with different sm. dV/dI0 increases significantly
as the transition value of sm is approached from below. Open circles
and dashed line: fc versus sm.
(d) dV/dI for a single sample with sm=1.0 illustrating the double
peak feature.
The first broad peak (left arrow) appears just above the 2D depinning
current of fd/f0*=0.010 and is associated with 2D decoupled
plastic flow. The second sharp peak (right arrow)
is associated with the dynamic
recoupling transition.
|
