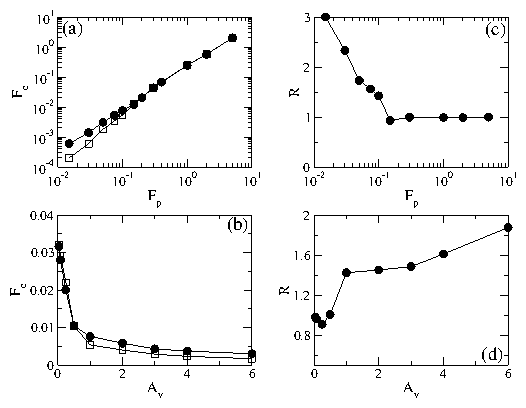
Physical Review E 77, 041401 (2008)

Disordering Transitions and Peak Effect in Polydisperse Particle Systems

C. Reichhardt and C.J. Olson Reichhardt

Theoretical Division, Los Alamos National Laboratory, Los Alamos, New Mexico 87545, USA

(Received 26 April 2007; revised manuscript received 20 November 2007; published 4 April 2008)

We show numerically that in a binary system of Yukawa particles, a dispersity driven disordering transition occurs. In the presence of quenched disorder this disordering transition coincides with a marked increase in the depinning threshold, known as a peak effect. We find that the addition of poorly pinned particles can increase the overall pinning in the sample by increasing the amount of topological disorder present. If the quenched disorder is strong enough to create a significant amount of topological disorder in the monodisperse system, addition of a poorly pinned species generates further disorder but does not produce a peak in the depinning force. Our results indicate that for binary mixtures, optimal pinning occurs for topological defect fraction densities of 0.2 to 0.25. For defect densities below this range, the system retains orientational order. We determine the effect of the pinning density, strength, and radius on the depinning peak and find that the peak effect is more pronounced in weakly pinning systems.
I. INTRODUCTION
II. SIMULATION
III. EFFECT OF PARTICLE DISPERSITY WITHOUT QUENCHED DISORDER
IV. EFFECT OF QUENCHED DISORDER
V. CHANGING THE PARTICLE SPECIES RATIO
VI. VARIED PINNING DENSITY AND PINNING RADIUS
VII. VARIED PINNING STRENGTH AND PARTICLE INTERACTION STRENGTH
VIII. DEFECT DENSITY AND ORIENTATIONAL ORDER
IX. SUMMARY
References


I.  INTRODUCTION

In two dimensional (2D) systems, an ordered phase can undergo an amorphization transition in the presence of random quenched disorder. At zero temperature and for sufficiently strong quenched disorder, this transition is characterized by the appearance of isolated dislocations [1]. Disordering transitions can have a profound effect on transport properties. One of the best known examples of this phenomenon is the peak effect observed for vortices in type-II superconductors [2,3,4,5,6]. Here, an ordered vortex lattice is weakly pinned by random quenched disorder; however, as the temperature or magnetic field is increased, the vortex lattice disorders and a sudden increase or peak in the pinning force occurs. The peak effect is known to be relevant to 2D and effectively 2D superconducting systems [3].
An early explanation for the increase in the pinning force was that a disordered vortex system with numerous topological defects is much softer than an ordered vortex lattice, and as a result the vortices in the disordered state can shift positions in order to accommodate to the pinning landscape [2,6]. A proliferation of topological defects has also been correlated with an increase in the effective friction force in nanomaterials near the bulk melting temperature where a peak effect type phenomenon can occur [7,8]. Although the peak effect has been associated with the appearance of topological defects, a comprehensive understanding of exactly how the density or type of topological defects relates to the pinning effectiveness is still lacking. Interpreting the peak effect phenomenon is also complicated by thermal effects, and controversy remains over whether the disordering of the vortex lattice is predominately a melting phenomena [4,6] or is nonthermal [9]. There are still several open issues related to the peak effect in superconductors and its connection to the shape of the current-voltage curves [10], transient dynamics [11], and the magnetic field-temperature (H-T) phase diagram [12].
In two dimensional systems with binary or polydisperse interactions, a topological disordering transition occurs with increasing dispersity [13,14,15]. An open question is how quenched disorder affects a dispersity-driven amorphization process and how the amorphization might alter the pinning effectiveness. A stiff lattice is poorly pinned by random disorder, and thus in a monodisperse assembly of repulsively interacting particles on quenched random disorder, the depinning threshold decreases when the lattice is stiffened by increasing the repulsion between the particles [16]. A similar decrease of the depinning threshold with increasing particle-particle interactions occurs even when the monodisperse system contains some topological disorder and is no longer a perfect elastic lattice [16]. The situation may be different in a bidisperse system where the relative strength of the repulsive interactions between the two particle species can be independently tuned. If the interaction strength of one species is increased while that of the other species is held constant, the depinning threshold for motion over a random substrate may decrease; however, an amorphization of the bidisperse lattice occurs when the difference between the repulsive interactions of the two species is large enough. The effective softness of the lattice increases sharply once topological defects appear in the system, and thus the depinning threshold may increase rather than decrease when the particle interaction strength is increased across the amorphization transition.
Polydisperse systems with quenched disorder can be used as models for exploring the interaction between defects and pinning since the number of topological defects can be controlled readily. Binary and polydisperse particle interactions appear in a variety of systems which can also have quenched disorder, including vortices in Bose-Einstein condensates [17], electron bubble mixtures [18], mixtures of Abrikosov and Josephson vortices [19], and colloidal systems [20,21]. In two dimensional colloidal systems, it was recently demonstrated that interactions with a very long screening length can be realized experimentally [22] and that disordered phases occur which are likely induced by polydispersity [23]. Two dimensional colloidal disordering transitions and pinning phenomena in the presence of quenched disorder have also been demonstrated experimentally [24]. Interaction dispersity can also arise in the pinning of a nanofriction system. It would be very useful to understand how to control the defect density and pinning in these types of systems by manipulating the polydispersity in the particle interactions.
In this paper we consider a two dimensional model of two species of particles interacting via a repulsive Yukawa potential both with and without quenched disorder. In the absence of quenched disorder, we find a well defined low temperature disordering transition as a function of dispersity. In the presence of weak quenched disorder, this disordering transition is accompanied by a sharp increase in the depinning force or a peak effect. The peak effect phenomenon we observe is nonthermal and occurs due to the proliferation of topological defects. Our results indicate that there is a complex interplay between the density of topological defects and the depinning force. We identify where the peak effect phenomenon occurs as a function of pinning strength, density, radius, and interparticle interaction strength.

II.  SIMULATION

We simulate a two dimensional system of bidisperse particles in a sample of size Lx=Ly=36 with periodic boundary conditions in the x and y directions. The particles interact via a Yukawa potential
V(Rij) = CiCjZ

4πϵϵ0
e−κRij

Rij
,
(1)
where Ri(j) is the position of particle i(j), Rij=|RiRj|, Ci(j) is the charge of particle i(j), 1/κ is the screening length, and ϵ is the dielectric constant. The interaction force prefactor Z is set to Z=1 unless otherwise noted. In this work we fix kappa at κ = 2.0. We consider a binary arrangement of NA and NB particles of species A and B, respectively, which have different charges denoted by CA and CB. For a monodisperse system CB/CA = 1.0. The total number of particles N = NA + NB and the density n=N/LxLy. In general we fix N=856 and CA=1 and vary either the ratio NB/N or CB/CA. The particles also interact with a random quenched background which is modeled as Np randomly placed parabolic traps of radius rp = 0.3, density np=Np/LxLy=0.66 and maximum force fp. The parabolic trap potential is similar to that used in previous work [25], Vp(Rik)=−(fp/2rp)(Rikrp)2 for Rikrp and zero interaction for Rik > rp, where Rik=|RiRk| and Rk is the position of trap k. The particles evolve under Brownian dynamics, performed by integrating the overdamped equation of motion
η dRi

dt
= − N

ji 
V(Rij) − Np

k 
Vp(Rik) + FD + FT,
(2)
where η is the damping constant. The external dc driving force FD=FDx is slowly increased from zero in increments of δFD=2×10⁻⁵ applied every 2.5×10⁴ simulation steps. We have found that slower increment rates do not change the results. The thermal force FT is modeled as random Langevin kicks with 〈FT〉 = 0 and 〈FT(t)FT(t′)〉 = 2ηkBTδ(tt′). Since we are interested in nonthermal effects, we consider a low temperature T/Tm=0.15, where Tm is the melting temperature of a monodisperse system with NB/N=0 at density n=0.66. The initial particle configurations are obtained using two techniques which produce identical results. In the first, we perform simulated annealing, while in the second, we place the particles in a triangular lattice, and when the dispersity is large enough defects naturally appear.
Fig1.png
Figure 1: (a) Fraction of defected particles Pd vs the ratio of the particle interaction strength CB/CA for a mixture with NB/N=0.5, CA = 1.0, and fp=0 at different net particle densities n = 0.97 (filled triangles), n=0.66 (filled circles), and n=0.32 (open squares). (b) Phase diagram of n vs CB/CA for the same system.

III.  EFFECT OF PARTICLE DISPERSITY WITHOUT QUENCHED DISORDER

To demonstrate that this system exhibits a dispersity driven disordering transition in the absence of quenched disorder, we consider a sample with NB/N=0.5 and CA=1.0 at different particle densities n=0.97, 0.66, and 0.32 for fp=0. In Fig. 1(a) we plot the fraction of defected particles Pd=N−1i=1N[1−δ(6−zi)] as a function of CB/CA at the three different densities, where zi is the coordination number of particle i obtained from a Delaunay triangulation. In each case, when CB/CA is near 1, the system forms a triangular lattice free of topological defects and Pd=0. Once the dispersity is strong enough, a disordering transition occurs with a proliferation of defects and Pd rises above zero. The dominant type of defects we observe are fivefold and sevenfold coordinated particles, although in the very disordered states it is possible to find a small fraction of fourfold or eightfold coordinated particles. As the density of the system increases, the dispersity CB/CA at which the disordering transition occurs decreases since the particle-particle interactions are stronger at higher density and thus the strain energy induced by the dispersity in the particle interactions increases.
Fig2.png
Figure 2: (a,b) Particle positions in a 24 ×24 portion of a sample with NB/N=0.5, n=0.66, and fp=0. Large circles: species A; small circles: species B. (a) The ordered regime at CB/CA=1.2. (b) The disordered regime at CB/CA=2.0. (c,d) The corresponding Delaunay triangulations at (c) CB/CA=1.2 and (d) CB/CA=2.0. Dark circles: fivefold coordinated particles; light circles: sevenfold coordinated particles.
By conducting a series of simulations we map the order-disorder transition line as a function of density n and polydispersity CB/CA, shown in Fig. 1(b). The order to disorder transition is defined as occurring when the fraction of defected particles reaches Pd = 0.2. If a different cutoff value of Pd is used to identify the transition, the general features of the phase diagram are unchanged but the precise location of the transition can shift. At low densities n < 0.06 the system is in a liquid state even for CB/CA = 1.0 since the particle-particle interactions are not strong enough to overcome the thermal forces. Since the simulation is performed at finite temperature, the thermal forces become important when the particle-particle interactions are weak enough. For a system with a finite particle-particle interaction range, the particle density can be decreased to a point at which there is no elasticity since adjacent particles are no longer interacting on average. This is what gives rise to the low density liquid state.
In Fig. 2(a) we illustrate the particle positions for a system at n=0.66 with CB/CA=1.2 in the ordered regime. The corresponding Delaunay triangulation shown in Fig. 2(c) indicates that all of the particles are sixfold coordinated and form a triangular lattice. Figure 2(b) shows the particle positions in the same system at CB/CA=2.0 in the disordered regime, while Fig. 2(d) illustrates that in this regime the lattice is filled with fivefold and sevenfold coordinated defects.
In the phase diagram of Fig. 1(b), we only distinguish between the topologically ordered and topologically disordered states, and indicate the reentrant disordering transition into a liquid state that occurs at low densities. At intermediate densities, the disordered phase may have glasslike features, implying that there could be another line on the phase diagram between a liquidlike and glasslike state. Determining whether such a line is present or absent is beyond the scope of the present paper. It is likely that the actual lowest energy state for the polydisperse system is phase separated; however, we have never observed such a state. Recent experiments and simulations of binary colloidal systems with dispersity similar to what we consider here also produced no phase separated states, but did show some evidence for clustering [20]. In simulations by Sadr-Lahijany et al. [13], an intermediate hexatic phase appeared in certain regions of the density-polydispersity phase diagram. The hexatic phase is characterized by an algebraic decay in the orientational correlation function. In general, hexatic phases are difficult to observe and there are still open questions about the nature of this phase. It is beyond the scope of this work to address the possible existence of a hexatic phase in clean systems; instead, we focus on the regimes with quenched disorder.
Fig3.png
Figure 3: (a) Depinning force Fc and (b) fraction of defected particles Pd vs CB/CA for a mixture at n=0.66 with NB/N=0.5 on a random pinning substrate with fp = 0.1 and np = 0.66. (c,d) Fc and Pd versus CB/CA for a system with the same parameters except with fp = 0.4.

IV.  EFFECT OF QUENCHED DISORDER

In Fig. 3(b) we plot Pd vs CB/CA for a mixture with NB/N=0.5 and n=0.66 in the presence of a random pinning potential with fp = 0.1 and np=0.66. At this pinning strength the system is free of dislocations for CB/CA < 1.6. Near CB/CA = 1.75 an order-disorder transition occurs. In Fig. 3(a) we plot the corresponding critical depinning force Fc which is the value of FD at which the velocity of the particles in the direction of the drive exceeds 5×10⁻⁴. In general there are two predominant pinning regimes. For the defect-free lattice at CB/CA < 1.6, the depinning occurs elastically without the further generation of defects. In this case the depinning threshold is well defined as the entire lattice moves at the same average velocity. Once defects begin to appear around CB/CA=1.75, the depinning becomes plastic and a portion of the particles can be moving while another portion remains pinned, leading to very inhomogeneous and intermittent velocity bursts. The large fluctuations associated with plastic depinning can also lead to long transient responses where a portion of the system is initially moving when a drive is applied, but over time the entire system becomes pinned. In order to accurately measure a depinning threshold in the topologically disordered regime, sufficiently long run times at each force increment are needed in order to obtain a smoother velocity-force curve. We also note that changing the value of the threshold velocity for the depinning measurement does not change the general features of the results.
Figure 3(a) shows that the depinning force Fc initially decreases with increasing CB/CA in the ordered regime, but then starts to shift upward once CB/CA=1.2. At the order-disorder transition which occurs at CB/CA=1.75 there is a sharp increase in Fc followed by a slow decrease for increasing CB/CA. We term this phenomenon a dispersity driven peak effect. This result demonstrates that a peak effect can arise via a completely nonthermal disordering process.
For a monodisperse system with CB/CA=1, increasing the magnitude of the repulsive interaction CB always reduces Fc [16]. In contrast, the results in Fig. 3(a) show that increasing the charge of only a fraction of the particles can actually increase the depinning force. The maximum in Fc occurs when a fraction Pd=0.2 of the particles are defected. As CB/CA increases further above CB/CA=1.75, Pd increases; however, the depinning force decreases. This result indicates that although a peak effect occurs at the onset of defect proliferation, simply having more topological defects does not directly translate to a higher depinning force.
For a monodisperse system, increasing the strength of the repulsive particle-particle interactions decreases the depinning threshold. In the bidisperse system in Fig. 3(a), when CB/CA is increased above 1 by only a small amount, the net distortion of the lattice is small and no dislocations are induced since the system is still nearly monodisperse. Thus in this regime, increasing CB/CA increases the overall effective lattice stiffness and causes the depinning threshold to decrease. Once CB/CA is large enough [CB/CA > 1.2 in Fig. 3(a)], more significant distortions of the lattice occur due to the fact that the two particle species are randomly interspersed, and these distortions effectively soften the lattice and increase the depinning threshold. As CB/CA continues to increase, the distortions become large enough to induce the formation of dislocations [CB/CA=1.75 in Fig. 3(a)], and the order-disorder transition occurs. The depinning threshold increases rapidly since the particles can shift into optimal pinning locations once the dislocations appear, and the maximum in Fc occurs at CB/CA=1.8. When CB/CA is increased above 1.8, defects continue to proliferate in the lattice but the particles are already in their optimal pinning locations so no further enhancement of the depinning threshold occurs. Instead, as the particle-particle interaction force becomes stronger, the local stiffness of the lattice increases, shifting the particles away from the optimal pinning locations and causing the depinning threshold to decrease again with increasing CB/CA > 1.8.
To show that the order-disorder transition is responsible for the peak in the depinning force, in Fig. 3(c,d) we plot Fc and Pd vs CB/CA for a system with the same parameters as in Fig. 3(a,b) but with a stronger pinning force of fp=0.4. For this value of fp, the monodisperse system CB/CA = 1.0 already contains a significant fraction of topological defects, with Pd=0.34. As CB/CA increases from 1 the defect density Pd decreases; however, for CB/CA > 1.5 Pd begins to increase again. In contrast, the depinning force Fc decreases monotonically for all CB/CA > 1.0. We have performed a series of simulations for other values of fp and pinning densities np and find the following general features. (1) A peak effect phenomenon occurs whenever there is an order to disorder transition. (2) The peak in the depinning force occurs when a fraction of about Pd=0.15 to 0.3 of the particles are defected. (3) If the system is already strongly disordered for the monodisperse case CB/CA=1, there is no enhancement in depinning force with increasing CB/CA even when the fraction of topological defects increases.
Fig4.png
Figure 4: (a) The depinning force Fc for varied species ratio NB/N at fixed n = 0.66, np = 0.66, and fp = 0.1. Filled squares: CB/CA=1.5. Open circles: CB/CA = 1.825. (b) The corresponding fraction of defected particles Pd. (c) Fc vs NB/N for the same set of parameters in (a) but with CB/CA = 2.5. Open circles: fp=0.1. Filled squares: fp = 0.4 (this curve was divided by 10 for presentation purposes). (d) The corresponding Pd curves.

V.  CHANGING THE PARTICLE SPECIES RATIO

We next consider the effect of varying the species ratio NB/N at fixed particle density n=0.66 to explore the disordering and depinning effects as the mixture varies from monodisperse species A, NB/N=0, to monodisperse species B, NB/N=1. In Fig. 4(a) we plot the depinning force Fc vs NB/N for a system with fp = 0.1, np = 0.66, and CA = 1 at CB/CA=1.5 and CB/CA=1.825. Figure 4(b) shows the corresponding Pd curves. For CB/CA = 1.5, there is no dislocation induced transition at any fraction NB/N and Fc shows no enhancement but merely decreases above NB/N=0.5. The depinning force Fc=0.003 for the monodisperse B system at NB/N=1 is less than that of the pure A system, Fc=0.005 at NB/N=0, as expected for monodisperse systems due to the increased repulsive force between species B particles compared to species A. The depinning force for the pure B system is lower at CB/CA=1.825 than at CB/CA=1.5; however, for intermediate values of NB/N in the CB/CA=1.825 sample there is a strong enhancement of Fc over the depinning force for either the pure A or pure B systems. The enhancement of Fc for CB/CA = 1.825 is associated with the creation of defects, as shown by the behavior of Pd in Fig. 4(b). The defect density reaches a maximum value of Pd=0.21 at NB/N = 0.5. The peak value of Fc also falls at NB/N=0.5. These results show that, due to induced disorder, the effective pinning force for mixed species can be higher than that of either of the pure species.
In Fig. 4(c) we plot Fc vs NB/N for a system with CB/CA = 2.5 and CA = 1.0 at fp = 0.1 and fp = 0.4. For fp = 0.1, the system becomes increasingly disordered as NB/N increases from zero until Pd reaches a maximum of Pd=0.48 at NB/N=0.44, as shown in Fig. 4(d). For NB/N > 0.44, Pd decreases back to Pd = 0 for the pure B system. There is a peak in Fc at NB/N = 0.2, where Pd = 0.3. In general we find that for increasing CB/CA and fixed CA, the peak in Fc shifts to lower values of NB/N. The peak in Fc occurs when a fraction Pd ∼ 0.2 of the particles are disordered, and since higher values of CB/CA disorder the system more effectively, a lower fraction of species B is needed to reach Pd=0.2 as CB/CA increases. This result suggests that strong enhancement of the pinning can be achieved by adding a few strongly repulsive particles to a pure system. For the case of fp = 0.4 in Fig. 4(c,d), the pure A case is already strongly defected, so as NB/N is increased from zero, Fc monotonically decreases while Pd increases slightly and then decreases.
We find that for decreasing fp, the maximum value Fcmax of Fc in the mixed sample increases relative to the value Fcpure of Fc in the pure samples with NB/N=0 or 1. This can be understood by a simple argument. For the pure samples, the pinning is collective and FcpureF2p, while at the mixed sample peak the pinning behaves more like single particle pinning with FcmaxFp, so that Fmaxc/Fpurec ∝ 1/Fp. This indicates that in pure systems with weak pinning, the addition of a second species could have a very significant effect on the pinning properties.
Fig5.png
Figure 5: (a) The depinning force Fc for varied species ratio NB/N at fixed n = 0.66, np = 0.66, fp = 0.1, and CB/CA=1.5. Open diamonds: T/Tm = 0. Filled circles: T/Tm = 0.15.
The results up to this point were obtained at a finite but low temperature. Most experiments with colloids are performed in regimes where some Brownian motion occurs, and our results show that the peak effect phenomenon is robust against the addition of a small temperature and thus could be observed in colloidal experiments. At higher temperatures, a significant amount of creep occurs in the disordered regimes and makes obtaining an accurate depinning threshold difficult. This type of thermally activated motion will be described elsewhere. To illustrate that our results remain unchanged for T = 0, in Fig. 5 we plot Fc vs NB/N for the same system in Fig. 4(a) at CB/CA = 1.5, showing that there is a negligible difference between the T=0 and finite T results.

VI.  VARIED PINNING DENSITY AND PINNING RADIUS

Fig6.png
Figure 6: (a) The depinning force Fc vs pinning density np for a system with fixed fp = 0.1, rp = 0.3, and NB/N=0.5 for the bidisperse system CB/CA = 1.85 (black circles) and the monodisperse system CB/CA = 1.0 (open squares). (b) The ratio R of Fc for the bidisperse and monodisperse samples in (a). (c) The depinning force Fc vs pinning radius rp for a fixed pinning density of np = 0.66 at NB/N=0.5 for CB/CA = 1.85 (black circles) and CB/CA = 1.0 (squares). (d) The ratio R of Fc for the bidisperse and monodisperse samples in (c).
We next vary several parameters of the pinning sites in order to understand how general the peak effect phenomenon is in binary systems with quenched disorder. In Fig. 6(a) we show Fc vs pinning density np for a sample with NB/N=0.5, n=0.66, np=0.66, and fp=0.1 at CB/CA = 1.825, corresponding to the peak value of Fc in Fig. 3(a), and CB/CA=1.0, corresponding to a monodisperse system. To indicate the magnitude of the peak effect, we calculate the ratio of the bidisperse and monodisperse depinning thresholds, R=Fc(CB/CA=1.825)/Fc(CB/CA=1), and plot the result in Fig. 6(b). Although Fc increases monotonically with np for both values of CB/CA, Fc is always higher in the polydisperse system. The ratio R goes through a maximum near np = 0.66 when the density of particles equals the density of pins. At low np, the bidispersity leads to little enhancement of the depinning threshold compared to the monodisperse system. When there are few pinning sites, most pinning sites can be occupied even in the monodisperse case, so softening the lattice by making the particles bidisperse and introducing dislocations does not create a significantly larger number of pinned particles. As a result, the enhancement of Fc by the polydispersity is weak in this regime. Similarly, at high pinning densities there are so many pins available that less distortion of the lattice is required to permit most of the particles to occupy pinning sites, so the introduction of dislocations due to bidispersity does not create as large of an enhancement in Fc compared to the intermediate pinning density regime.
In Fig. 6(c) we plot Fc versus pinning radius rp for a system with fixed np = 0.66, n=0.66, NB/N=0.5 and fp = 0.1 at CB/CA = 1.825 and CB/CA = 1.0. We plot the corresponding ratio R of the depinning forces in Fig. 6(d). Here, R decreases monotonically with increasing rp. As the size of the pinning sites increases, the amount of lattice distortion required to permit most particles to occupy a pinning site decreases since a larger area of the sample is covered by the pinning sites. Thus, there is a decreasing enhancement of Fc due to bidispersity as rp increases.

VII.  VARIED PINNING STRENGTH AND PARTICLE INTERACTION STRENGTH

Fig7.png
Figure 7: (a) The depinning force Fc vs pinning strength fp for a system with fixed np = 0.66, n=0.66, rp = 0.3, and NB/N=0.5. Filled circles: CB/CA = 1.825; open squares: CB/CA = 1.0. (b) The ratio R of the bidisperse and monodisperse critical depinning forces from (a). (c) The depinning force Fc vs particle interaction strength Z for a system with fixed np = 0.66, n=0.66, rp = 0.3, and NB/N=0.5. Filled circles: CB/CA = 1.825; open squares: CB/CA = 1.0. (d) The ratio R of the critical depinning forces from (c).
In Fig. 7(a) we plot Fc vs pinning strength fp for a system with np = 0.66, n=0.66, rp = 0.3, and NB/N=0.5 for the bidisperse case CB/CA = 1.825 and the monodisperse case CB/CA = 1.0. The corresponding ratio R of the bidisperse to the monodisperse depinning threshold is plotted in Fig. 7(b). For large fp, both the monodisperse and the bidisperse systems are considerably defected and R ≈ 1. In this regime the critical depinning force Fc depends linearly on fp, as expected for single particle pinning behavior. For fp < 0.2, the monodisperse system is defect-free and the depinning crosses over to collective pinning behavior with Fcfp2. In the same regime, true collective behavior does not occur for the bidisperse system and the depinning force falls off less steeply than fp2, as seen in Fig. 7(a). Thus the ratio R between the bidisperse and monodisperse depinning thresholds grows with decreasing fp, as shown in Fig. 7(b) for fp < 0.2. This result indicates that for weaker pinning, the peak effect phenomenon is more pronounced.
To vary the overall particle-particle interaction strength, we adjust the value of the interaction prefactor Z in Eq. (1). For larger Z, the particles are more repulsive and the lattice is stiffer. We plot the effect of changing Z on Fc in Fig. 7(c) for both monodisperse (CB/CA=1) and bidisperse (CB/CA=1.825) samples with np = 0.66, n=0.66, rp = 0.3, fp = 0.1, and NB/N=0.5. The corresponding ratio R of the depinning threshold for the bidisperse and monodisperse samples is shown in Fig. 7(d). We note that changing Z has an effect similar to changing κ since the lattice becomes stiffer for smaller κ. For Z > 1, the monodisperse system at CB/CA=1 is defect free, the depinning is elastic, and R increases with increasing Z. In this case, the effect of increasing Z is similar to the effect of decreasing fp. For Z < 1, the monodisperse system becomes topologically disordered and R approaches 1.0 as Z decreases.
These results show that the peak effect phenomenon is observable in a polydisperse system whenever the effective quenched disorder is weak enough that the monodisperse system is free of defects. The monodisperse lattice is pinned collectively by the random disorder, and the collective pinning is always weaker than the single particle pinning which occurs in a topologically disordered polydisperse particle lattice. In regimes where the quenched disorder is strong enough that both the monodisperse and the polydisperse systems are topologically disordered, there is little difference in the depinning force between the polydisperse and the monodisperse cases, and no peak in the depinning force appears.

VIII.  DEFECT DENSITY AND ORIENTATIONAL ORDER

Fig8.png
Figure 8: The value of the bond orientational correlation function g6(r) at r = 5.0 versus the fraction of defected particles Pd in a system with CB/CA = 2.5 and fp=0.1 at various particle ratios NB/N.
A general trend visible in Fig. 3(a,b) and Fig. 4(a,b,c,d) is that the peak in Fc corresponds to a defect density of around Pd ≈ 0.2. For defect densities Pd > 0.2, the depinning force Fc decreases with increasing Pd. Recent simulations of two-dimensional monodisperse Yukawa particle systems have shown that as a function of defect density, the orientational correlations are lost when the fraction of defected particles is Pd > 0.2 [26]. The orientational correlations are measured by means of the local bond orientational order parameter [27],
ψ6(Ri) =  
 
1

Ni
Ni

j = 1 
e6iθij  
 
.
(3)
Here Ni is the number of nearest neighbors of particle i and θij is the angle between an arbitrary fixed reference axis and the bond connecting particles i and j. The bond orientational correlation function g6(r) = 〈ψ6*(R′)ψ6(R′− r)〉/g(r), where the pair distribution function g(r)=〈δ(R′)δ(R′−r)〉. Orientational order is present when g6(r) decays algebraically with r.
We measure g6(r) as a function of defect density Pd in a system with CB/CA = 2.5 and fp = 0.1 over a range of defect fractions from Pd=0.0 to Pd=0.5 obtained by varying NB/N, as indicated in Fig. 4(d). In Fig. 8 we plot the value of g6(r) at r = 5.0 versus Pd. The orientational order decreases monotonically with increasing Pd. We also find that g6(r) decays exponentially with r for Pd > 0.2, indicating that the system has lost orientational order above Pd=0.2.
For defect densities below Pd=0.2, the system is orientationally ordered and the depinning is elastic in nature. The defects soften the lattice locally, allowing the particles to become better pinned. As more defects are added and Pd increases, the lattice continues to soften until the orientational order is lost at Pd=0.2, which corresponds to the elastic-plastic depinning transition. Once in the plastic depinning regime, the addition of more particles or more defects does not further increase the softness of the lattice. In our system, species B is more highly charged than species A and thus species B is in general less well pinned due to the higher strength of the particle-particle interaction compared to the particle-pin interaction. As NB/N increases from zero, the defect density of the entire system increases, which would normally lead to more effective pinning, but clumps of species B particles can form and create localized poorly pinned areas, which may decrease the overall pinning effectiveness. Although it is beyond the scope of this paper to address, an open question is to understand exactly why a fraction of Pd=0.2 defects corresponds to the loss of orientational order in two-dimensional systems and whether this fraction Pd=0.2 of defects is universal to all two-dimensional systems at the orientational disordering transition regardless of the form of the particle-particle interactions.

IX.  SUMMARY

To summarize, we have shown that for a binary assembly of repulsively interacting Yukawa particles, there can be an order to disorder dispersity driven transition induced by the addition of a more strongly repulsive species. In the presence of weak quenched disorder, the dispersity driven transition coincides with a peak effect in the depinning force. The depinning force for a mixture of particles can be higher than that for either of the pure species. If the quenched disorder is strong and the pure species sample is already disordered, the addition of a more strongly repulsive species monotonically decreases the depinning force. For a completely ordered system, if the addition of a new species does not induce dislocations, there is no enhancement of the depinning force. We also find that the optimal pinning occurs when the fraction of non-sixfold coordinated particles is around 0.2, which correlates with the loss of orientational order. Our results suggest that a peak effect phenomenon can occur without thermal fluctuations and that the effectiveness of the pinning can be tuned by adjusting the particle mixture.
This work was carried out under the auspices of the NNSA of the U.S. DoE at LANL under Contract No. DE-AC52-06NA25396.

References

[1]
M.-C. Cha and H.A. Fertig, Phys. Rev. Lett. 74, 4867 (1995).
[2]
A.B. Pippard, Philos. Mag. 19, 217 (1969).
[3]
P.H. Kes and C.C. Tsuei, Phys. Rev. B 28, 5126 (1983); A.C. Marley, M.J. Higgins, and S. Bhattacharya, Phys. Rev. Lett. 74, 3029 (1995).
[4]
X.S. Ling, S.R. Park, B.A. McClain, S.M. Choi, D.C. Dender, and J.W. Lynn, Phys. Rev. Lett. 86, 712 (2001).
[5]
A.M. Troyanovski, M. van Hecke, N. Saha, J. Aarts, and P.H. Kes, Phys. Rev. Lett. 89, 147006 (2002).
[6]
C. Tang, X.S. Ling, S. Bhattacharya, and P.M. Chaikin, Europhys. Lett. 35, 597 (1996).
[7]
T. Zykova-Timan, D. Ceresoli, and E. Tosatti, Nature Mater. 6, 230 (2007).
[8]
J.E. Hammerberg, B.L. Holian, T.C. Germann, and R. Ravelo, Metall. Mater. Trans. A 35, 2741 (2004).
[9]
E.M. Forgan, S.J. Levett, P.G. Kealey, R. Cubitt, C.D. Dewhurst, and D. Fort, Phys. Rev. Lett. 88, 167003 (2002).
[10]
S. Bhattacharya and M.J. Higgins, Phys. Rev. Lett. 70, 2617 (1993), M.J. Higgins and S. Bhattacharya, Physica C 257, 232 (1996); C.J. Olson, G.T. Zimányi, A.B. Kolton, and N. Grønbech-Jensen, Phys. Rev. Lett. 85, 5416 (2000).
[11]
W. Henderson, E.Y. Andrei, M.J. Higgins and S. Bhattacharya, Phys. Rev. Lett. 77, 2077 (1996).
[12]
G.I. Menon, Phys. Rev. B 65, 104527 (2002).
[13]
M.R. Sadr-Lahijany, P. Ray, and H.E. Stanley, Phys. Rev. Lett. 79, 3206 (1997).
[14]
M. Li, Phys. Rev. B. 62, 13979 (2000).
[15]
L. Foret and A. Onuki, Phys. Rev. E 74, 031709 (2006).
[16]
C.J. Olson, C. Reichhardt, and S. Bhattacharya, Phys. Rev. B 64, 024518 (2001).
[17]
E.J. Mueller and T.L. Ho, Phys. Rev. Lett. 88, 180403 (2002); K. Kasamatsu, M. Tsubota, and M. Ueda, Phys. Rev. Lett. 91, 150406 (2003).
[18]
E. Fradkin and S.A. Kivelson, Phys. Rev. B 59, 8065 (1999).
[19]
A. Grigorenko, S. Bending, T. Tamegai, S. Ooi, and M. Henini, Nature 414, 728 (2001).
[20]
N. Hoffmann, F. Ebert, C.N. Likos, H. Löwen, and G. Maret, Phys. Rev. Lett. 97, 078301 (2006).
[21]
J. Baumgartl, R.P.A. Dullens, M. Dijkstra, R. Roth, and C. Bechinger, Phys. Rev. Lett. 98, 198303 (2007).
[22]
M.F. Hsu, E.R. Dufresne, and D.A. Weitz, Langmuir 21, 4881 (2005).
[23]
E.R. Dufresne et al., to be published.
[24]
A. Pertsinidis and X.S. Ling, Phys. Rev. Lett., in press (2007).
[25]
C. Reichhardt and C.J. Olson, Phys. Rev. Lett. 89, 078301 (2002); C. Reichhardt and C.J. Olson Reichhardt, Phys. Rev. E 75, 040402(R) (2007).
[26]
WK Qi, Y. Chen, and SM Qin, arXiv:0709.2035.
[27]
K.J. Strandburg, Rev. Mod. Phys. 60, 161 (1988).


File translated from TEX by TTHgold, version 4.00.

Back to Home