Physica C 384, 143 (2003)

Disordering Transitions in Vortex Matter: Peak Effect and Phase Diagram

C. J. Olson1 and C. Reichhardt

Theoretical and Applied Physics Divisions, Los Alamos National Laboratory, Los Alamos, NM 87545.

R. T. Scalettar and G. T. Zimányi

Department of Physics, University of California, Davis, California 95616.

N. Grønbech-Jensen

Department of Applied Science, University of California, Davis, California 95616.

NERSC, Lawrence Berkeley National Laboratory, Berkeley, California 94720.

Using numerical simulations of magnetically interacting vortices in disordered layered superconductors we obtain the static vortex phase diagram as a function of magnetic field and temperature. For increasing field or temperature, we find a transition from ordered straight vortices to disordered decoupled vortices. This transition is associated with a peak effect in the critical current. For samples with increasing disorder strength the field at which the decoupling occurs decreases. Long range, nonlinear interactions in the c-axis are required to observe the effect.
Vortex matter in superconductors exhibits a remarkably rich variety of distinct phases due to the numerous competing interactions [1]. These phases can strongly affect the response of the system, such as the critical current Jc and magnetization. In highly anisotropic superconductors, such as BSCCO, a pronounced fish-tail or peak effect, in which Jc shows a sharp increase, is observed as a function of increasing field [2,3,4,5,6,7,8]. This peak can be interpreted as occurring when the increasing field weakens the interlayer coupling of vortex pancakes due to geometric constraints, and a transition occurs from weakly pinned 3D line vortices to decoupled 2D pancake vortices which can more easily adjust their positions to maximize the pinning [9,10,11]. The peak has also been proposed to arise from plasticity, proliferation of in-plane defects, dynamical effects, or matching effects [12,13,14,15,16,17].
There is mounting experimental evidence that the peak effect is associated with a sharp transition in the vortex lattice from an ordered state to a disordered state. In BSCCO, neutron scattering [18] and muon lifetime [19] experiments provide evidence that a transition from an ordered 3D vortex arrangement to a disordered or decoupled arrangement is associated with the peak effect. Additional evidence from plasma-resonance [20] and magneto-optical studies [21] point to the first-order nature of this transition. In YBCO a rapid increase in Jc as a function of magnetic field is observed and is thought to indicate a transition from an ordered to a disordered state. History and memory effects found near this peak indicate that this transition is also first order [15], suggesting that the physics of the second peak is similar in BSCCO and YBCO. In recent muon-spin measurements in YBCO, the order-disorder transition has been interpreted to be a 3D-2D transition of the vortex lattice [22]. As a function of temperature, in YBCO a peak effect can be observed very near or at the melting line [23,24]. Transformer measurements in this regime provide evidence of vortex cutting in the liquid state, suggesting that the breakdown of the 3D nature of vortex lines is relevant in this case as well.
A key question is what type of sharp transition is responsible for the observed peak in Jc, and whether the mechanism of the peak effect is the same going through the melting line as through the second peak. In this paper we argue that it is a decoupling transition along the vortex line, in the c-direction, which is responsible. We present results from a simulation of magnetically interacting vortices in which we demonstrate a robust peak in Jc as a function of magnetic field and produce an H-T phase diagram in good agreement with experiment.
We consider a 3D layered superconducting model material containing an equal number of pancake vortices in each layer, interacting magnetically. This simulation differs from those used previously by several other groups in that it treats the long-range interactions along the length of the vortex line exactly, and neglects the Josephson coupling, approximating highly anisotropic materials. Previous models have treated the inter-plane interactions as simple (linear) elastic connections [25,26,27,28]. Our approach complements studies of the 3D XY model, which treats the Josephson coupling exactly and neglects the magnetic interactions of the vortices [29,30,31,32,33].
The overdamped equation of motion for vortex i is fi = −∑j=1Nvi Uij,zij)+ fivp + fd + fT = ηvi. We set η = 1. The total number of pancakes per layer is Nv, and ρij and zij are the distance between vortex i and vortex j in cylindrical coordinates. We impose periodic boundary conditions in x and y directions [34] and open boundaries in the z direction. The interaction energy between pancakes is [35,36,37]
Uij,0)=2dϵ0
(1− d


)ln R

ρ
+ d


E1
 ,

Uij,z)=−sm d2ϵ0

λ

exp(−z/λ)ln R

ρ
+E2
 ,
where R is the maximum in-plane distance, E1 = ∫ρ dρ exp(−ρ/λ)/ρ, E2 = ∫ρ dρ exp(−√{z2′2}/λ)/ρ, ϵ0 = Φ02/(4πλ)2, d=0.005λ is the interlayer spacing, and λ is the London penetration depth. We model the pinning as Np short range attractive parabolic traps that are randomly distributed in each layer. The pinning interaction is fivp = −∑k=1Np(fpp)(rirk(p))Θ( (ξp − |rirk(p) |)/λ), where the pin radius is ξp=0.02λ, the pinning force is fp, and f0*0/λ. Thermal fluctuations are represented as Gaussian noise of width fT, with < fTi(t) > =0 and < fTi(t) fTj(t) > = 2ηkB T δij δ(tt). The parameter sm is used to vary the coupling strength between planes, but except where noted it is set to sm=1.0. To vary the applied magnetic field H, we fix the number of vortices in the system and change the system size (vortex density nv). The pin density remains fixed, but in all cases Np > Nv. We consider systems of L=8 to 32 layers containing from 1 to 80 vortex pancakes per layer. The system size ranges from 0.6λ×0.6λ to 141λ×141λ.
Fig1.png
Figure 1: (a) 3D-2D transition as a function of inverse interlayer coupling strength, 1/sm, for a sample in which Nv=80, L=16, nv=0.35, np=1.0, and fp=0.02f0*. Filled circles: fc; open squares: Cz. (b-d) fc (filled circles) and Cz (open squares) as a function of vortex density nv in samples with sm=1.0, L=32, np=40, fp=0.2f0*, and: (b) Nv=1; (c) Nv=4; (d) Nv=80.
The pancakes in our model can behave in two possible ways. They may align along the c-axis into well-defined vortex lines ("3D"). Alternatively, the pancakes may break apart in the c-direction and move independently in each plane ("2D"). We can cross between the two types of behavior in the presence of disorder by varying the inter-plane coupling strength, sm. The vortices are 3D at high coupling, while 2D at low coupling. We find that due to the long range interactions and the nonlinearity, the transition between these two states is sharp and has many first-order characteristics, including strong hysteresis as well as superheating and supercooling effects. We have studied this coupling strength crossover in detail [38], and have shown that it is associated with a large change in the critical current fc, as indicated in Fig. 1(a). To quantify the alignment of the vortices between layers, we also plot the correlation function in the z-direction, Cz = 1 − 〈Θ(a0/2−|ri,Lrj,L+1|)|ri,Lrj,L+1|2/a0〉, where a0 is the vortex lattice constant. When Cz=1.0, the pancakes are aligned into 3D lines, whereas a low value of Cz indicates that the pancakes are decoupled.
It is expected that changing the magnetic field in the system will also cause a decoupling transition due to the fact that the vortices come closer together in plane as the field increases while the spacing between planes remains constant. Thus, at higher fields the relative coupling between planes becomes weaker. Here, we show that the same decoupling transition previously observed as a function of coupling strength also occurs as a function of magnetic field.
In Fig. 1(b-d) we plot fc as a function of vortex density (magnetic field) nv, at a fixed temperature of fT=0.0005 for several different samples containing different numbers of vortices. A clear peak or fish-tail effect is present. In Fig. 1(c), a sample containing Nv=4 is shown. Here, for low fields (nv < 0.1), fc is high and the vortices are uncorrelated in the z direction as well as disordered in plane. At these low fields the vortex-pin interactions dominate. fc drops rapidly with field in this regime due to the increasing in-plane vortex lattice stiffness, which causes the pinning to be less effective [39]. For intermediate fields, 0.1 < nv < 0.2, fc is low and the vortices form an ordered 3D structure as indicated by a near unity correlation, Cz  ∼ 1. The 3D vortex lines in this regime are poorly pinned by the point pinning. At nv = 0.1 there is a sharp decoupling transition as is apparent in the abrupt drop of Cz. Simultaneously, fc increases rapidly to fc = 0.8fp. At higher fields fc gradually decreases due to the increasing in-plane interactions, which continue to stiffen the vortex lattice and thereby weaken the effectiveness of the pinning. We have observed similar peaks in the critical current for samples containing Nv=12, 30, and 80 vortices. Data for the Nv=80 sample is shown in Fig. 1(d). The exact value of nv at which the peak falls scales with the number of vortices in the sample, nv/Nv.
To show that the peak effect observed here arises from the onset of plasticity of the vortices between layers, and not from in-plane plasticity, we conduct simulations of a rigid vortex lattice, represented by a single vortex with periodic boundary conditions. In the Nv=1 simulation in-plane defects are not permitted. Thus, the vortex line can disorder along the c-axis only. The fact that we can observe the second peak in a sample containing only a rigid lattice, as in Fig. 1(b), indicates that the observed peak is not being generated by the proliferation of defects in the plane. This, along with our previous results on the existence of a transition as a function of c-axis coupling strength, provides evidence that it is a change in c-axis correlation that causes striking changes in fc. To show that the long range interactions are responsible for the sharpness of the transition, we have also performed simulations in which the long range interplane interactions are replaced by elastic nearest-neighbor springs [27,28], and observed only a smooth change in depinning force in the absence of the long range interactions [40].
Fig2.png
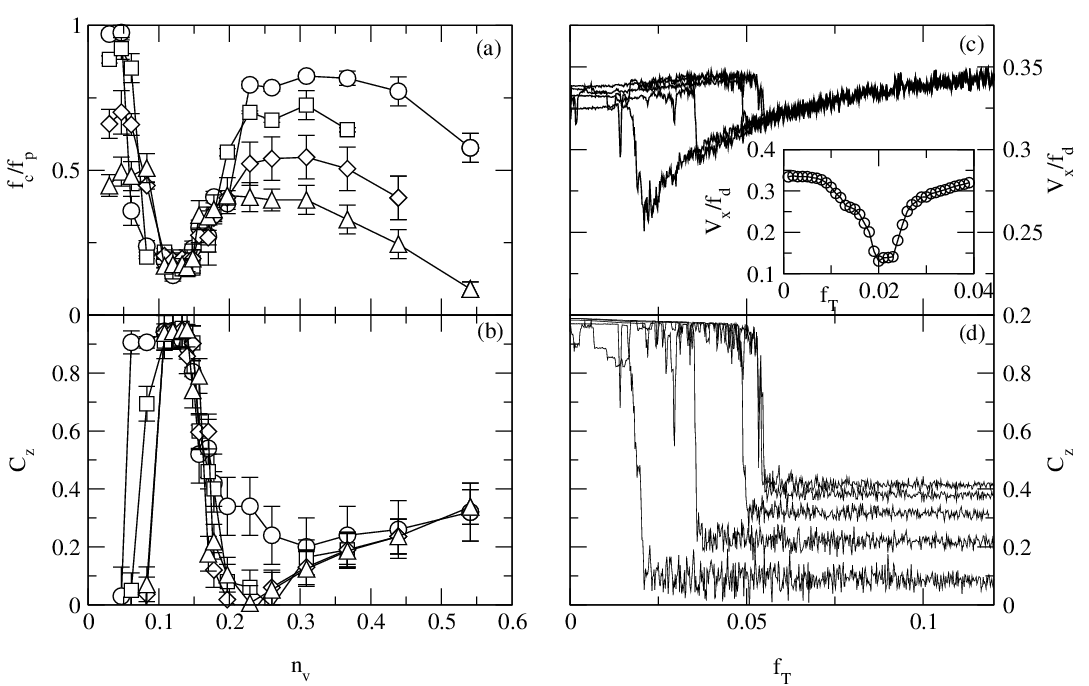
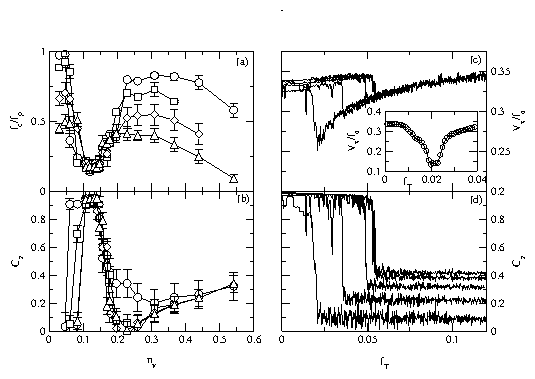
Figure 2: (a) fc versus nv for a sample with Nv=4, L=8, and fp=0.04f0* at temperatures of fT=0.0005 (circles), fT=0.1 (squares), fT=0.2 (diamonds), and fT=0.3 (triangles). (b) Cz corresponding to panel (a). (c) Vx versus fT for the same sample, at a fixed drive of fd=0.1f0*, for fields nv= 0.061, 0.083, 0.108, 0.133, and 0.178. (d) Cz corresponding to panel (c). Inset to (c): Vx versus fT for a sample with Nv=80, nv=2.0, L=16, np=8.0, and fp=0.1f0*.
We can now probe the effect of temperature on the observed transition. As illustrated in Fig. 2(a-b), the field at which the 3D-2D transition occurs remains almost constant with T, in agreement with experiment [41]. fc in the decoupled state drops as the temperature is raised, but the jump in fc persists. In Fig. 2(c) we show the peak effect in the average vortex velocity in the direction of drive, Vx= < vx > , as a function of temperature for fixed values of nv. Starting at fT = 0, we apply a constant driving force of fd = 0.1f0* such that the vortices are moving and ordered. As fT is increased there is a transition to a 2D decoupled vortex arrangement as seen in the drop in Cz. This coincides with a sharp drop in the vortex velocities Vx since the decoupled vortices experience stronger effective pinning. As fT is further increased, the effectiveness of the pinning gradually decreases and Vx gradually increases back to the free flow level. The fc measurements at different temperatures and the resistivity measurements as a function of temperature exhibit the same features as experimental data taken near the peak effect regime.
Fig3.png
Figure 3: Phase diagram for a sample with Nv=1 and L=32. Open circles: decoupling transition for fp=0.0 (clean melting line). Filled squares: decoupling transition for a sample with fp=0.2f0*. Triangles: decoupling for a sample with fp=1.6f0*. Upper inset: Reentrance in the clean melting line is shown on a log-log plot. Lower inset: Phase diagram for a sample with Nv=4 and L=8, with stronger pinning of fp=0.04f0*. Circles: clean melting line. Squares: decoupling transition determined from fc vs. nv data as in Fig. 2(a). Plus signs: decoupling transition determined from Vx vs. fT data as in Fig. 2(c).
Next, we construct a phase diagram for our model in the H-T plane. Since we wish to stress that all qualitative features of the phase diagram result from the c-axis interactions, we consider a system containing a rigid vortex lattice. We first locate the thermal melting line for Nv=1 in the absence of pinning. This is shown as open circles on the phase diagram. We find a reentrance in the melting, shown in more detail in the top inset of Fig. 3, which agrees with theoretical predictions for the melting [42]. The reentrance results when rare thermal fluctuations cause vortex pancakes in the same layer to approach each other closely and nucleate a decoupling transition at low fields. We find no line liquid regime, although a reentrant line liquid may occur in systems where Josephson coupling is dominant. In the presence of pinning, we measure fc as a function of field (as in Fig. 1) at several different temperatures. We plot the 3D-2D transition field as solid squares. As was shown in Fig. 2, the location of the transition is insensitive to temperature at low temperature. We find, however, that the temperature weakens the pinning enough that for fT > 1 a transition in fc is no longer observed. Instead fc is small everywhere. The transition is still observable in Cz, and data taken from Cz is shown above fT=1, indicating that the transition begins to drop in field at higher temperatures until it merges with the clean melting line.
The field at which the second peak occurs is lowered in samples with stronger pinning, as indicated in Fig. 3 where the second peak line for a sample with Nv=1 and stronger pinning is plotted. This is consistent with experiments in which the peak shifts to lower fields in samples with artificially increased pinning strength.
We have also constructed a phase diagram for a sample with Nv=4 and much stronger pinning, shown in the lower inset of Fig. 3. In the disordered system the 3D-2D transition is relatively flat in fT for fT < 0.3 and then begins to turn down as the clean melting line is approached. We also observe that the clean system shows a reentrant behavior for low fields due to the reduced vortex interactions. In the disordered sample this reentrant line is pushed up in field. We see reentrance of the second peak line in good agreement with recent measurements [41]. In still larger systems containing Nv=80 vortices, we have taken two slices across the phase diagram as a function of field and temperature, shown in Fig. 1(d) and the inset of Fig. 2(c), respectively, and find decoupling transitions consistent with those shown above.
In conclusion, using numerical simulations of magnetically interacting vortex pancakes in three dimensional layered superconductors, we have obtained static vortex phase diagrams as a function of magnetic field and temperature. We have demonstrated a unique relationship between c-axis vortex correlations and the critical current Jc. Specifically, we have identified c-axis correlation transitions to be responsible for the peaks in Jc as well as the fish-tail effect in magnetization measurements. Our simulations of rigid in-plane vortex lattices, which also exhibit the peak and fish-tail phenomena, support the claim that changes in c-axis (as opposed to in-plane) correlations are responsible for the observed anomalies. We only observe the critical current peak when long-range interactions are present, again suggesting that the peak and fish-tail effect are directly related to the nonlinear and nonlocal nature of the inter-plane vortex interactions that lead to decoupling transitions.
We acknowledge useful discussions with D. Domínguez, A. Kolton, A. Koshelev, W.K. Kwok, V. Vinokur, and E. Zeldov. This work was supported by the US Department of Energy under contract W-7405-ENG-36, by CLC and CULAR (LANL/UC), by NSF-DMR-9985978, and by the Director, Office of Adv. Scientific Comp. Res., Div. of Math., Information and Comp. Sciences, U.S. DoE contract DE-AC03-76SF00098.

References

[1]
G. Blatter, M.V. Feigel'man, V.B. Geshkenbein, A.I. Larkin, and V.M. Vinokur, Rev. Mod. Phys. 66 (1994) 1125.
[2]
T. Tamegai, Y. Iye, I. Oguro, and K. Kishio, Physica C 213 (1993) 33.
[3]
G. Yang, P. Shang, S.D. Sutton, I.P. Jones, J.S. Abell, and C.E. Gough, Phys. Rev. B 48 (1993) 4054.
[4]
Y. Yeshurun, N. Bontemps, L. Burlachkov, and A. Kapitulnik, Phys. Rev. B 49 (1994) 1548.
[5]
E. Zeldov, D. Majer, M. Konczykowski, V.B. Geshkenbein, V.M. Vinokur, and H. Shtrikman, Nature 375 (1995) 373.
[6]
E. Zeldov, D. Majer, M. Konczykowski, A.I. Larkin, V.M. Vinokur, V.B. Geshkenbein, N. Chikumoto, and H. Shtrikman, Europhys. Lett. 30 (1995) 367.
[7]
B. Khaykovich, E. Zeldov, D. Majer, T.W. Li, P.H. Kes, and M. Konczykowski, Phys. Rev. Lett. 76 (1996) 2555.
[8]
B. Khaykovich, M. Konczykowski, E. Zeldov, R.A. Doyle, D. Majer, P.H. Kes, and T.W. Li, Phys. Rev. B 56 (1997) R517.
[9]
L.I. Glazman and A.E. Koshelev, Phys. Rev. B 43 (1991) 2835.
[10]
L.L. Daemen, L.N. Bulaevskii, M.P. Maley, and J.Y. Coulter, Phys. Rev. Lett. 70 (1993) 1167.
[11]
A.E. Koshelev and P.H. Kes, Phys. Rev. B 48 (1993) 6539.
[12]
L. Krusin-Elbaum, L. Civale, V.M. Vinokur, and F. Holtzberg, Phys. Rev. Lett. 69 (1992) 2280.
[13]
Y. Yeshurun, N. Bontemps, L. Burlachkov, and A. Kapitulnik, Phys. Rev. B 49 (1994) 1548.
[14]
T. Giamarchi and P. Le Doussal, Phys. Rev. B 55 (1997) 6577.
[15]
S. Kokkaliaris, P.A.J. de Groot, S.N. Gordeev, A.A. Zhukov, R. Gagnon, and L. Taillefer, Phys. Rev. Lett. 82 (1999) 5116.
[16]
S. Bhattacharya and M.J. Higgins, Phys. Rev. Lett. 70 (1993) 2617.
[17]
M.J. Higgins and S. Bhattacharya, Physica C 257 (1996) 232.
[18]
R. Cubitt, E.M. Forgan, G. Yang, S.L. Lee, D.McK. Paul, H.A. Mook, M. Yethiraj, P.H. Kes, T.W. Li, A.A. Menovsky, Z. Tarnawski, and K. Mortensen, Nature 365 (1993) 407.
[19]
S.L. Lee, P. Zimmermann, H. Keller, M. Warden, R. Schauwecker, D. Zech, R. Cubitt, E.M. Forgan, P.H. Kes, T.W. Li, A.A. Menovsky, and Z. Tarnawski, Phys. Rev. Lett. 71 (1993) 3862.
[20]
M.B. Gaifullin, Y. Matsuda, N. Chikumoto, J. Shimoyama, and K. Kishio, Phys. Rev. Lett. 84 (2000) 2945.
[21]
C.J. van der Beek, S. Colson, M.V. Indenbom, and M. Konczykowski, Phys. Rev. Lett. 84 (2000) 4196.
[22]
J.E. Sonier, J.H. Brewer, R.F. Kiell, D.A. Bonn, J. Chakhalian, S.R. Dunsiger, W.N. Hardy, R. Liang, W.A. MacFarlane, R.I. Miller, D.R. Noakes, T.M. Riseman, and C.E. Stronach, Phys. Rev. B 61 (2000) R890.
[23]
W.K. Kwok, J.A. Fendrich, C.J. van der Beek, and G.W. Crabtree, Phys. Rev. Lett. 73 (1994) 2614.
[24]
Jing Shi, X.S. Ling, R. Liang, D.A. Bonn, and W.N. Hardy, Phys. Rev. B 60 (1999) R12593.
[25]
S. Ryu, A. Kapitulnik, and S. Doniach, Phys. Rev. Lett. 77 (1996) 2300.
[26]
N.K. Wilkin and H.J. Jensen, Phys. Rev. Lett. 79 (1997) 4254.
[27]
A. van Otterlo, R.T. Scalettar, and G.T. Zimányi, Phys. Rev. Lett. 81 (1998) 1497.
[28]
A. van Otterlo, R.T. Scalettar, G.T. Zimányi, R. Olsson, A. Petrean, W. Kwok, and V. Vinokur, Phys. Rev. Lett. 84 (2000) 2493.
[29]
Y.-H. Li and S. Teitel, Phys. Rev. B 49 (1994) 4136.
[30]
P. Olsson and S. Teitel, Phys. Rev. Lett. 87 (2001) 137001.
[31]
X. Hu, S. Miyashita, and M. Tachiki, Phys. Rev. B 58 (1998) 3438.
[32]
Y. Nonomura and X. Hu, Phys. Rev. Lett. 86 (2001) 5140.
[33]
D. Domínguez, N. Grønbech-Jensen, and A.R. Bishop, Phys. Rev. Lett. 78 (1997) 2644.
[34]
N. Grønbech-Jensen, Comp. Phys. Comm. 119 (1999) 115.
[35]
J.R. Clem, Phys. Rev. B 43 (1991) 7837.
[36]
E.H. Brandt, Rep. Prog. Phys. 58 (1995) 1465.
[37]
D. Reefman and H.B. Brown, Phys. Rev. B 48 (1993) 3567.
[38]
C.J. Olson, G.T. Zimányi, A.B. Kolton, and N. Grønbech-Jensen, Phys. Rev. Lett. 85 (2000) 5416.
[39]
C.J. Olson, C. Reichhardt, and F. Nori, Phys. Rev. Lett. 81 (1998) 3757.
[40]
Indeed, we have recently found that the peak reported in Ref. [28] is not robust to new and more extensive simulations which use a larger number of disorder realizations.
[41]
Y. Paltiel, E. Zeldov, Y. Myasoedov, M.L. Rappaport, G. Jung, S. Bhattacharya, M.J. Higgins, Z.L. Xiao, E.Y. Andrei, P.L. Gammel, and D.J. Bishop, Phys. Rev. Lett. 85 (2000) 3712.
[42]
D.R. Nelson and H.S. Seung, Phys. Rev. B 39 (1989) 9153.

Footnotes:

1Corresponding author. Address: T-12, MS B268, Los Alamos National Laboratory, Los Alamos, NM 87545. Telephone: (505) 665-1134. Fax: (505) 665-3909. E-mail: cjrx@lanl.gov


File translated from TEX by TTHgold, version 4.00.

Back to Home