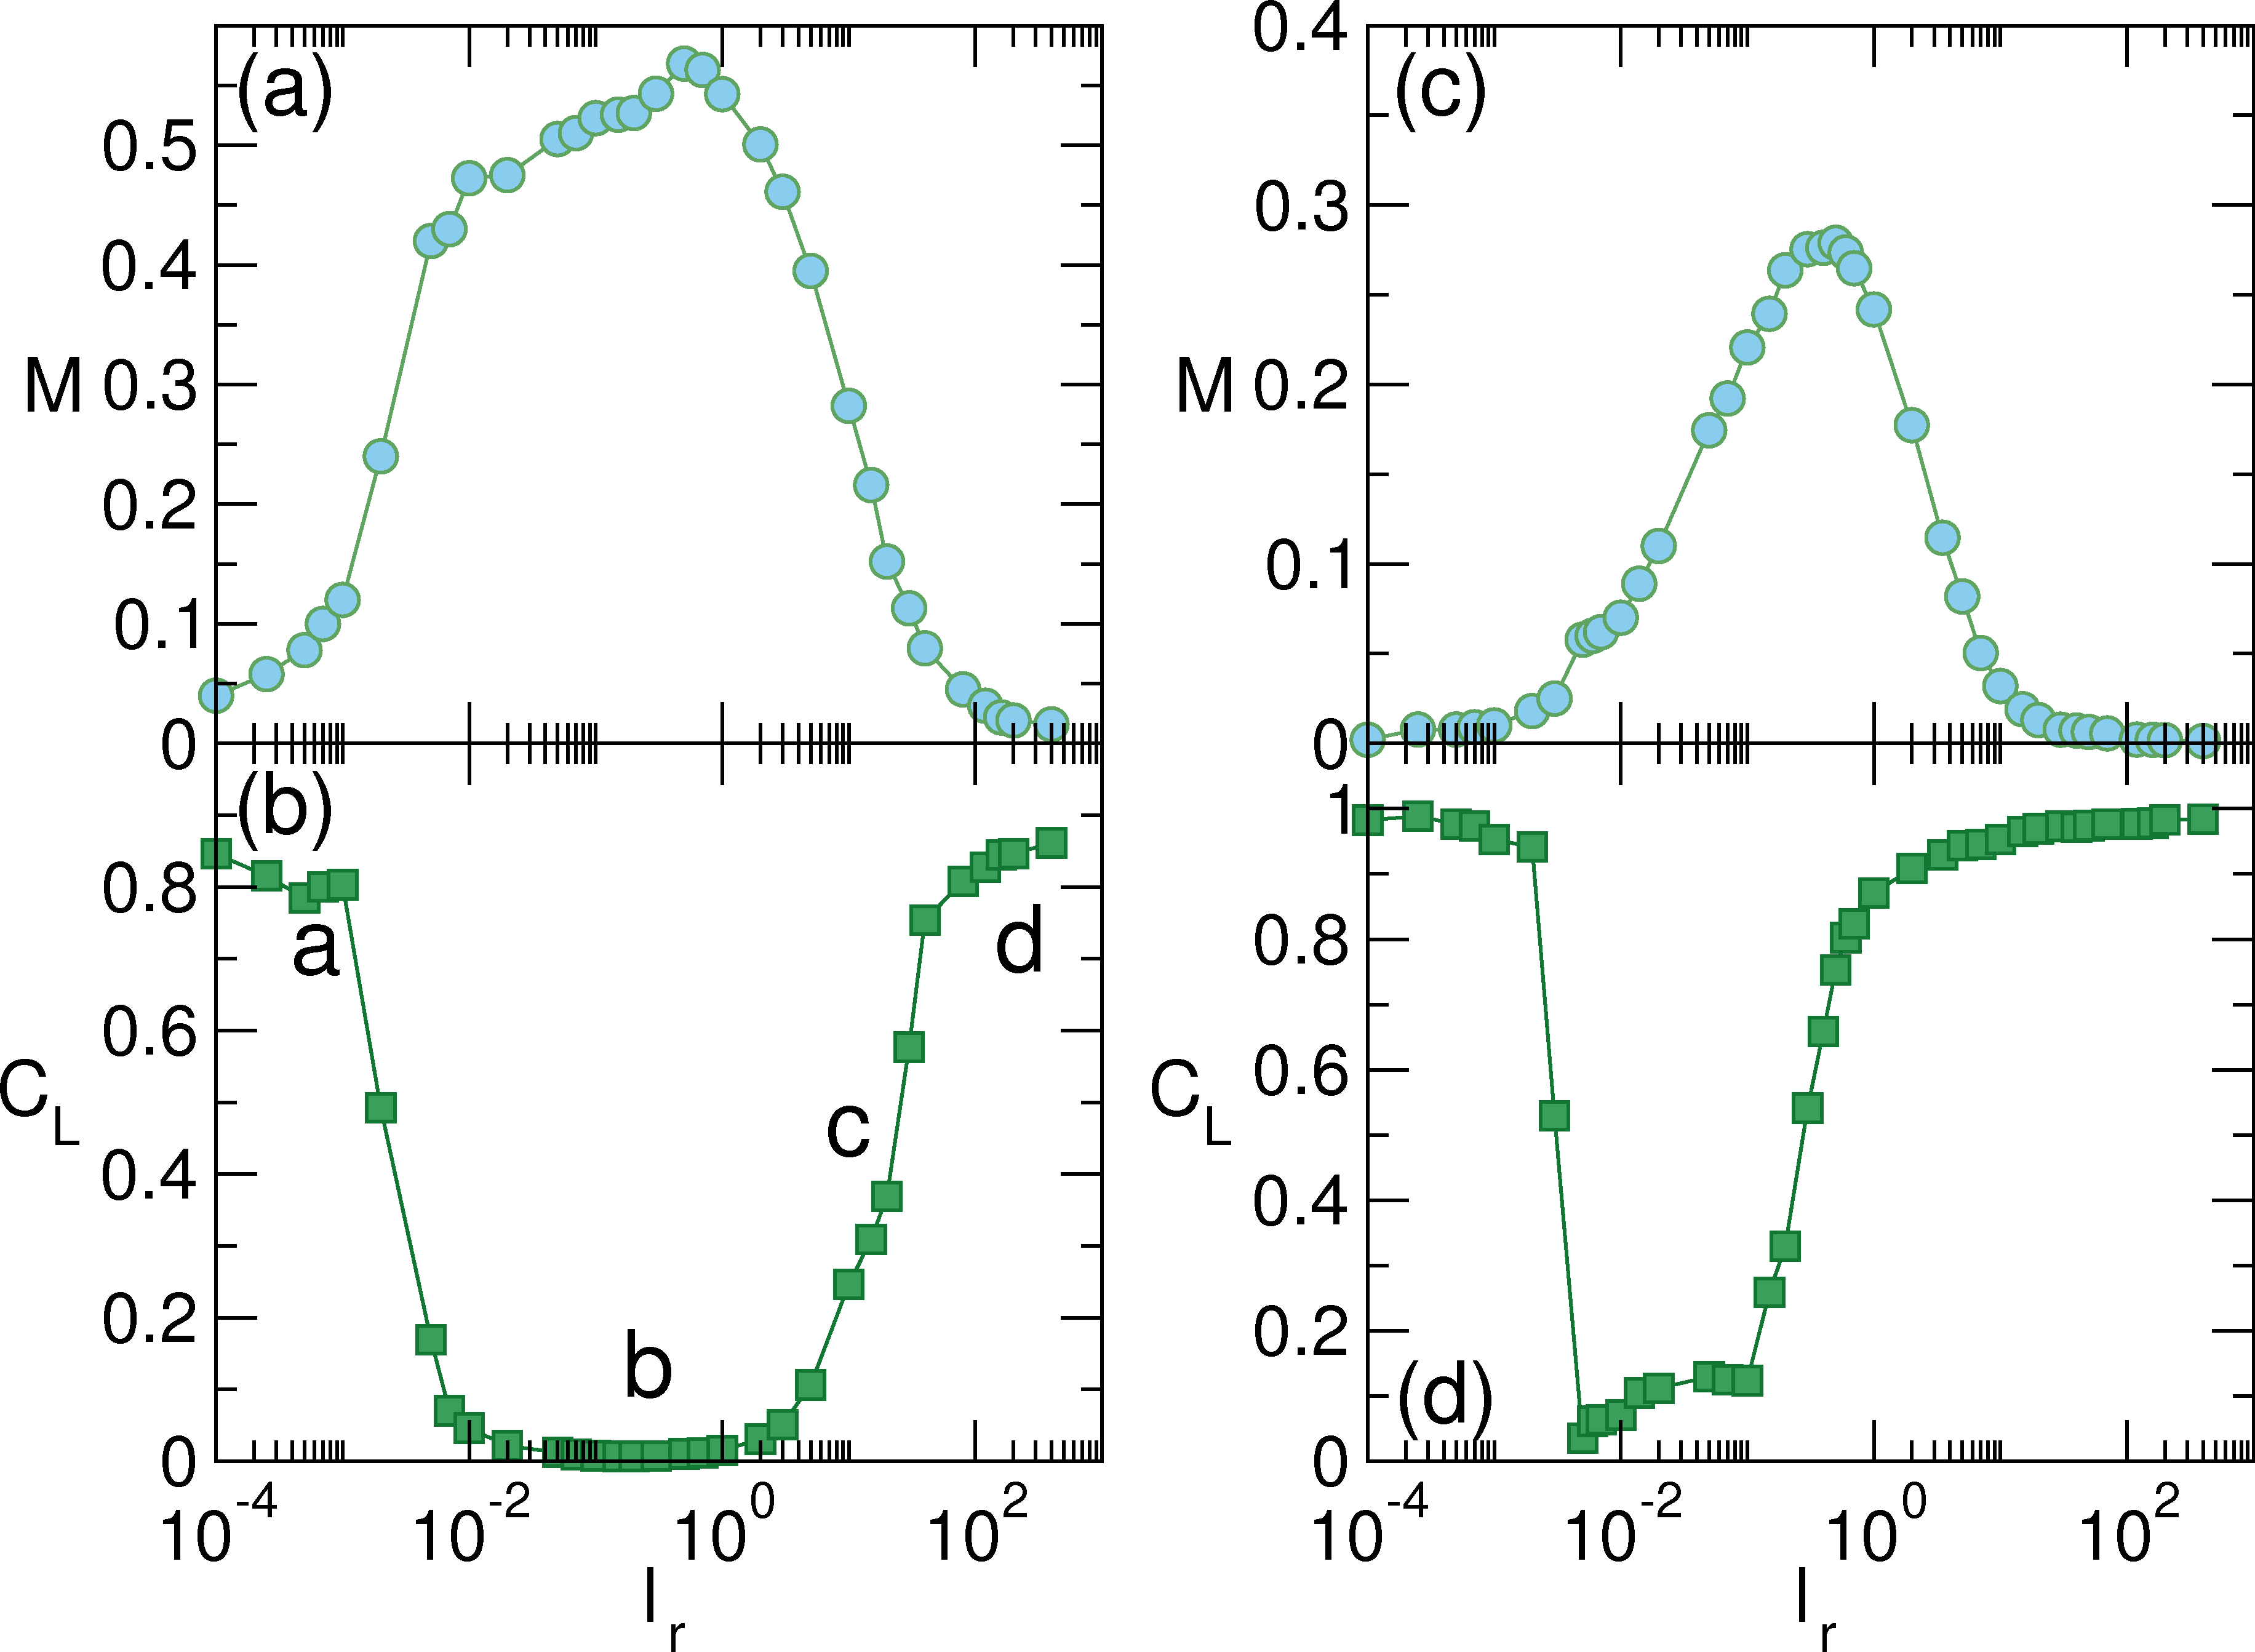
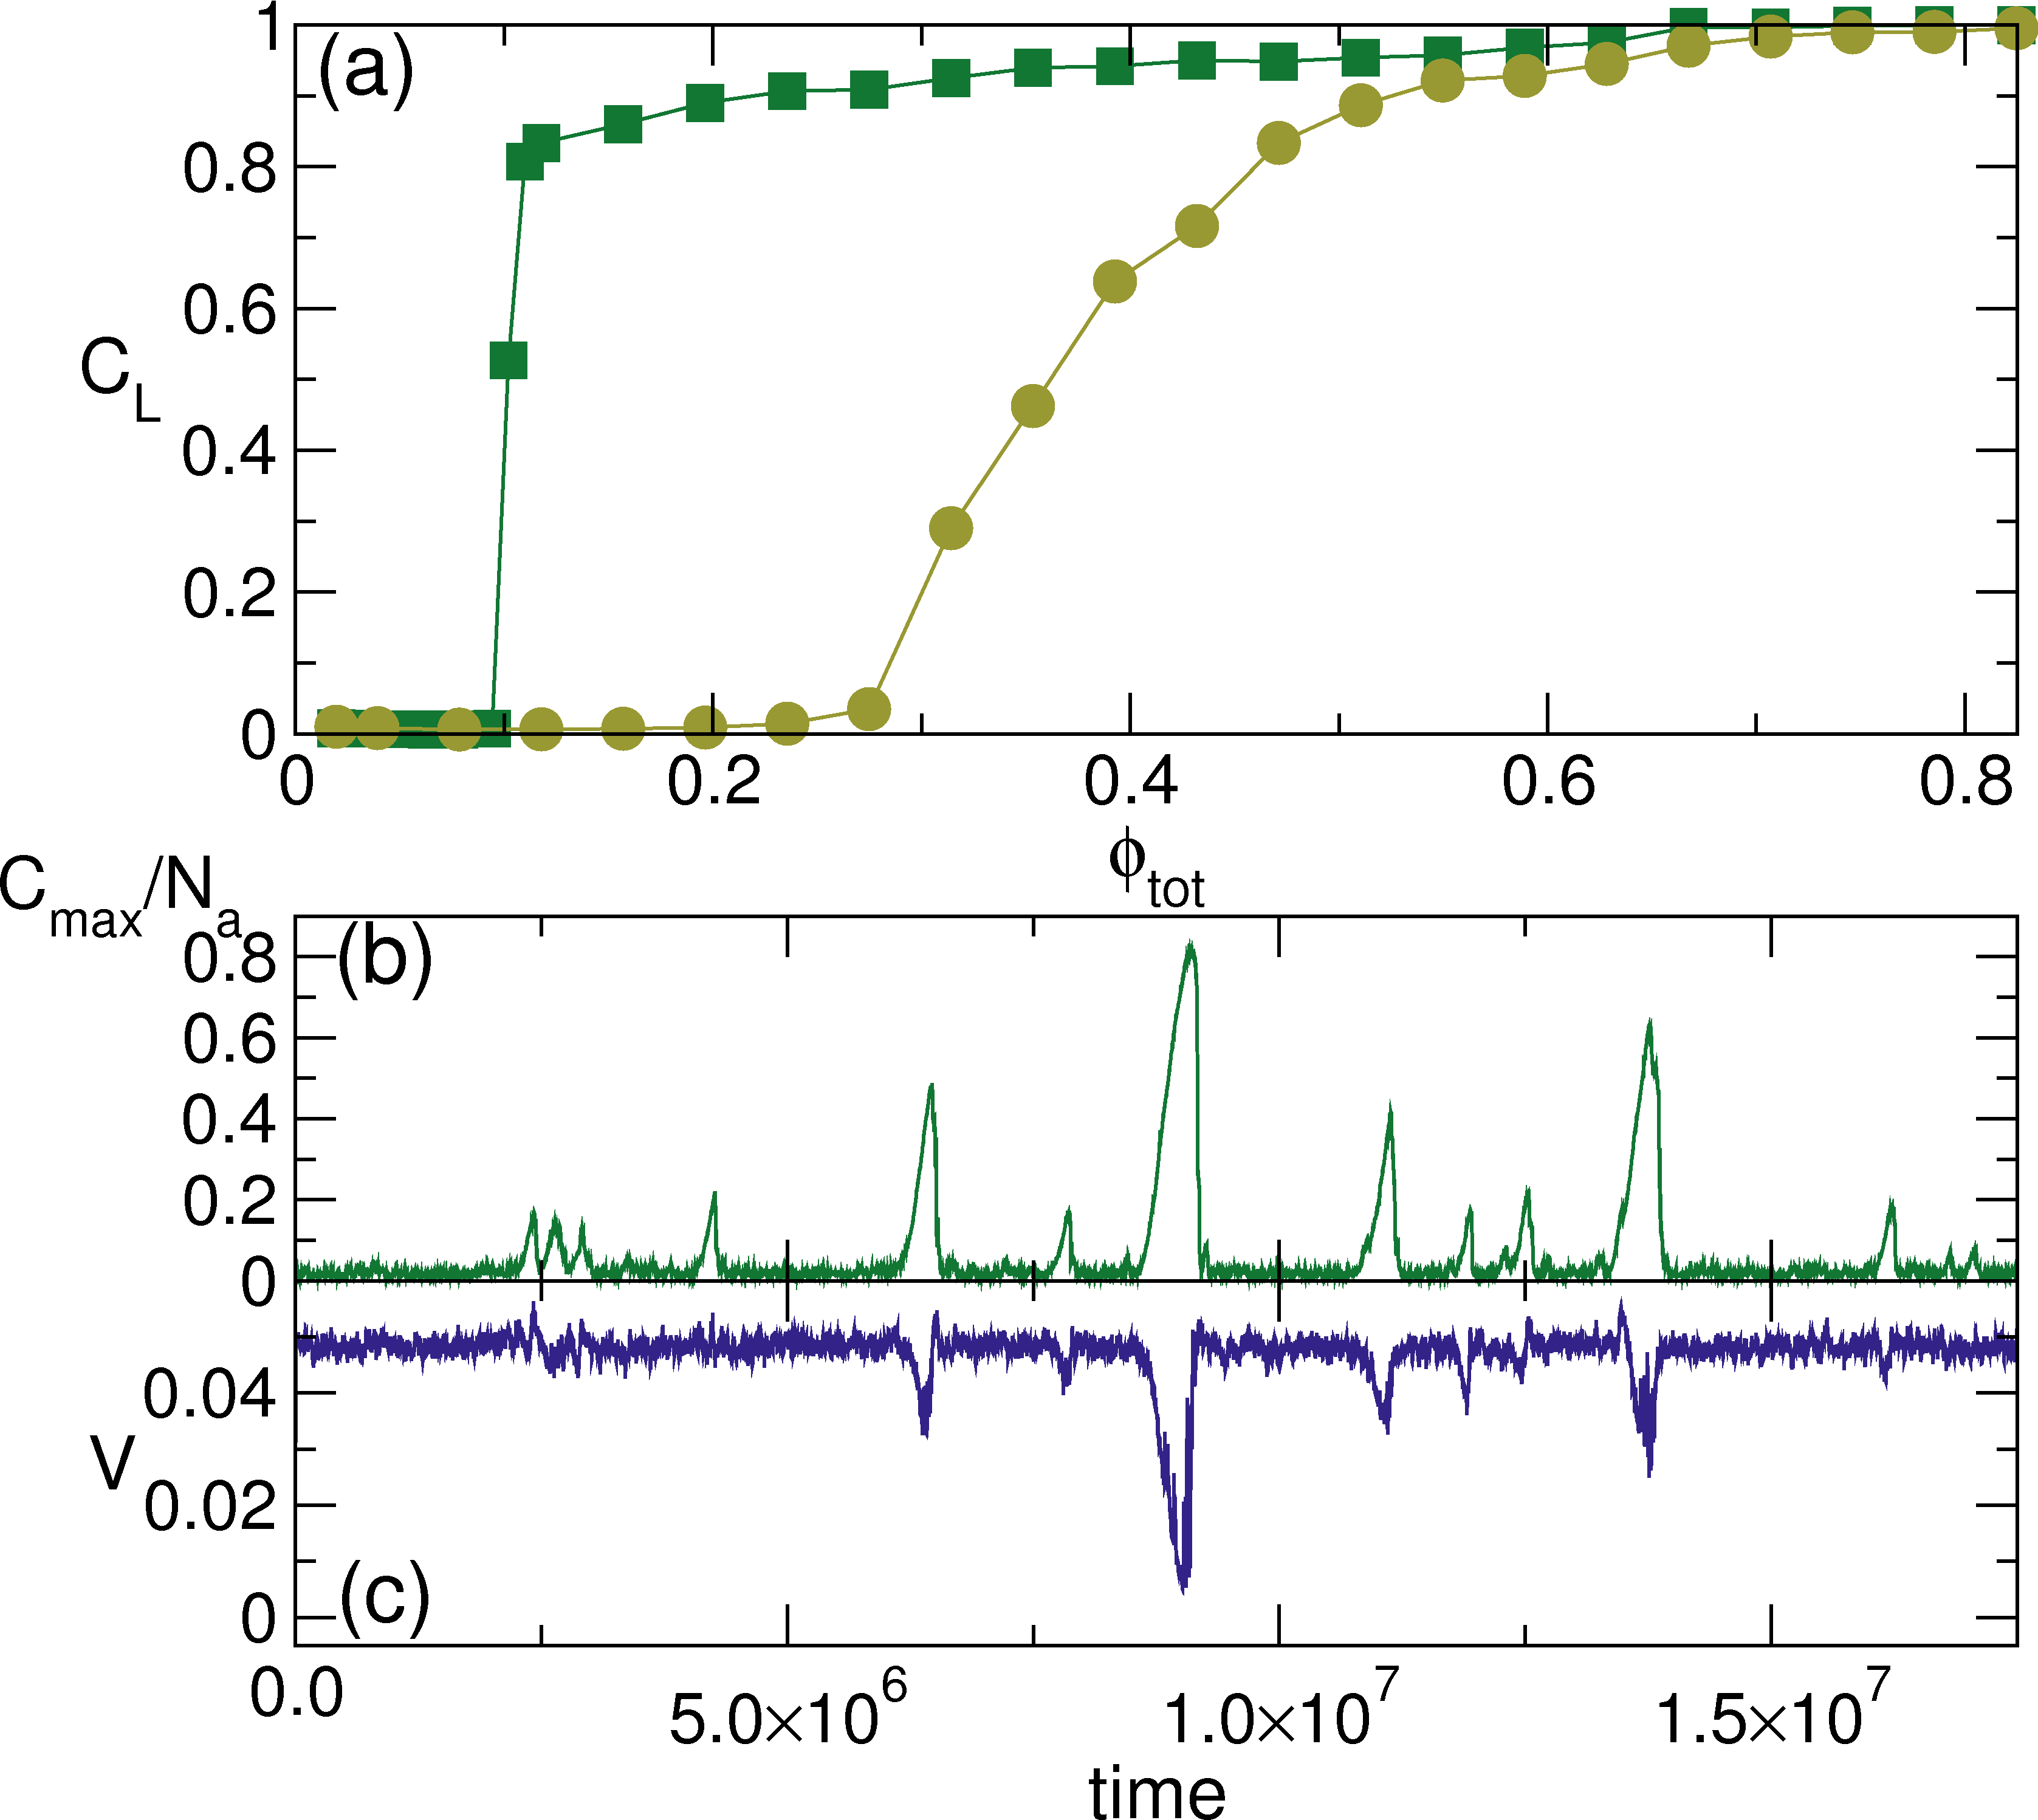
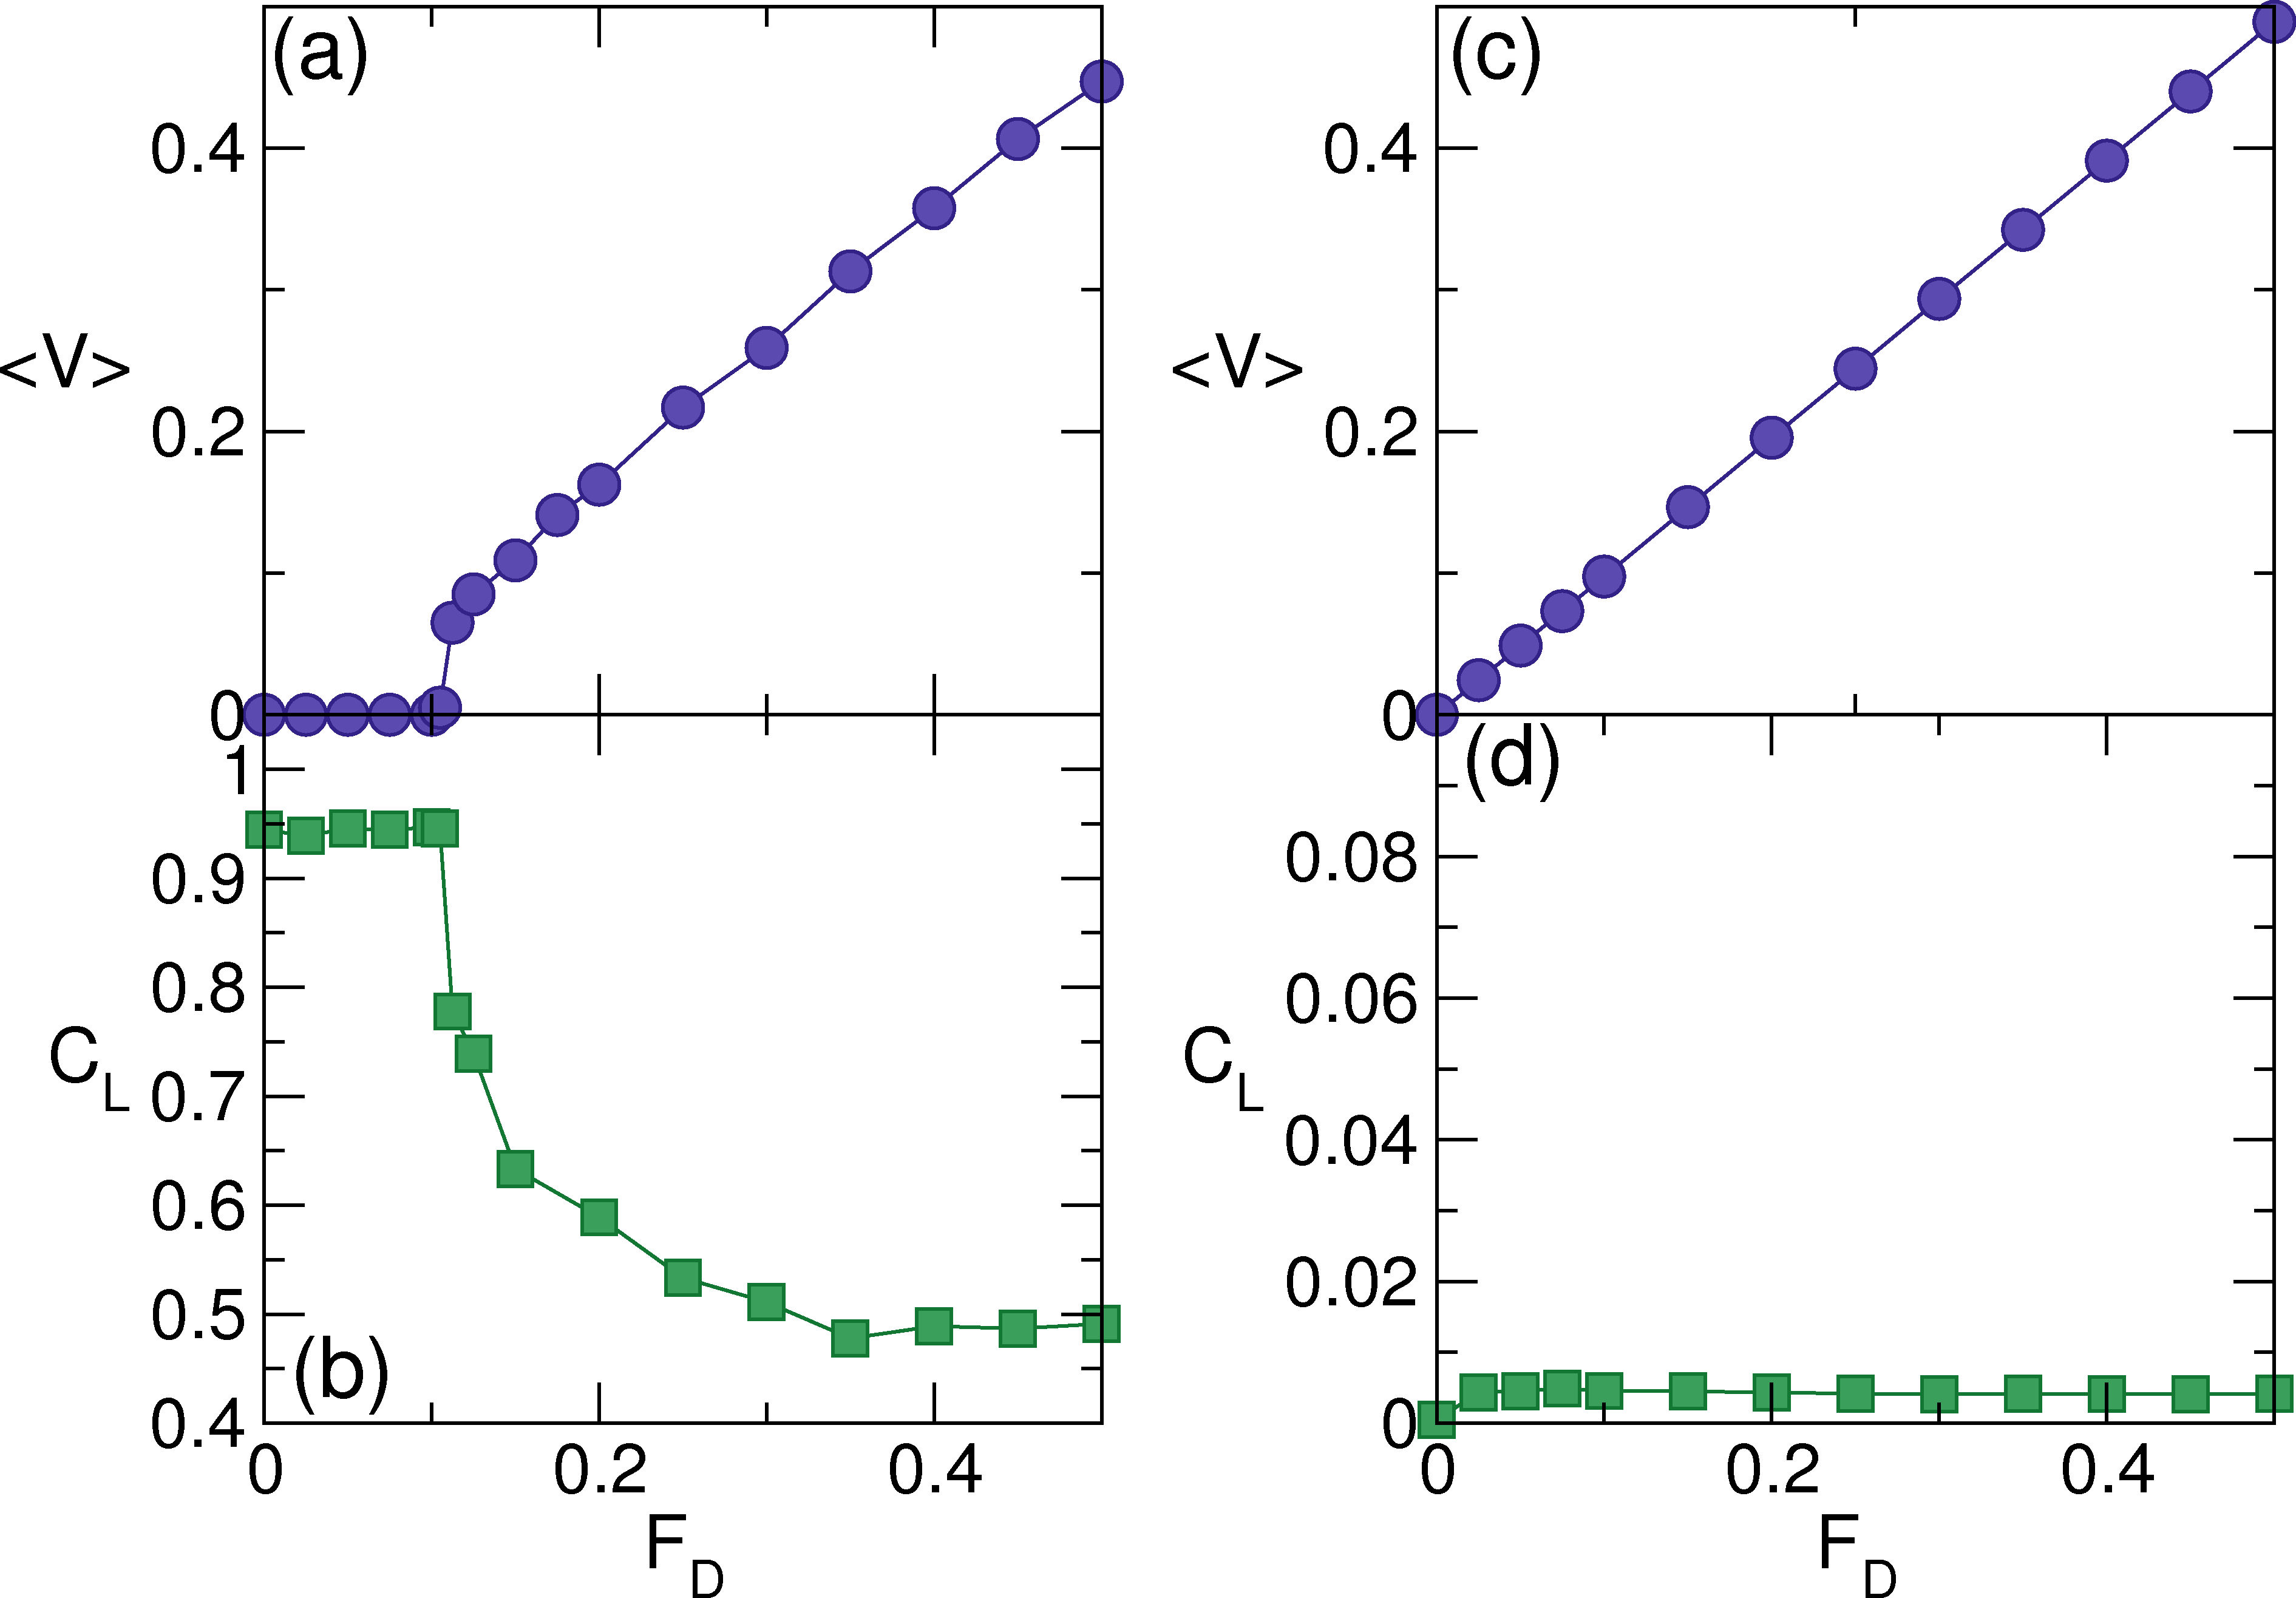
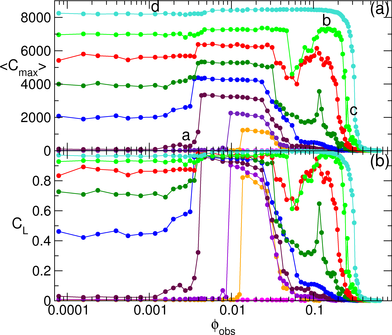
 Figure 7:
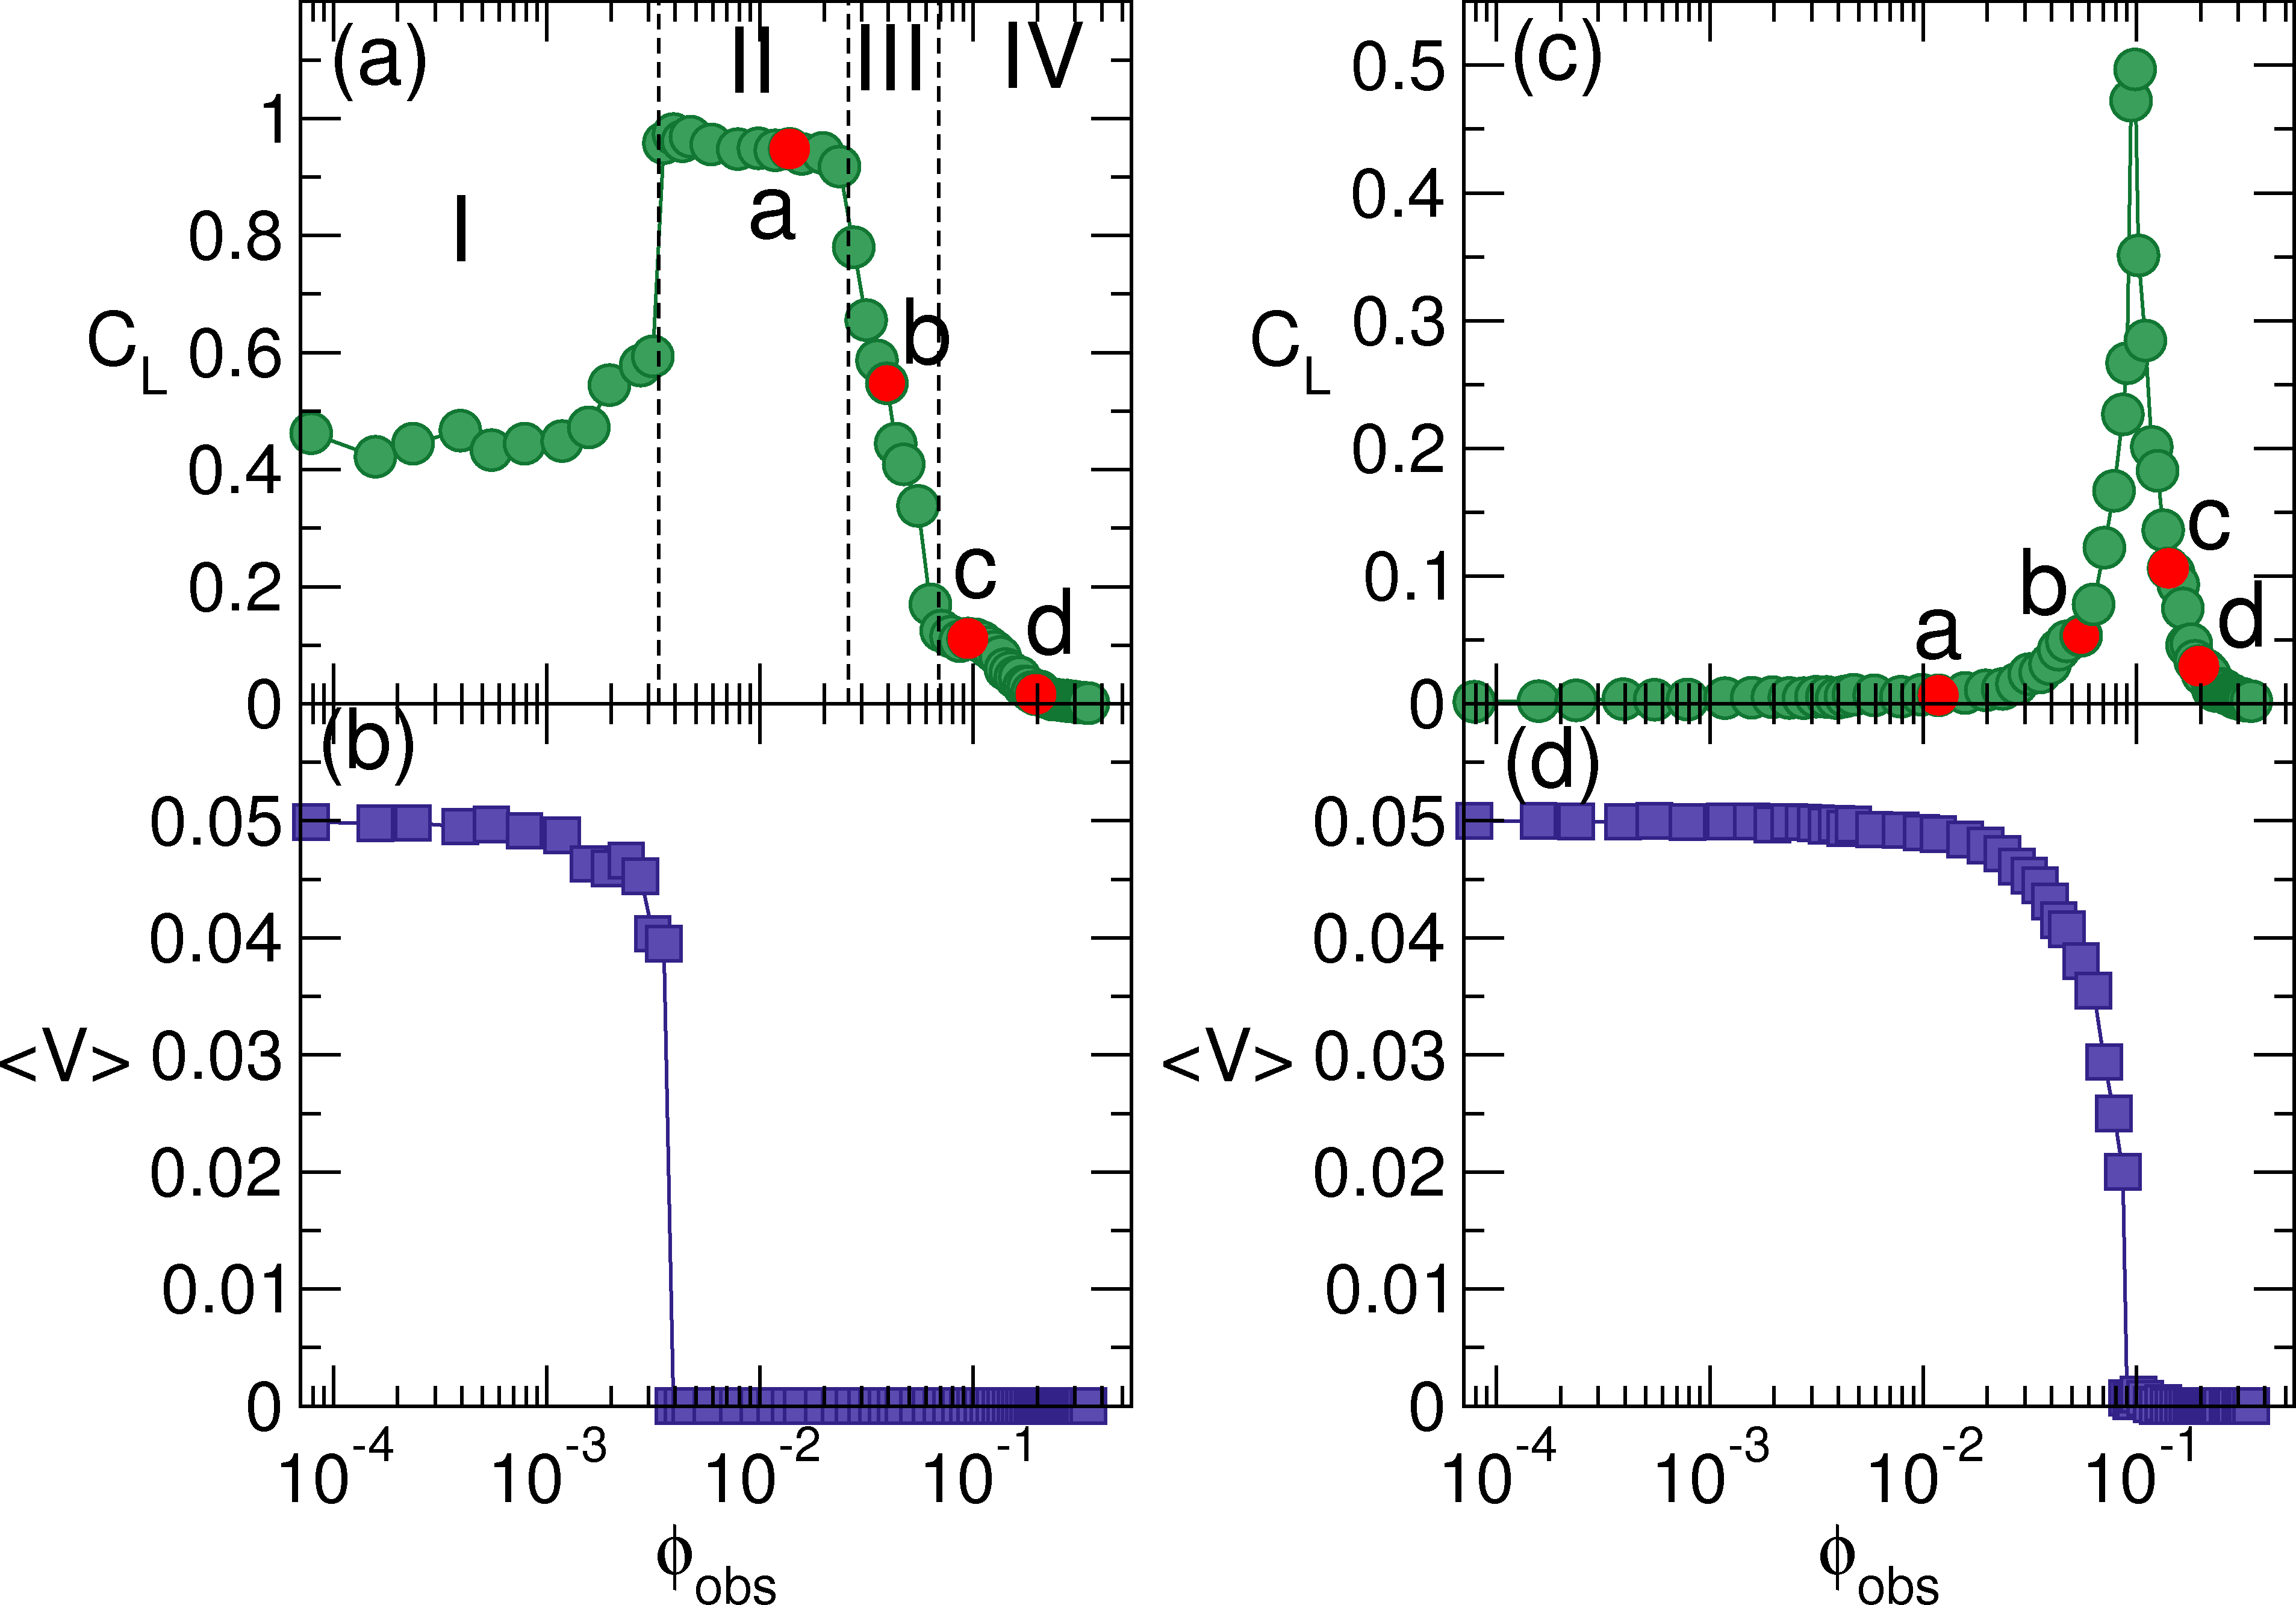
(a) 〈Cmax〉, the average number of disks in the largest cluster,
vs ϕobs at FD=0.05 for
ϕtot=0.668 (Ntot = 8500, turquoise),
0.589 (7500, light green), 0.511 (6500, red), 0.432 (5500, dark green),
0.354 (4500, blue), 0.275 (3500, maroon), 0.196 (2500, violet),
0.118 (1500, orange), and 0.0786 (1000, magenta).
(b) The corresponding CL vs ϕobs curves.
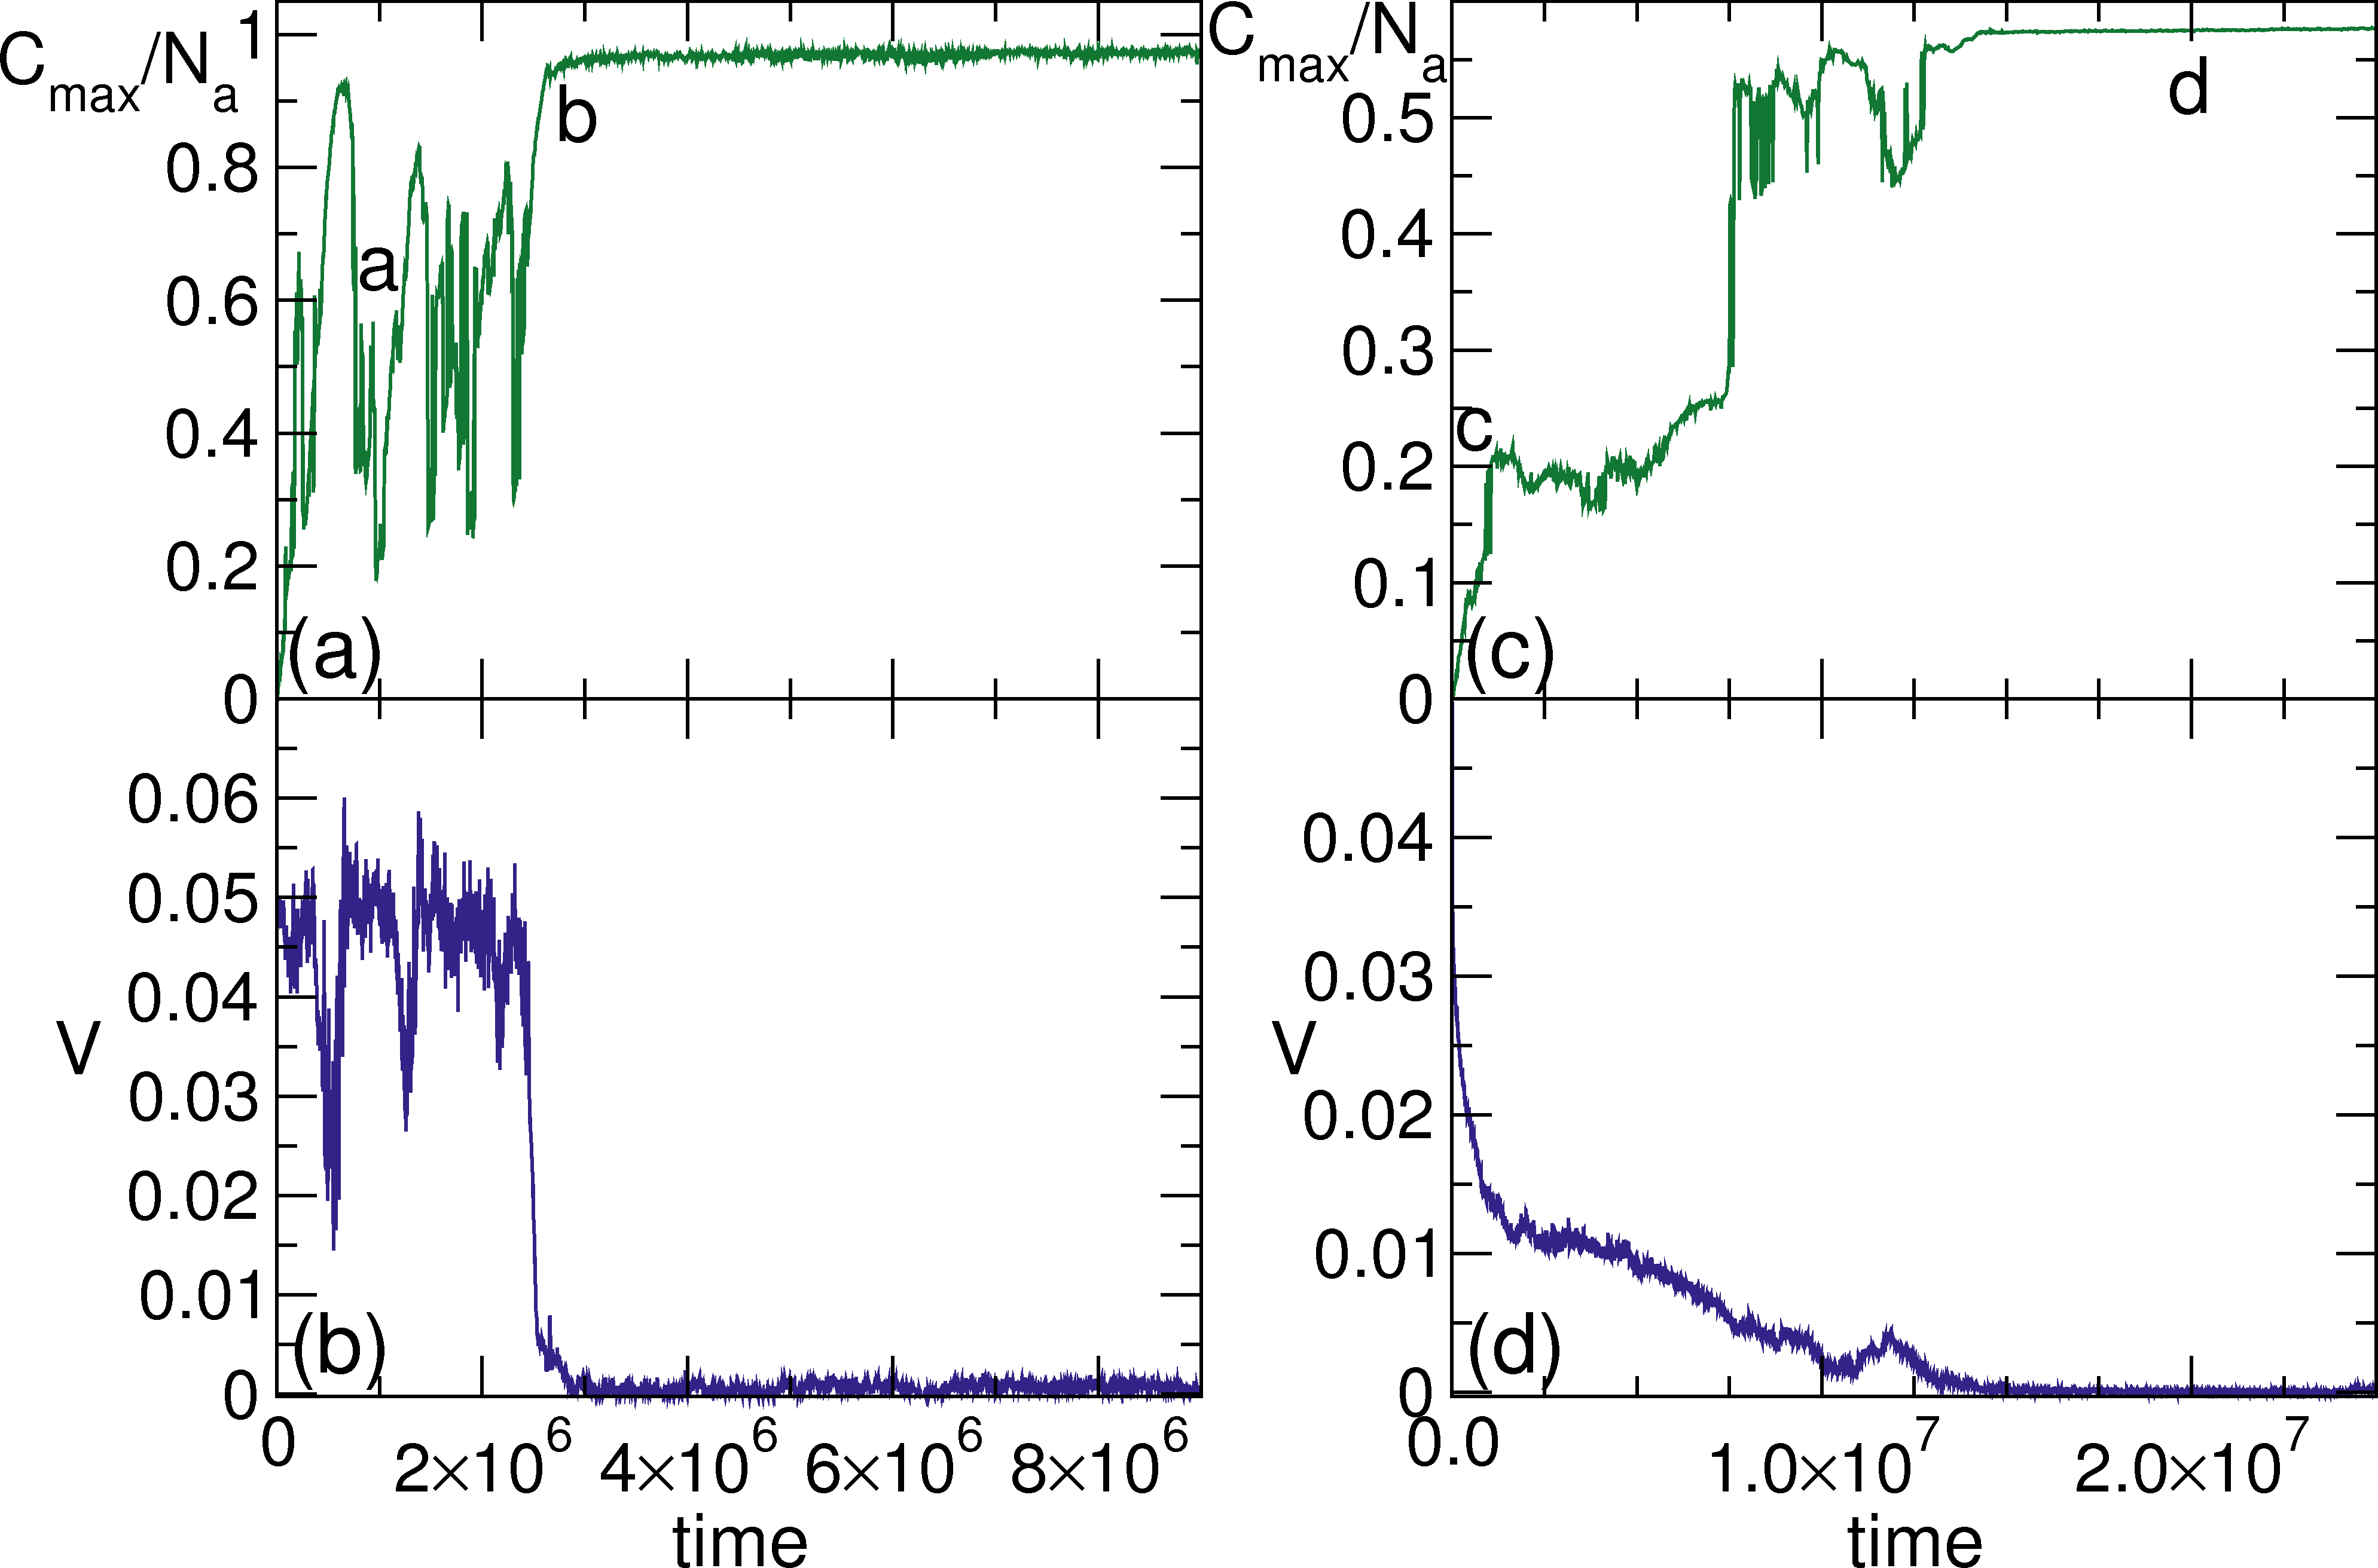
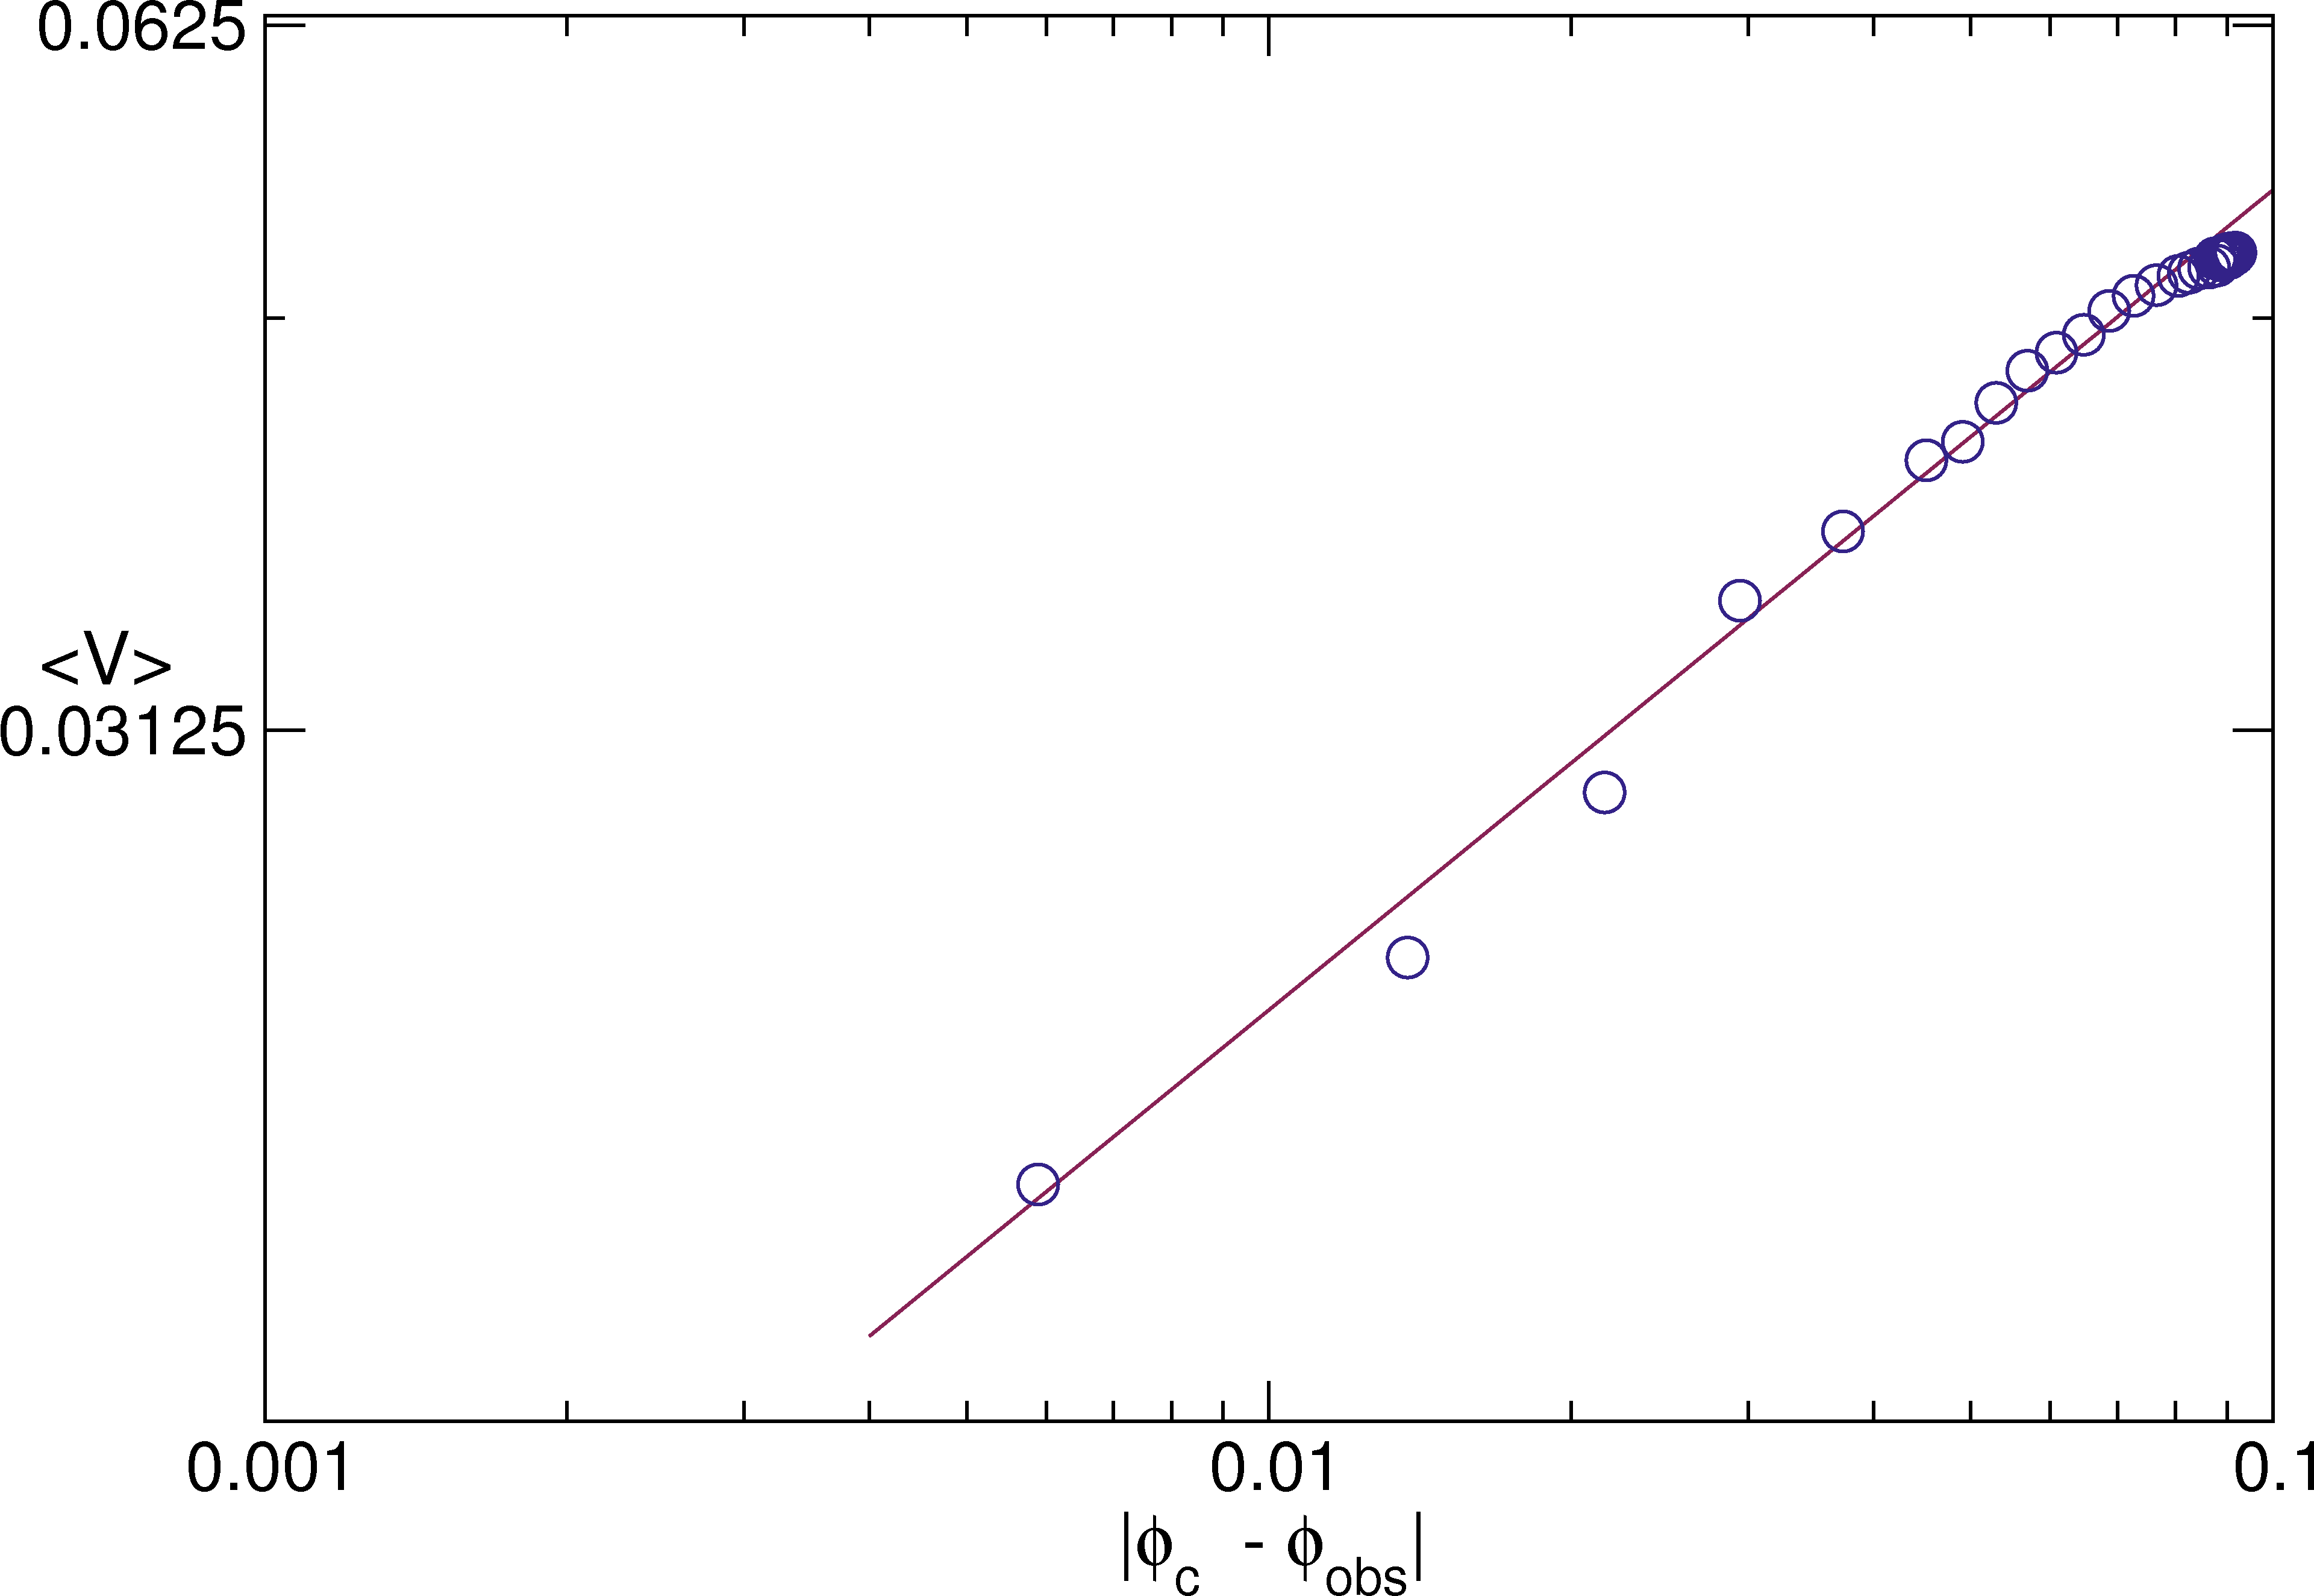
The I-II transition is associated with a jump or increase
in 〈Cmax〉 and CL,
while at large ϕobs, the system enters a pinned disordered phase as
indicated by the drop in Cmax and CL to nearly zero.
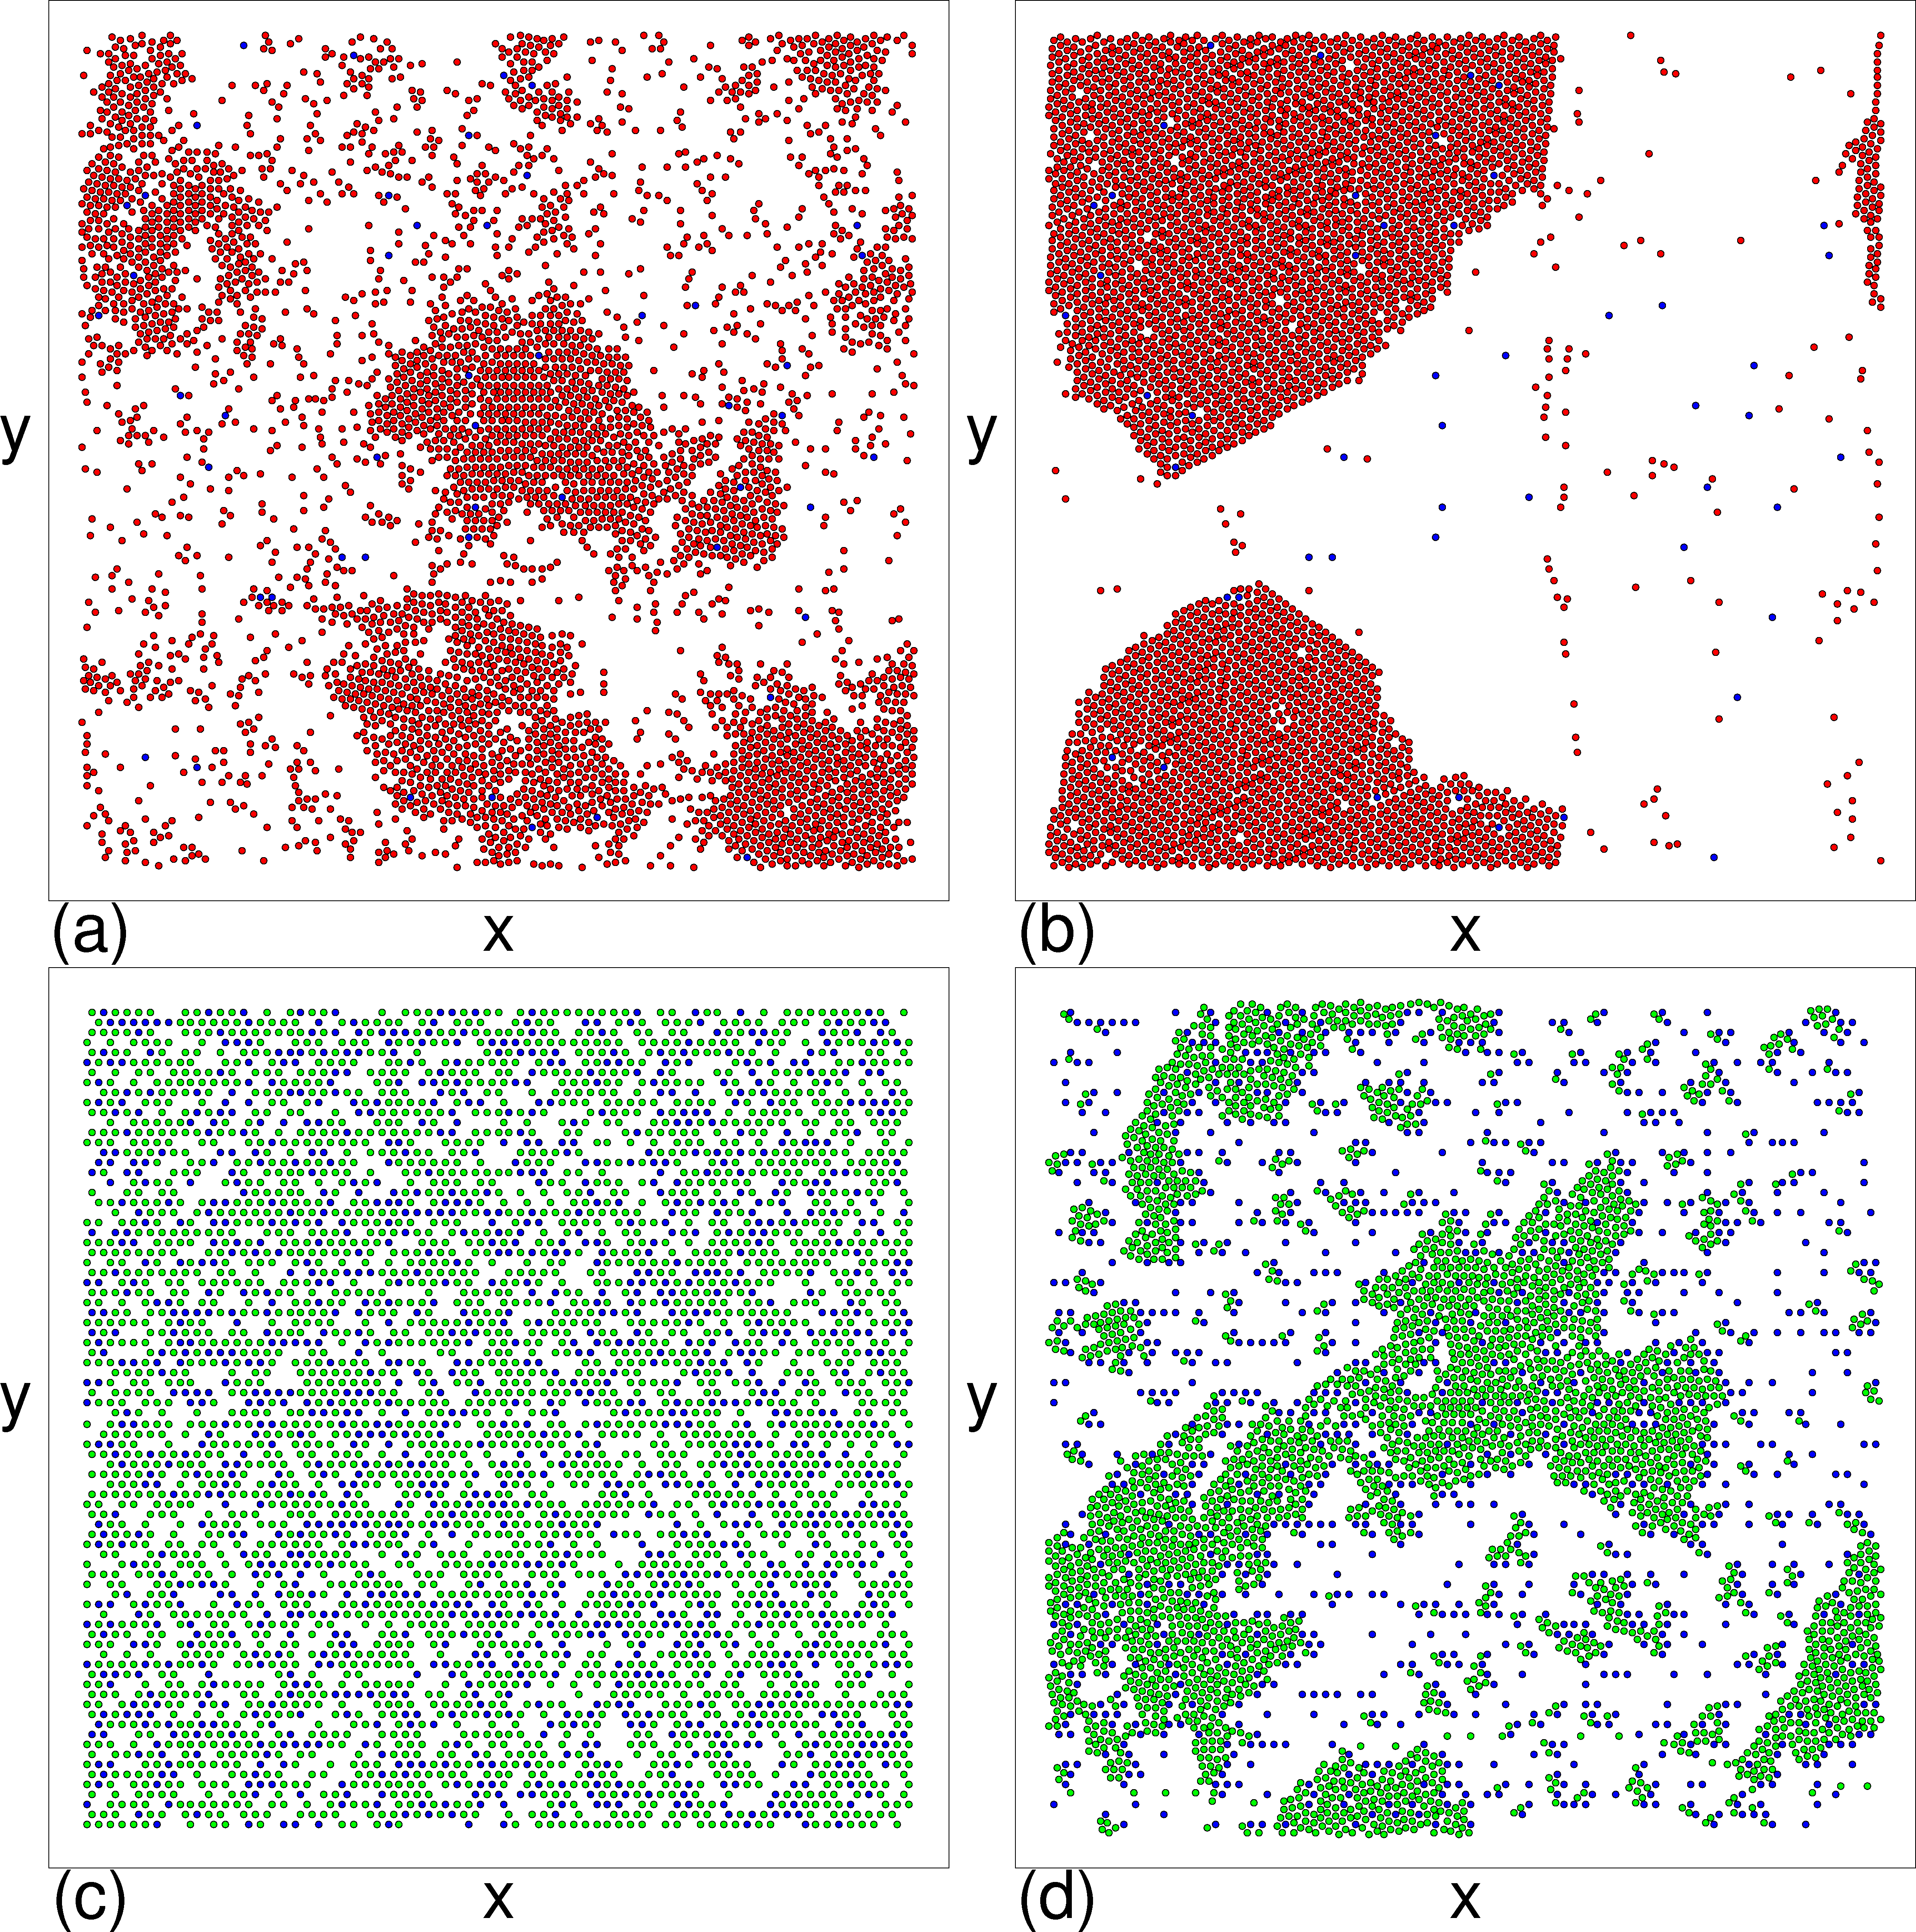
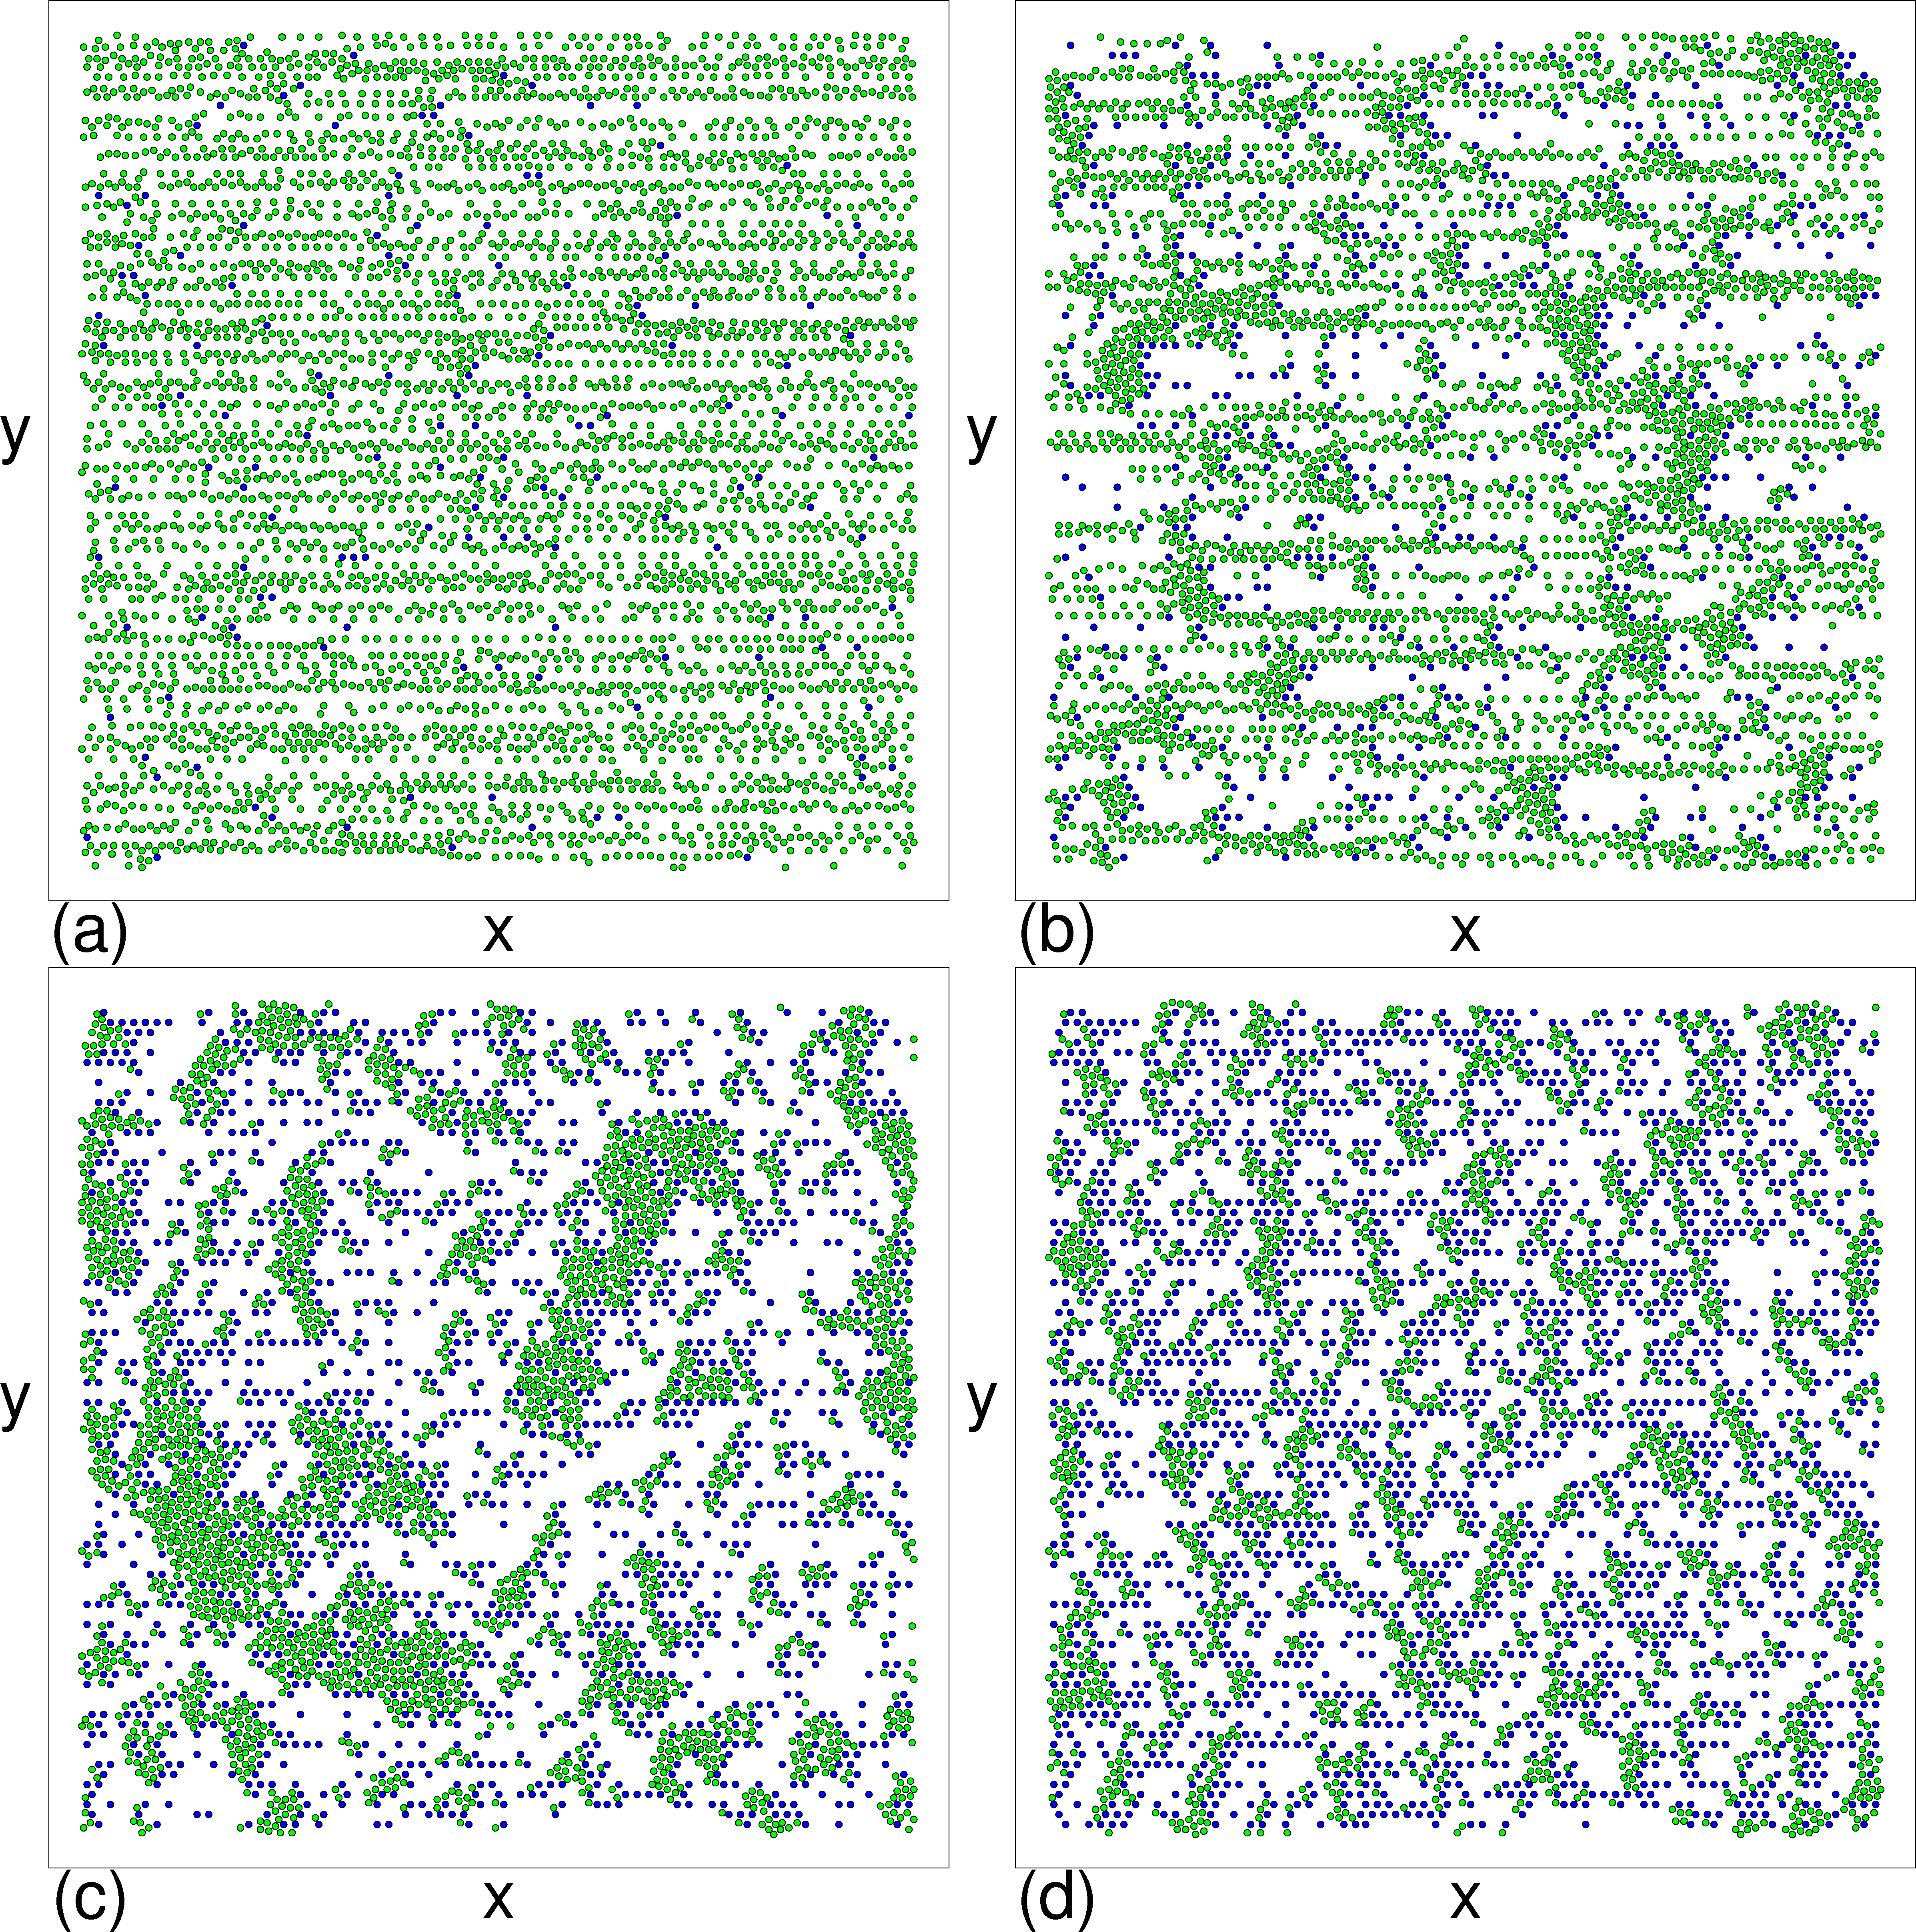
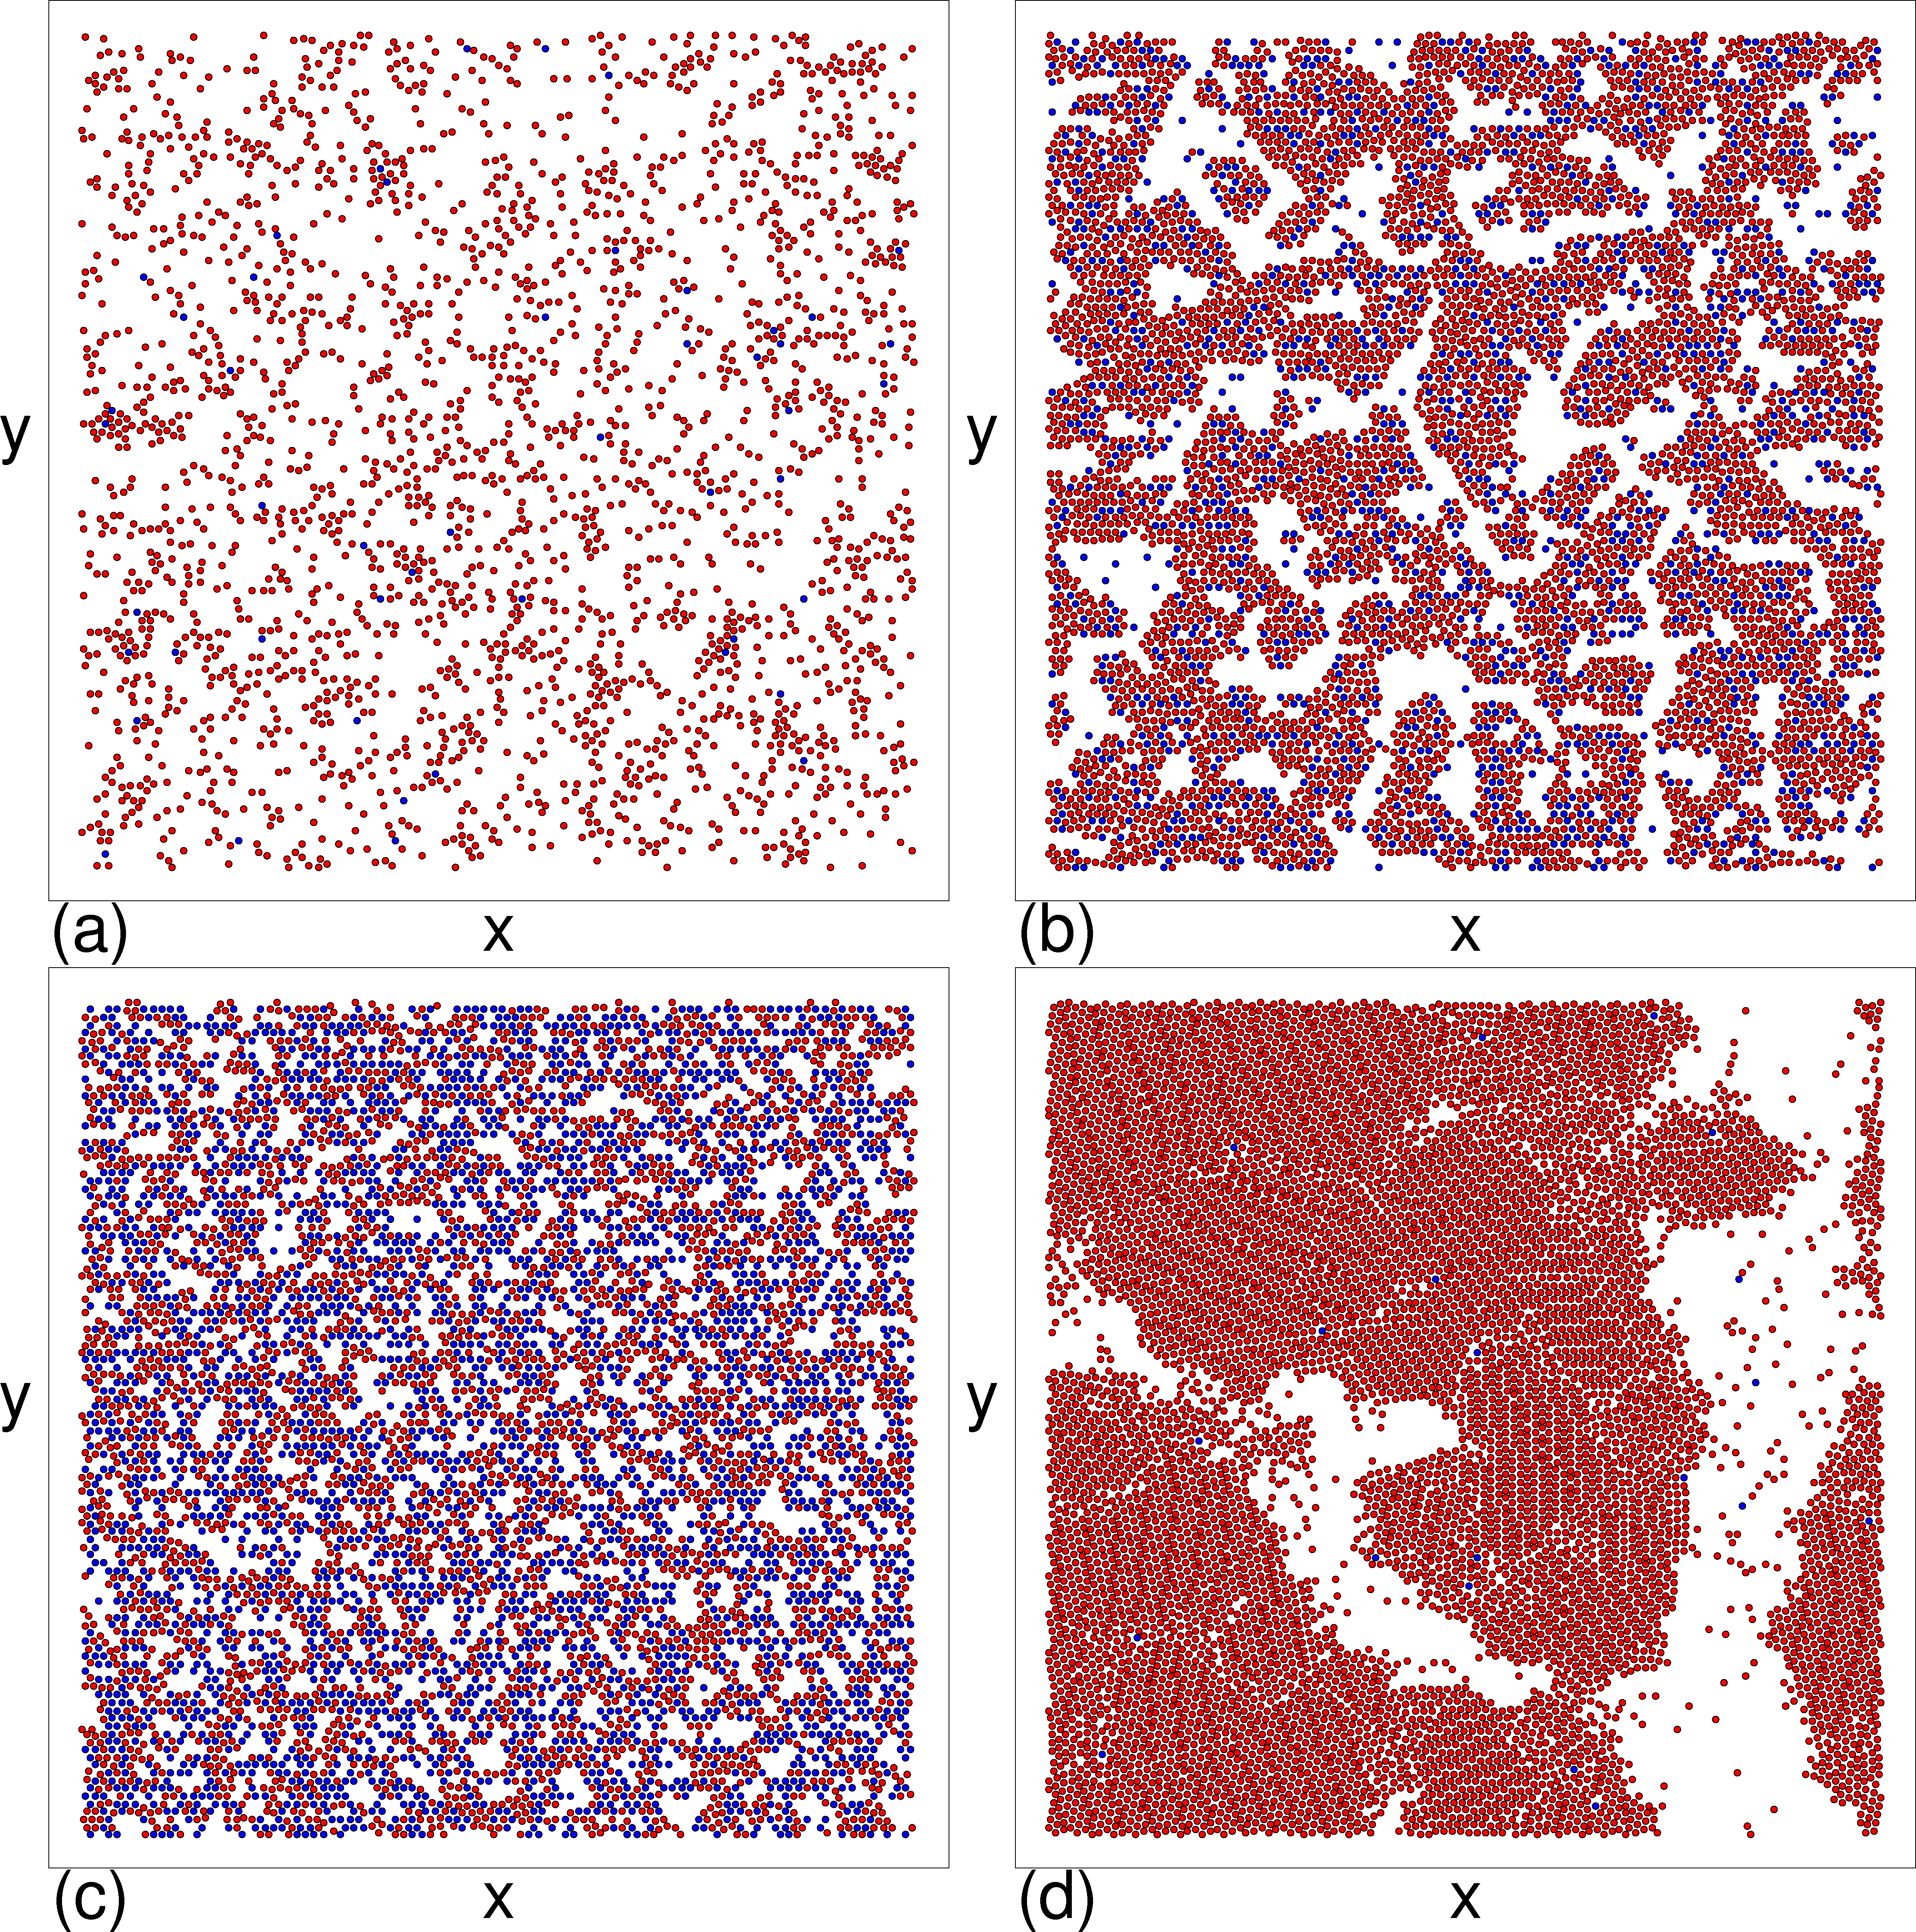
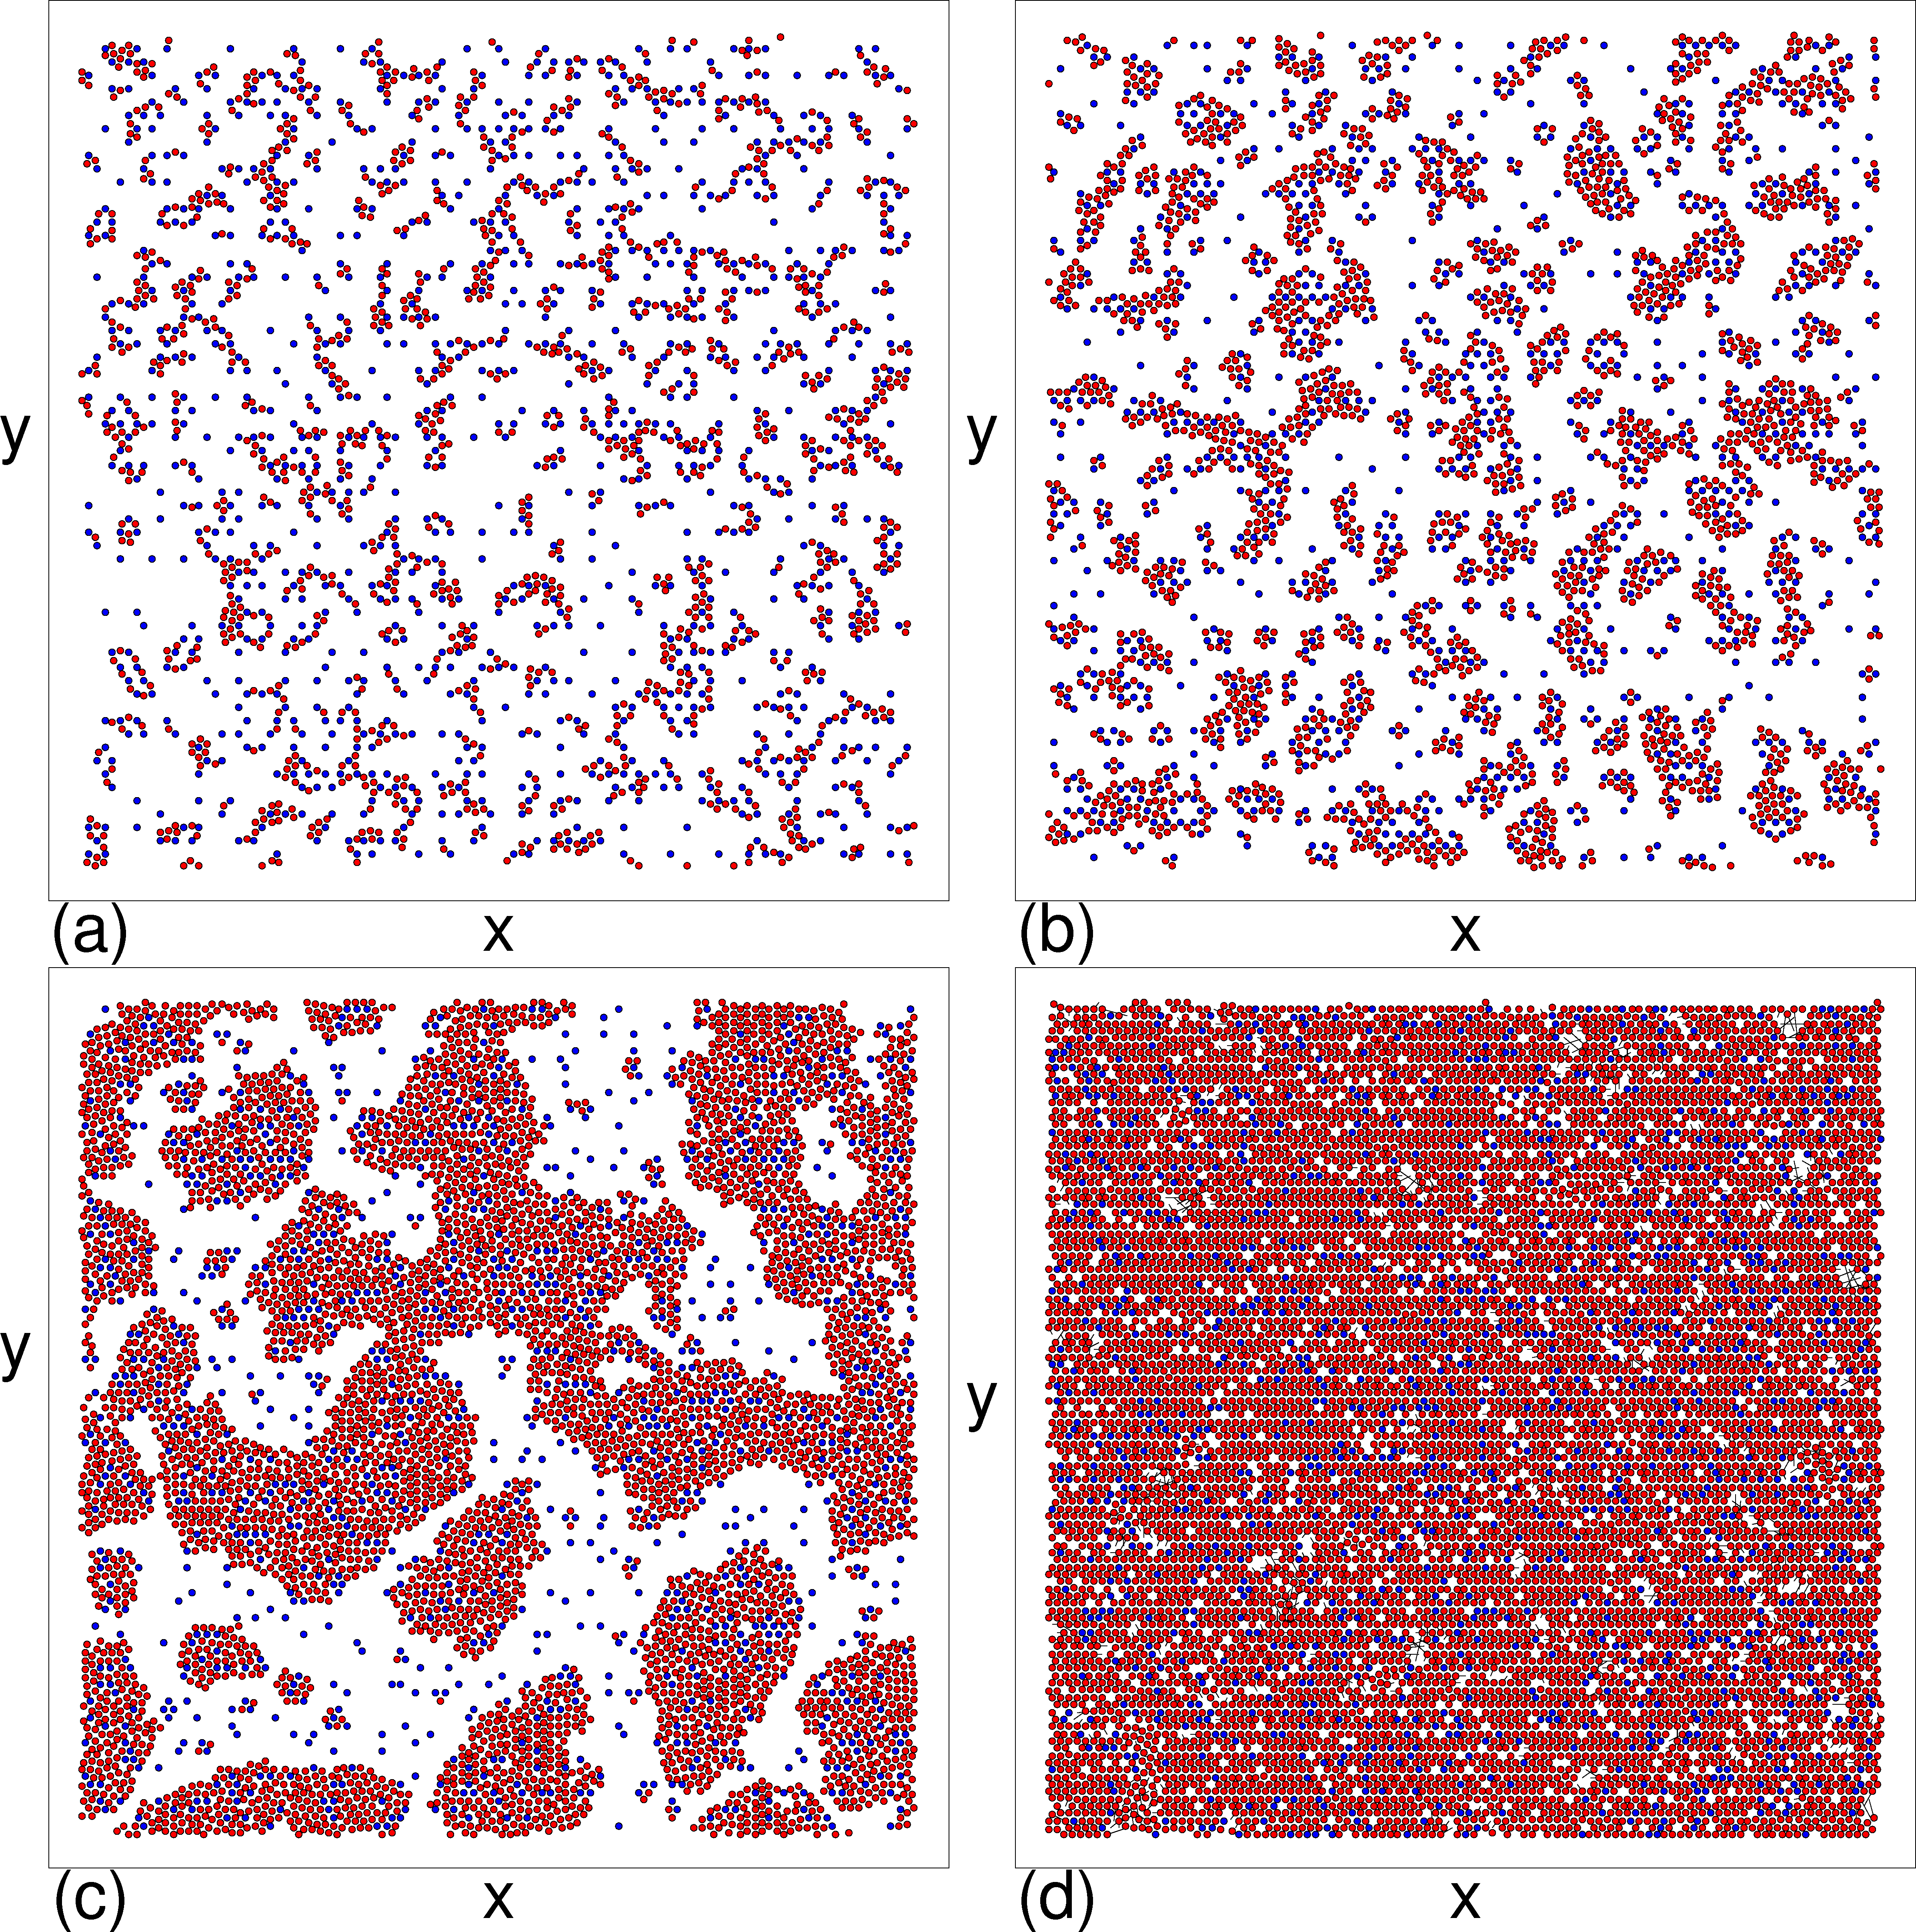
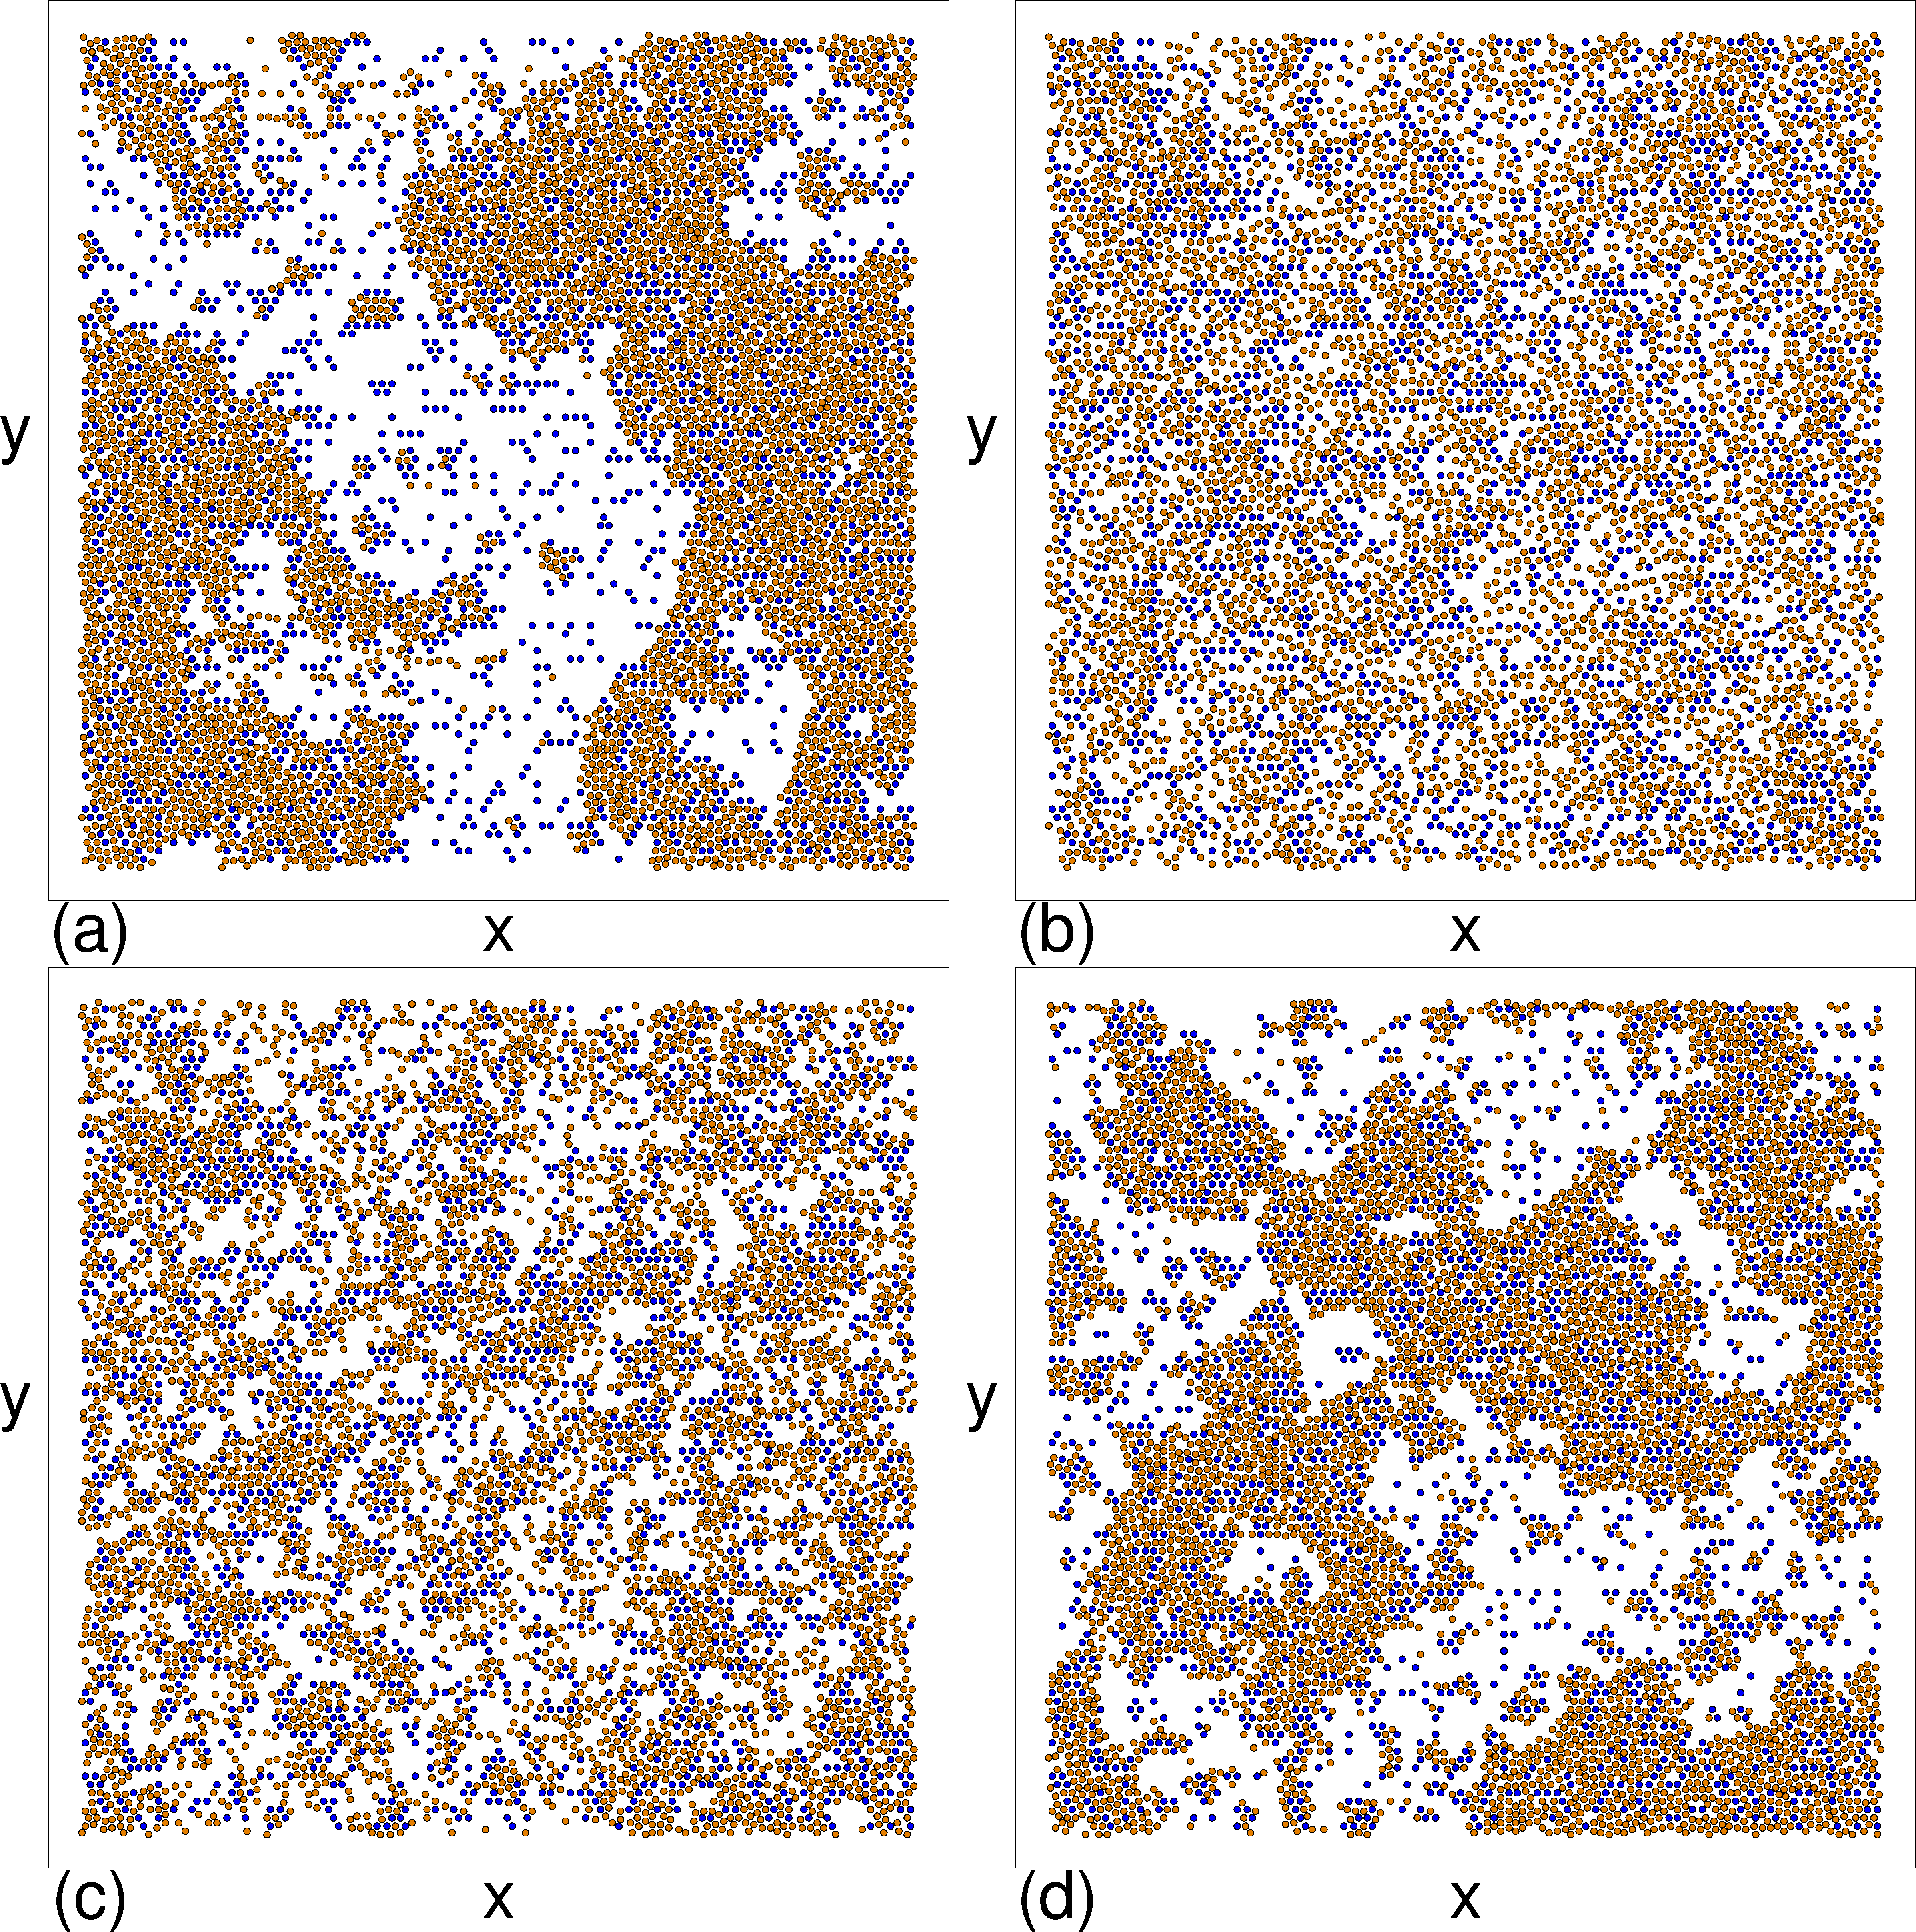
The labels a to d in (a) indicate the values of ϕobs at which the
images in Fig. 8 were obtained.
Figure 7:
(a) 〈Cmax〉, the average number of disks in the largest cluster,
vs ϕobs at FD=0.05 for
ϕtot=0.668 (Ntot = 8500, turquoise),
0.589 (7500, light green), 0.511 (6500, red), 0.432 (5500, dark green),
0.354 (4500, blue), 0.275 (3500, maroon), 0.196 (2500, violet),
0.118 (1500, orange), and 0.0786 (1000, magenta).
(b) The corresponding CL vs ϕobs curves.
The I-II transition is associated with a jump or increase
in 〈Cmax〉 and CL,
while at large ϕobs, the system enters a pinned disordered phase as
indicated by the drop in Cmax and CL to nearly zero.
The labels a to d in (a) indicate the values of ϕobs at which the
images in Fig. 8 were obtained.
|