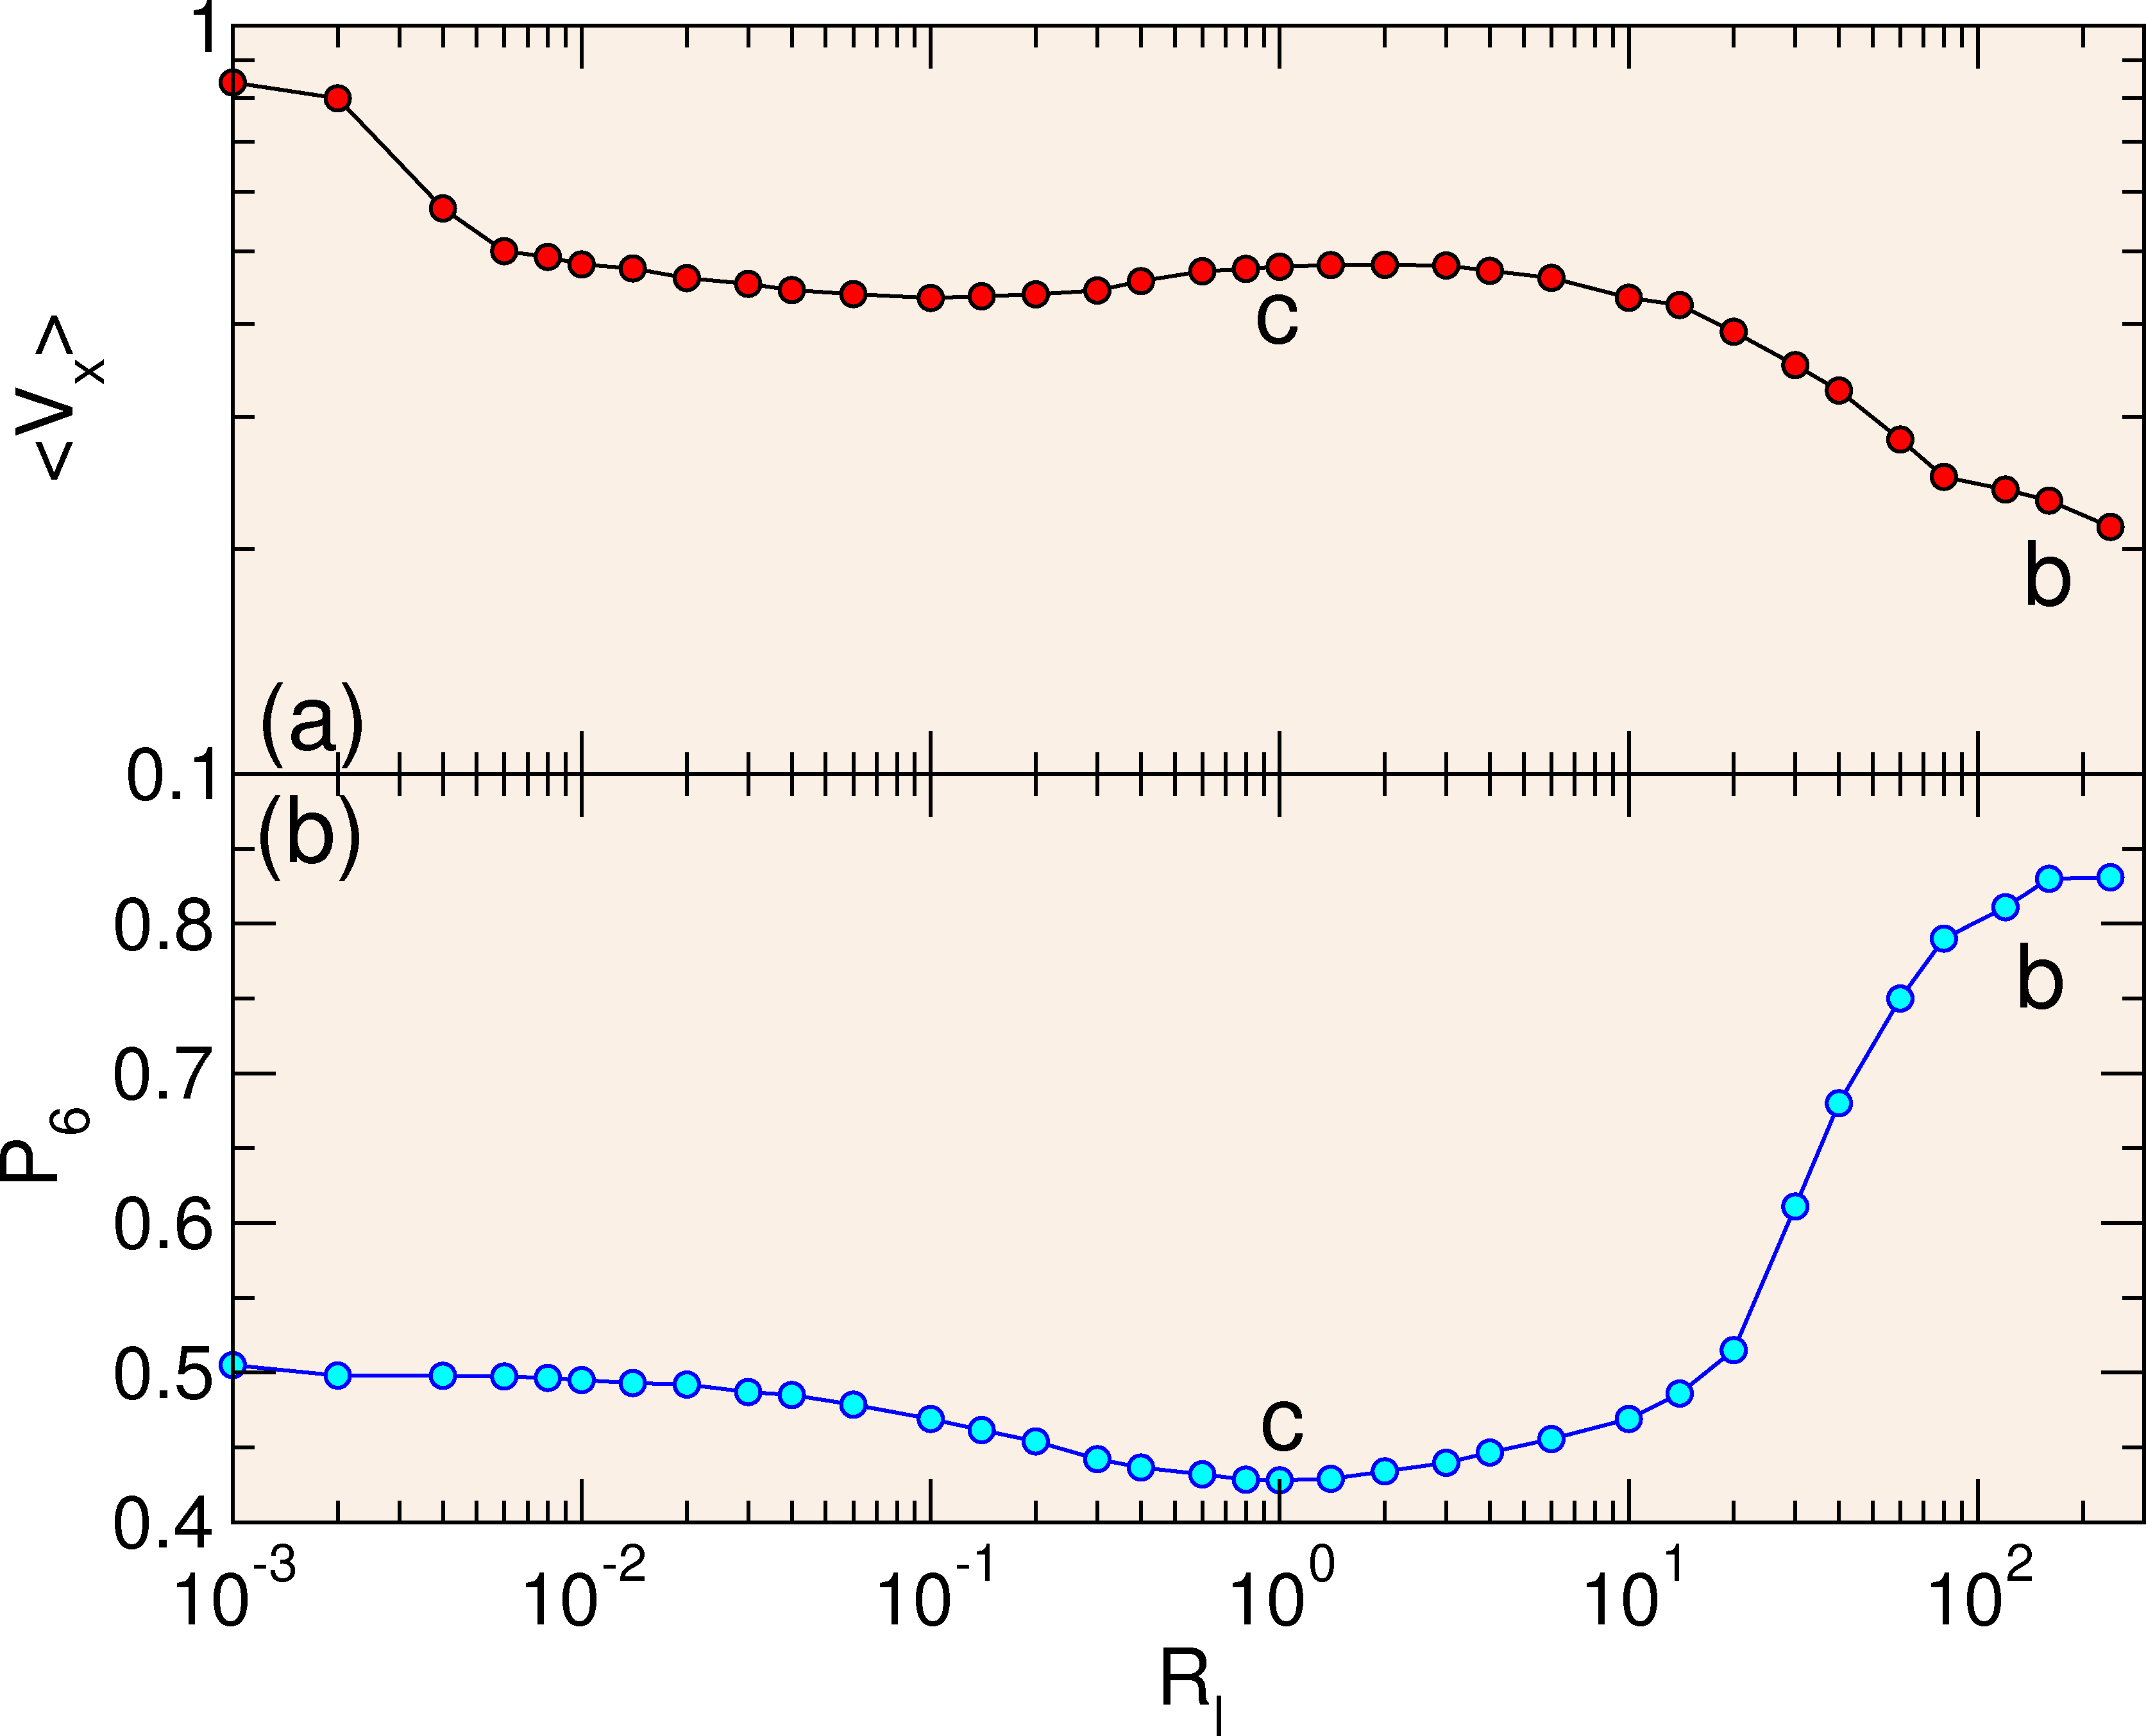
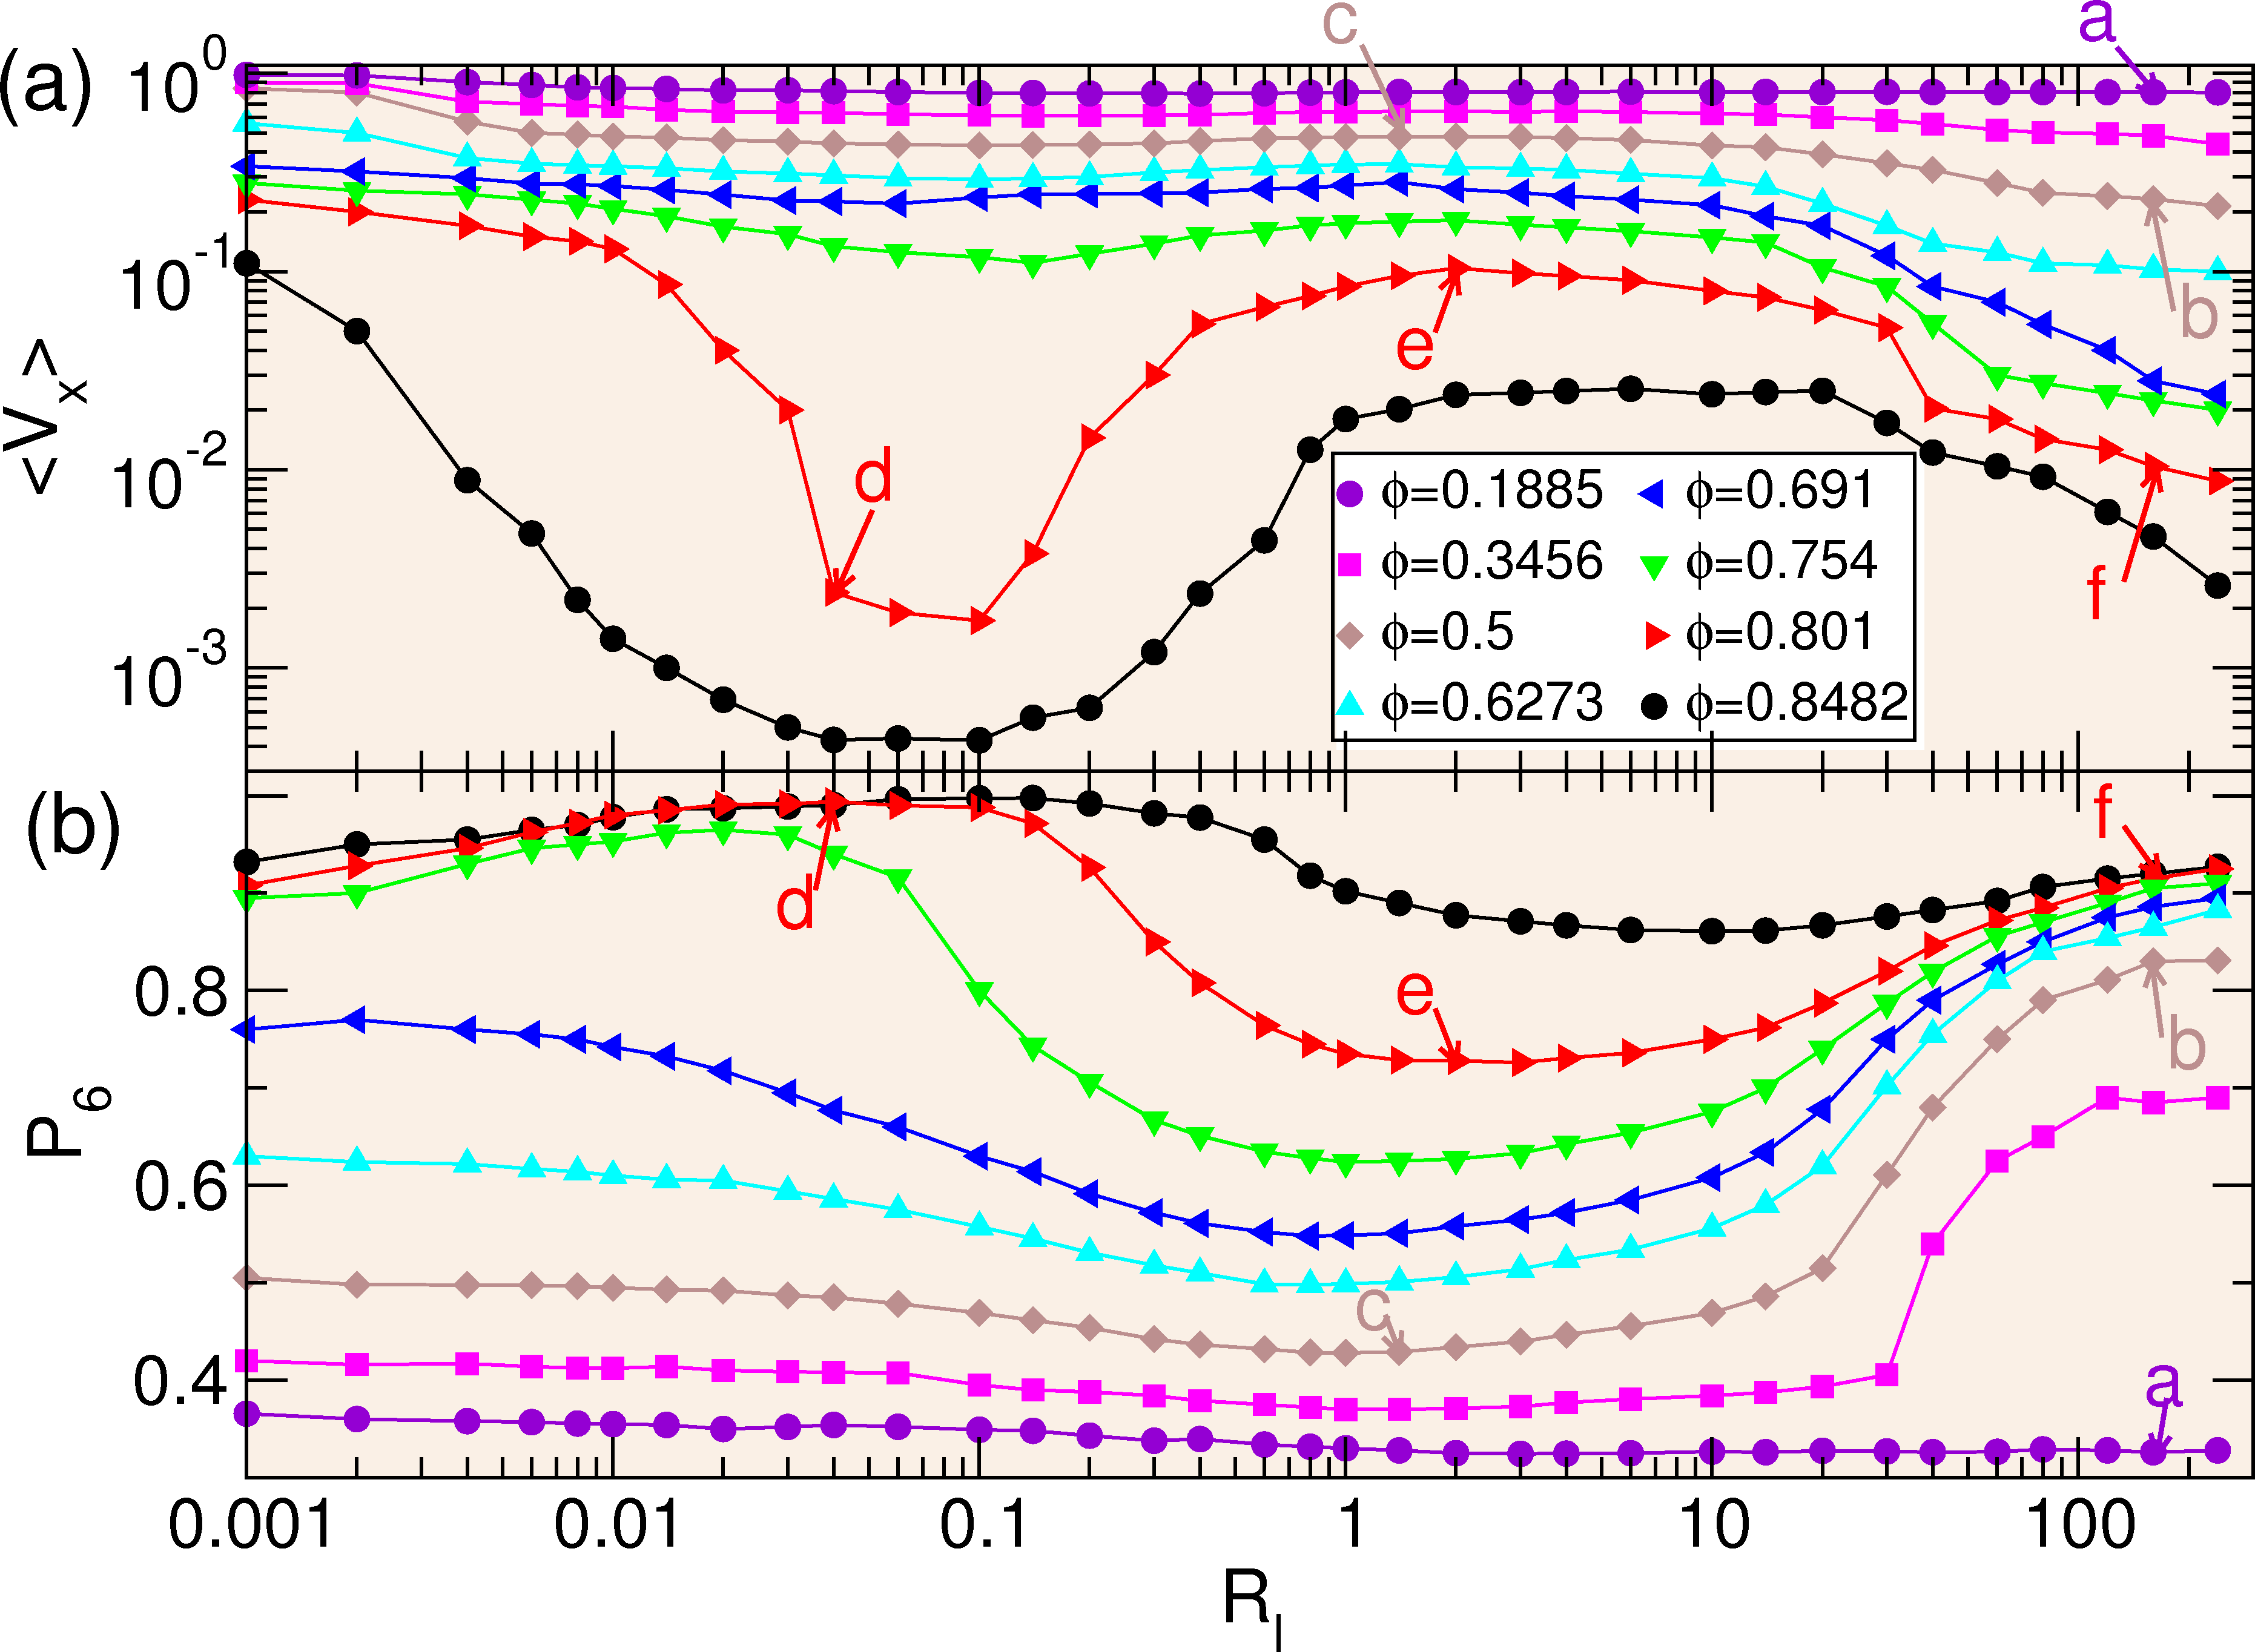
 Figure 5:
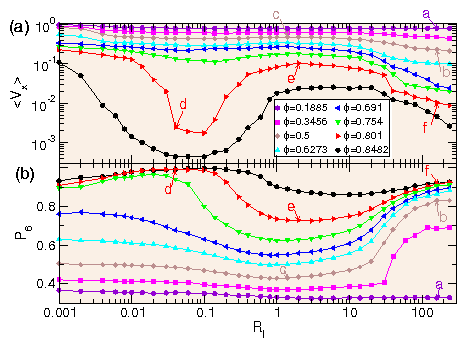
(a) Mobility 〈Vx〉 of the probe
vs run length Rl for ϕ = 0.1885, 0.3456, 0.5,
0.6273, 0.691, 0.754, 0.801, and 0.8482, from top to bottom.
(b)
Corresponding P6 vs Rl for
ϕ = 0.1885, 0.3456, 0.5, 0.6273, 0.691, 0.754, 0.801, and 0.8482,
from bottom to top.
Figure 5:
(a) Mobility 〈Vx〉 of the probe
vs run length Rl for ϕ = 0.1885, 0.3456, 0.5,
0.6273, 0.691, 0.754, 0.801, and 0.8482, from top to bottom.
(b)
Corresponding P6 vs Rl for
ϕ = 0.1885, 0.3456, 0.5, 0.6273, 0.691, 0.754, 0.801, and 0.8482,
from bottom to top.
|