The Journal of Chemical Physics 146, 204903 (2017)

Dewetting and spreading transitions for active matter on random pinning substrates

Cs. Sándor, 1,2 A. Libál, 1,2 C. Reichhardt, 1 and C.J. Olson Reichhardt 1,a)

1Theoretical Division and Center for Nonlinear Studies, Los Alamos National Laboratory, Los Alamos, New Mexico 87545, USA
2Faculty of Mathematics and Computer Science, Babes-Bolyai University, Cluj 400084, Romania

(Received 23 December 2016; accepted 19 April 2017; published online 23 May 2017)

We show that sterically interacting self-propelled disks in the presence of random pinning substrates exhibit transitions among a variety of different states. In particular, from a phase separated cluster state, the disks can spread out and homogeneously cover the substrate in what can be viewed as an example of an active matter wetting transition. We map the location of this transition as a function of activity, disk density, and substrate strength, and we also identify other phases including a cluster state, coexistence between a cluster and a labyrinth wetted phase, and a pinned liquid. Convenient measures of these phases include the cluster size, which dips at the wetting-dewetting transition, and the fraction of sixfold coordinated particles, which drops when dewetting occurs. Published by AIP Publishing. [http://dx.doi.org/10.1063/1.4983344]
I. INTRODUCTION
II. SIMULATION
III. RESULTS
REFERENCES

I.  INTRODUCTION

A wide class of systems exhibit pinning-induced order-disorder transitions in the presence of quenched disorder, including vortices in type-II superconductors [1,2], two-dimensional (2D) electron crystals [3,4], charged colloids [5,6,7], soft matter systems with core-softened potentials [8], and hard disks [9]. When the ordered state is crystalline, increasing the substrate strength or decreasing the particle density can produce a transition to a disordered state through the proliferation of topological defects. In addition to these equilibrium phases, distinct phases can emerge under nonequilibrium conditions in active matter or self-driven particle systems [10,11], including biological systems such as run-and-tumble bacteria [12] or artificial swimmers such as self-motile colloids [11,13,14]. One of the simplest models of active matter is monodisperse sterically interacting disks undergoing active Brownian motion or run and tumble dynamics, which can transition from a uniform liquid state to a clump or phase separated state with increasing disk density, persistence length [15,16,17,18,19,20] or run length [21,22,23]. In the phase separated regime, which appears even in the absence of an attractive component in the disk-disk interactions, large clumps of densely packed disks are separated by a low density gas of active disks. Monodisperse disks exhibit crystalline or polycrystalline ordering within the high density regions inside the clumps [16]. A natural question to ask is how robust these cluster phases are in the presence of quenched disorder and whether pinning-induced transitions can occur as a function of increasing substrate strength.
Obstacle arrays, which have been considered in several studies of swarming models [24,25] and run and tumble disks [23], produce quite different effects from the collective behavior that can arise in pinning arrays. The distinction between a pin and an obstacle is that it is possible for particles to pass through a pinning site either individually or collectively, while obstacles present an impenetrable barrier. The dynamics of many physically relevant active matter systems, such as particles moving over rough substrates, are better described in terms of an effective pinning landscape instead of in terms of obstacle avoidance. Studies of modified Vicsek models in the presence of obstacles showed that swarming was optimized at a particular noise value [24], while in other studies, increasing the disorder strength caused a phase transition from a swarming to a non-swarming state [26]. In studies of self-propelled disks interacting with obstacle arrays, the mobility of the disks was a non-monotonic function of the running length, since disks with long running times spend more time trapped behind obstacles [23].
Here we consider self-propelled disks interacting with a substrate composed of randomly placed pinning sites. A transition from a pin-free phase separated state to a homogeneous state can be induced by increasing the substrate strength. This transition can be viewed as an active matter version of a wetting-dewetting or spreading transition [27], where the active particles spread out to cover the surface when the pinning is strong. We also show that a variety of different states can occur as a function of disk density, substrate strength, and activity, including cluster phases, coexisting clustered and wetted states, a wetted percolating state, and a pinned liquid state. These different states can be characterized by the size of the clusters and the amount of sixfold ordering of the disks.
Fig1.png
Figure 1: The disk positions (open circles) and pinning site positions (dots) for run and tumble disks interacting with a random pinning substrate in samples with lr=300 and Np/Ns=0.5. Colors indicate the largest clusters in the system. (a) A dewetted state (Phase I) at Fp = 1.0 and ϕ = 0.55. (b) A partially wetted state (Phase II) at Fp = 2.25 and ϕ = 0.55. (c) At Fp = 8.0 and ϕ = 0.55, the disk density is uniform and the system forms a wetted state with disordered clusters (Phase III). (d) At Fp = 8.0 and ϕ = 0.349, there is a pinned liquid state (Phase IV).

II.  SIMULATION

We numerically simulate a 2D system of Ns=8000 to 20,000 self-propelled disks using GPU based computing. The disk radius is R = 1.0 and the system size is L ×L with L=300, giving a filling factor of ϕ = πR2/L2 = 0.279 to 0.698. The disks obey the following overdamped equation of motion:
η dri

dt
= Finteri + Fmi + Fpi ,
(1)
where η = 1 is the drag coefficient, Finteri=∑ijNsΘ(d−2R)k(d−2R)d is the repulsive disk-disk interaction force, d=|rirj|, d=(rirj)/d, k=20 is the harmonic spring contact force, and Θ(x) is the Heaviside function. The motor force Fmi=Fmmi with fixed Fm=1.0 acts on each disk in a direction mi that changes randomly via a run and tumble protocol every tr simulation time steps. The time step used in the simulations is dt=0.001. We characterize the activity of the disks by ~lr=Fmtr dt, which is the distance a disk would travel in a single running time in the absence of disk-disk interactions or pinning, and take ~lr to be uniformly distributed over the range [lr,2lr]. Fpi, the pinning force exerted by the substrate, is modeled by an array of Np randomly placed circular parabolic traps with a finite radius of Rp=0.5, with Fpi=∑k=1NpFp(rpik/Rp)Θ(rpikRp)rpik where Fp is the maximum pinning force exerted at the edge of the trap, rik=|rirk(p)| is the distance from the center of disk i to the center of pinning site k, and rpik=(rirk(p))/rik. Since Rp < R, a given pinning site can trap no more than one disk at a time.
Fig2.png
Figure 2: (a) The fractional size of the largest cluster Cl/Ns vs Fp at lr = 300 and Np=8000 for Ns=8000 to 20,000 corresponding to ϕ = 0.279 to 0.698. The letters a, b, c, and d indicate the points at which the images in Fig. 1(a-d) were obtained. The dip near Fp=2.5 occurs at the transition from the dewetted phase I or the partially wetted phase II to the wetted phase III. (b) The corresponding fraction of sixfold coordinated particles P6 vs Fp shows a drop as the system enters phase III.

III.  RESULTS

In Fig. 1 we show four representative images of the phases that appear for active disks moving over a quenched pinning landscape in a sample with lr=300 and Np/Ns=0.5. The coloring highlights the largest individual clusters of disks, identified using the algorithm of Luding and Herrmann [28]. In the absence of a substrate, Fp=0.0, the disks form a phase separated state for these parameters. For Fp=1.0 in Fig. 1(a), a phase separated state containing a single high density cluster is still present. Disks in the surrounding low density gas state can be temporarily pinned since Fm=Fp, but overall the morphology is similar to that of the pin-free state. We term this the active dewetted state, or Phase I. At Fp = 2.25 in Fig. 1(b), a large cluster is still present but numerous smaller clusters have nucleated due to the trapping of gas phase disks by the pinning sites. As a result, the large cluster is smaller than that shown in Fig. 1(a) while the gas phase density is higher. This partially wetted state, called Phase II, can be viewed as a coexistence of the dewetted state, consisting of the large cluster, and a wetted state, in which the particles coat the entire substrate. At Fp = 8.0 in Fig. 1(c), the single large cluster has vanished and the system adopts a uniform labyrinth morphology which we refer to as the wetted state or Phase III. In general we observe a similar sequence of phases at lower disk densities but find that the wetted state becomes less labyrinthine when the disks contact each other less frequently, as shown in Fig. 1(d) for Fp = 8.0 and ϕ = 0.349 where the system forms a pinned liquid state called Phase IV.
Fig3.png
Figure 3: A heat map of Cl/Ns showing the locations of the different phases as a function of ϕ vs Fp for fixed lr=300 and Np=8000. Red areas for Fp < 2.75 indicate the formation of large compact clumps, while in the green areas for Fp ≥ 2.75, large branching clumps appear. I: dewetted phase; II: partially wetted phase (along dashed line); III: wetted phase; IV: pinned liquid. The letters a, b, c, and d indicate the values of ϕ and Fp at which the images in Fig. 1 were obtained.
Fig4.png
Figure 4: (a) The size of the largest cluster Cl/Ns vs Fp at fixed ϕ = 0.55 and Np/Ns=0.5 for run lengths ranging from lr=1 to lr=500. (b) The corresponding fraction of sixfold coordinated particles P6 vs Fp shows a drop as the system enters phase III.
In Fig. 2(a) we plot the fraction of particles in the largest cluster Cl/Ns versus Fp for the system in Fig. 1 at a fixed run length of lr=300 for varied ϕ. Figure 2(b) shows the corresponding fraction P6 of sixfold coordinated disks obtained using the CGAL library[29]. For ϕ > 0.315, we find Cl/Ns > 0.8 and P6 > 0.8 at low Fp since the system forms a single large clump with strong sixfold ordering. In the range 0.315 < ϕ < 0.5, there is a pronounced drop in both Cl/Ns and P6 with increasing Fp as the system transitions from the clump phase illustrated in Fig. 1(a) to a pinned liquid phase of the type shown in Fig. 1(d). For ϕ > 0.5, just before Cl/Ns reaches a minimum value at Fp ≈ 2.5 the system enters a partially wetted state similar to that shown in Fig. 1(b). As Fp increases further, Cl/Ns increases again but P6 continues to decrease, indicating that clusters with disordered structure have emerged, as illustrated in Fig. 1(c) at Fp = 8.0 where the system forms a labyrinth state and the disk density becomes uniform. The morphology of the large cluster is different in the two high Cl/Ns regimes, with a compact cluster forming in the dewetted state for Fp < 2.5, and a much more porous, extended, and branching cluster appearing in the wetted state for Fp > 2.5. For ϕ < 0.5 at high Fp, interconnections between small branching clusters can no longer percolate across the sample, so there is no giant branching cluster and Cl/Ns remains low. Overall, we find that for the dewetted cluster (I), Cl/Ns and P6 are both large and the disk density is heterogeneous. In the partially wetted phase (II), Cl/Ns is low and P6 has an intermediate value while the disk density remains heterogeneous. The wetted labyrinth phase (III) has high Cl/Ns and high P6 along with a homogeneous disk density. Finally, in the pinned liquid phase (IV), Cl/Ns and P6 are both low and the disk density is homogeneous.
In Fig. 3(a) we show a heat map [30] based on Cl/Ns values as a function of ϕ versus Fp indicating the locations of phases I through IV. For ϕ < 0.35, the system is too dilute to form clusters, so Cl/Ns remains low at all values of Fp. A dewetting-wetting transition from phase I to phase III occurs for ϕ ≥ 0.35, with the dashed line indicating the sliver of partially wetted phase (II) that exists close to this transition. The transition from phase I to phase II is not sharply defined. For the clump-forming densities ϕ ≥ 0.35, over the range 0.0 < Fp < 2.75 the radius Rcl of the compact clump decreases with increasing Fp while the density of the gaslike phase surrounding the clump increases. A direct measurement of Rcl in the ϕ = 0.55 sample gives Rcl ∝ (FcFp)α with α = 1.0 and Fc = 2.75. In the dewetted phase I, there is a coexistence between a high density phase inside the clumps in which the local density ϕh is close to the monodisperse packing limit of ϕh ≈ 0.9, along with a low density phase with local density ϕl << ϕh. As Fp increases, more disks become trapped by pinning sites, so that the spatial extent of the dense phase decreases while ϕh remains constant. At the same time, ϕl increases until, at the transition to the fully wetted phase III, ϕl=ϕ.
Fig5.png
Figure 5: A heat map of Cl/Ns showing the locations of the different phases as a function of lr vs Fp for fixed ϕ = 0.55 and Np/Ns=0.5. Red areas for Fp < 2.5 indicate the formation of large compact clumps, while in the green areas for Fp ≥ 2.5, large branching clumps appear. I: dewetted phase; II: partially wetted phase (along dashed line); III: wetted phase; IV: pinned liquid.
We have also considered the effect of the run length by fixing the disk density at ϕ = 0.55 and increasing lr, as shown in Fig. 4(a,b) where we plot Cl/Ns and P6 versus Fp. For small lr < 20, Cl/Ns and P6 are both low and the system is in a pinned liquid state. For large lr ≥ 20, a clump phase appears for Fp < 2.75 and we observe a dip feature in Cl/Ns and a drop in P6 at the dewetting-wetting transition. The overall behavior is very similar to that shown for varied ϕ and fixed lr in Fig. 2. The heat map diagram of Cl/Ns values in Fig. 5 as a function of lr versus Fp illustrates the locations of phases I through IV.
To test the effect of the pinning site density, we fix lr=300, ϕ = 0.55, and Fp=2.0 and increase the number of pinning sites Np. We find that at low pinning densities, a dewetted clump phase appears that transitions to a wetted phase as Np increases. One difference between sweeping Fp and sweeping Np is that at the highest pinning densities the percolating cluster phase disappears. Since overlapping of pinning sites is not allowed, trapped disks are not likely to come into contact with each other to form a cluster, and at large Np almost every disk is trapped, so Cl/Ns drops nearly to zero.
Fig6.png
Figure 6: The local density ϕh inside the clusters (green) and ϕl in the gas phase (brown) at fixed ϕ = 0.55. (a) ϕh and ϕl vs Fp for lr=300 and Np/Ns=0.5. (b) ϕh and ϕl vs lr for Fp=2.0 and Np/Ns=0.5. (c) ϕh and ϕl vs Np/Ns for lr=300 and Fp=5.0. Dashed lines indicate the point at which the large cluster disappears from the system.
In Fig. 6 we plot the changes in the local density ϕh inside the clusters and ϕl in the gas phase as a function of Fp, lr, and Np/Ns. In each case, ϕh decreases slightly from ϕh=0.9 before suddenly dropping to ϕh=0 when the cluster disappears and the system reaches a uniformly wetted state. At the same time, ϕl gradually increases as the transition to the fully wetted cluster-free state is approached. The gentle decrease in ϕh in the cluster state occurs since the effective pressure inside the cluster falls as the cluster shrinks. The increase in ϕl is caused by a simple conservation of mass; as disks leave the cluster they become part of the gas phase which fully wets the substrate once ϕl=ϕ.
We can also characterize the different regimes by measuring the mean square particle displacements as a function of time, ∆r2(t) = ∑iNs|(ri(t) − ri(t0))|2. In Fig. 7(a) we plot ∆r2 versus time for a sample from Fig. 5 with lr = 1.0 and ϕ = 0.55 at Fp = 0 and Fp = 5.0. In the substrate-free limit of Fp = 0, the disks behave like a collection of diffusing Brownian particles and ∆r2tα with α = 1.0 for long times, while at shorter times α > 1.0 indicating superdiffusion due the activity of the disks. For Fp = 5.0, we find α = 0.7 at long times, indicating subdiffusion due to the strong trapping of disks by the pinning sites. At time scales longer than what is shown in the figure, the system exhibits regular diffusion so that there is a crossover to α = 1.0. In Fig. 7(b) we plot ∆r2 versus time for samples with lr = 300 at Fp = 1.0, 1.5, 4.0, and 6.0. At Fp = 1.0 the system is in the dewetted phase I, and exhibits superdiffusive behavior with α = 1.7 for short and intermediate times due to the activity of the disks. In the weak pinning regime, for large lr the particles can move ballistically for long times, giving rise to the superdiffusive exponent; however, at longer times when the particle can change its running direction, there is a crossover to diffusive behavior with α = 1.0. A similar behavior appears for Fp = 1.5 near the partially wetted phase II, where the crossover from superdiffusion to subdiffusion occurs at an earlier time. For Fp = 4.0 in the wetted phase III, superdiffusive behavior occurs at short times due to the disk activity but a crossover to diffusive behavior occurs at much earlier times than was the case for phases I and II, while deeper into the wetted phase III at Fp = 6.0, the long time behavior is weakly subdiffusive with α ≈ 0.85 to 0.9 due to the strong pinning effects. We also observe similar behavior for varied ϕ in the different phases.
Fig7.png
Figure 7: 
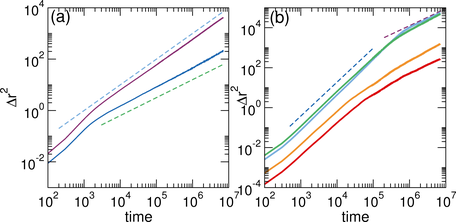
The mean square displacement ∆r2 vs time in simulation time steps from the system in Fig. 5 at ϕ = 0.55. (a) For lr = 1 at Fp = 0 (purple) and Fp=1.0 (dark blue), we can fit δr2tα. At long times, α = 1.0 for Fp = 0 (blue dashed line), consistent with diffusive motion, while for Fp=1.0 we find subdiffusive behavior with α = 0.7 (green dashed line) due to the particle trapping. (b) ∆r2 vs time for lr = 300 at Fp = 1.0 (blue), 1.5 (green), 4.0 (orange), and 6.0 (red). For Fp = 1.0 and Fp=1.5, in phase I and phase II the system is superdiffusive at short and intermediate times with α = 1.7 (blue dashed line) and diffusive or slightly subdiffusive at long times with α = 0.85 (purple dashed line). For Fp = 4.0 and Fp=5.0, the crossover to subdiffusion occurs at earlier times in phase III.
Fig8.png
Figure 8: Distributions Ploc) of the local density ϕloc for the system in Fig. 3 for lr = 300. (a) The dewetted phase I at ϕ = 0.55 and Fp = 1.0 has a bimodal distribution of ϕloc. (b) The partially wetted phase II at ϕ = 0.55 and Fp = 2.25 has a bimodal distribution with increased weight at lower ϕloc. (c) The dewetted phase III at ϕ = 0.55 and Fp = 8.0 has a single broad peak in Ploc) centered at ϕloc=ϕ. (d) The pinned liquid phase IV at ϕ = 0.349 and Fp = 8.0 has a single peak centered at ϕloc=ϕ.
We can also characterize the different phases based on the distribution of local disk density ϕloc, measured by partitioning the system into a grid array and obtaining the distribution of the disk density in individual grid elements. In Fig. 8(a) we plot Ploc) for a system from Fig. 3 in the phase I cluster state at lr = 300, ϕ = 0.55, and Fp = 1.0. There is a strong bimodal distribution of ϕloc with a peak near ϕloc = 0.1 corresponding to the low density region and a second peak near ϕloc = 1.0 produced by the dense regions. In the partially wetted phase II at ϕ = 0.55 and Fp=2.25, Fig. 8(b) shows that Ploc) also has a bimodal distribution with one peak near ϕloc = 0.4 from the lower density regions containing individually pinned particles, and a second peak near ϕloc = 0.95 corresponding to the dense cluster. In Fig. 8(c), the wetted phase III at ϕ = 0.55 and Fp = 8.0 exhibits a single broad peak centered at ϕloc = ϕ = 0.55 with weight extending up to ϕloc = 0.75 and down to ϕloc = 0.4. Figure 8(d) shows that in the pinned liquid phase IV at ϕ = 0.349 and Fp = 8.0, there is again a single peak centered close to ϕloc = ϕ = 0.349, but the distribution is narrower than it was in phase III.
Fig9.png
Figure 9: Results for repulsive pinning sites in a sample with lr=300, Np=8000, and ϕ ranging from 0.279 to 0.698. (a) The size of the largest cluster Cl/Ns vs Fp. (b) The fraction of six-fold coordinated particles P6 vs Fp. We find the same general trends as for the attractive pinning case; however, the transition from the cluster phase to the pinned liquid or labyrinth phase is shifted to higher values of Fp .
Another question is how robust these results are in the presence of different types of substrates, such as repulsive pinning sites or obstacles. In Fig. 9 we plot the cluster sizes Cl/Ns as well as P6 versus Fp for the same system as in Fig. 2 but with repulsive pinning sites for Rl = 300, Np = 8000, and Ns=8000 to 20,000 corresponding to ϕ = 0.279 to 0.698. In this case, for ϕ < 0.349 the system is homogeneous for all Fp, while for ϕ ≥ 0.349 a cluster state appears at Fp = 0. At ϕ = 0.349 there is a transition from a cluster state at low Fp to a pinned liquid state for Fp ≥ 2.0, while at ϕ = 0.419 the transition to the pinned liquid state is shifted up to Fp = 5.0. In general the features in Cl/Ns and P6 are similar to those found for attractive pinning sites in Fig. 2, and we find the same four phases; however, the values of Fp at which transitions between these phases occur are shifted to higher values of Fp for the repulsive pinning sites compared to the system with attractive pinning sites. These results indicate that the general features of the phase diagram in Fig. 3 remain robust for either attractive or repulsive pinning sites. Recent experiments on flocking systems of active rolling colloids show that as a function of increasing obstacle number, a transition occurs from a flocking state to a disordered state [34,35]. In our system, for a fixed repulsive pinning strength we also find a transition from a cluster state to a homogeneous state when the ratio of the number active disks to the number of pinning sites is varied, as shown in Fig. 9.
Our results could be tested using active matter systems in the presence of a rough substrate. One method that can be used to create such a substrate is optical trapping, which allows the substrate strength to be tuned by varying the light intensity. There has already been some work examining the behavior of run and tumble bacteria in optical trap arrays [31,32]. Although we focus on run and tumble systems, our results should be general to driven Brownian particle systems in which similar clustering transitions occur due to the density dependence of the particle motility [33]. Since the disks in a cluster are less strongly coupled to the substrate than disks that are not part a cluster, the onset of clustering may be a useful strategy that could be exploited by living active matter to collectively escape from a disordered environment.
In summary, we have numerically examined run and tumble disks interacting with a random pinning substrate where we find that there can be active matter wetting-dewetting transitions as a function of pinning strength, disk density, and run length. In regimes where the pin-free system forms a cluster state, we find that increasing the substrate strength causes the size of the cluster to shrink gradually until the disk density becomes homogeneous. Here, the cluster phase can be viewed as a dewetted state while the homogeneous phase is like a wetted state. We show that the system exhibits different phases including a clump state, a partially wetted state in which clumps coexist with a gas of pinned disks, a fully wetted labyrinth state, and a pinned liquid state. Transitions between these states can be identified by measuring the size of the largest cluster and the fraction of sixfold coordinated particles. Our results indicate that pinning can induce transitions in the behavior of active matter systems that are similar to the pinning-induced order-disorder transitions in equilibrium condensed matter systems.

ACKNOWLEDGMENTS

This work was carried out under the auspices of the NNSA of the U.S. DoE at LANL under Contract No. DE-AC52-06NA25396. Cs. Sándor and A. Libál thank the Nvidia Corporation for their graphical card donation that was used in carrying out these simulations.

REFERENCES

[1]
E.H. Brandt, Rep. Prog. Phys. 58, 1465 (1995).
[2]
S.C. Ganguli, H. Singh, G. Sarswat, R. Ganguly, V. Bagwe, P. Shirage, A. Thamizhavel, and P. Raychaudhuri, Sci. Rep. 5, 10613 (2015).
[3]
M.-C. Cha and H.A. Fertig, Phys. Rev. Lett. 74, 4867 (1995).
[4]
D. Carpentier and P. Le Doussal, Phys. Rev. Lett. 81, 1881 (1998).
[5]
A. Pertsinidis and X.S. Ling, Phys. Rev. Lett. 100, 028303 (2008).
[6]
C. Reichhardt and C.J. Olson, Phys. Rev. Lett. 89, 078301 (2002).
[7]
S. Deutschländer, T. Horn, H. Löwen, G. Maret, and P. Keim, Phys. Rev. Lett. 111, 098301 (2013).
[8]
E.N. Tsiok, D.E. Dudalov, Yu.D. Fomin, and V.N. Ryzhov, Phys. Rev. E 92, 032110 (2015).
[9]
W. Qi and M. Dijkstra, Soft Matter 11, 2852 (2015).
[10]
M.C. Marchetti, J.F. Joanny, S. Ramaswamy, T.B. Liverpool, J. Prost, M. Rao, and R.A. Simha, Rev. Mod. Phys. 85, 1143 (2013).
[11]
C. Bechinger, R. DiLeonardo, H. Löwen, C. Reichhardt, G. Volpe, and G. Volpe, Rev. Mod. Phys. 88, 045006 (2016).
[12]
H.C. Berg, Random Walks in Biology (Princeton University Press, Princeton, 1983).
[13]
J.R. Howse, R.A.L. Jones, A.J. Ryan, T. Gough, R. Vafabakhsh, and R. Golestanian, Phys. Rev. Lett. 99, 048102 (2007).
[14]
G. Volpe, I. Buttinoni, D. Vogt, H.-J. Kümmerer, and C. Bechinger, Soft Matter 7, 8810 (2011).
[15]
Y. Fily and M.C. Marchetti, Phys. Rev. Lett. 108, 235702 (2012).
[16]
G.S. Redner, M.F. Hagan, and A. Baskaran, Phys. Rev. Lett. 110, 055701 (2013).
[17]
J. Palacci, S. Sacanna, A.P. Steinberg, D.J. Pine, and P.M. Chaikin, Science 339, 936 (2013).
[18]
I. Buttinoni, J. Bialké, F. Kümmel, H. Löwen, C. Bechinger, and T. Speck, Phys. Rev. Lett. 110, 238301 (2013).
[19]
C. Tung, J. Harder, C. Valeriani, and A. Cacciuto, Soft Matter 12, 555 (2016).
[20]
J. Bialké, J.T. Siebert, H. Löwen, and T. Speck, Phys. Rev. Lett. 115, 098301 (2015).
[21]
J. Tailleur and M.E. Cates, Phys. Rev. Lett. 100, 218103 (2008).
[22]
A.G. Thompson, J. Tailleur, M.E. Cates, and R.A. Blythe, J. Stat. Mech.: Theor. Exp. 2011, P02029 (2011).
[23]
C. Reichhardt and C.J.O. Reichhardt, Phys. Rev. E 90, 012701 (2014).
[24]
O. Chepizhko, E.G. Altmann, and F. Peruani, Phys. Rev. Lett. 110, 238101 (2013).
[25]
O. Chepizhko and F. Peruani, Phys. Rev. Lett. 111, 160604 (2013).
[26]
D. Quint and A. Gopinathan, Phys. Biol. 17, 046008 (2015).
[27]
D. Bonn, J. Eggers, J. Indekeu, J. Meunier, and E. Rolley, Rev. Mod. Phys. 81, 739 (2009).
[28]
S. Luding and H.J. Herrmann, Chaos 9, 673 (1999).
[29]
M. Karavelas, CGAL User and Reference Manual vol. 4.8.1, (CGAL Editorial Board, 2016).
[30]
J.D. Hunter, Comput. Sci. Eng. 9, 90 (2007).
[31]
M. Paoluzzi, R. Di Leonardo, and L. Angelani, J. Phys.: Condens. Matter 26, 375101 (2014).
[32]
E. Pince, S.K.P. Velu, A. Callegari, P. Elahi, S. Gigan, G. Volpe, and G. Volpe, Nature Commun. 7, 10907 (2015).
[33]
M.E. Cates and J. Tailleur, Europhys. Lett. 101, 20010 (2013).
[34]
C. J. Olson Reichhardt and C. Reichhardt, Nature Phys. 13, 10 (2017).
[35]
A. Morin, N. Desreumaux, J.-B. Caussin, and D. Bartolo, Nature Phys. 13, 63 (2017).


File translated from TEX by TTHgold, version 4.00.
Back to Home