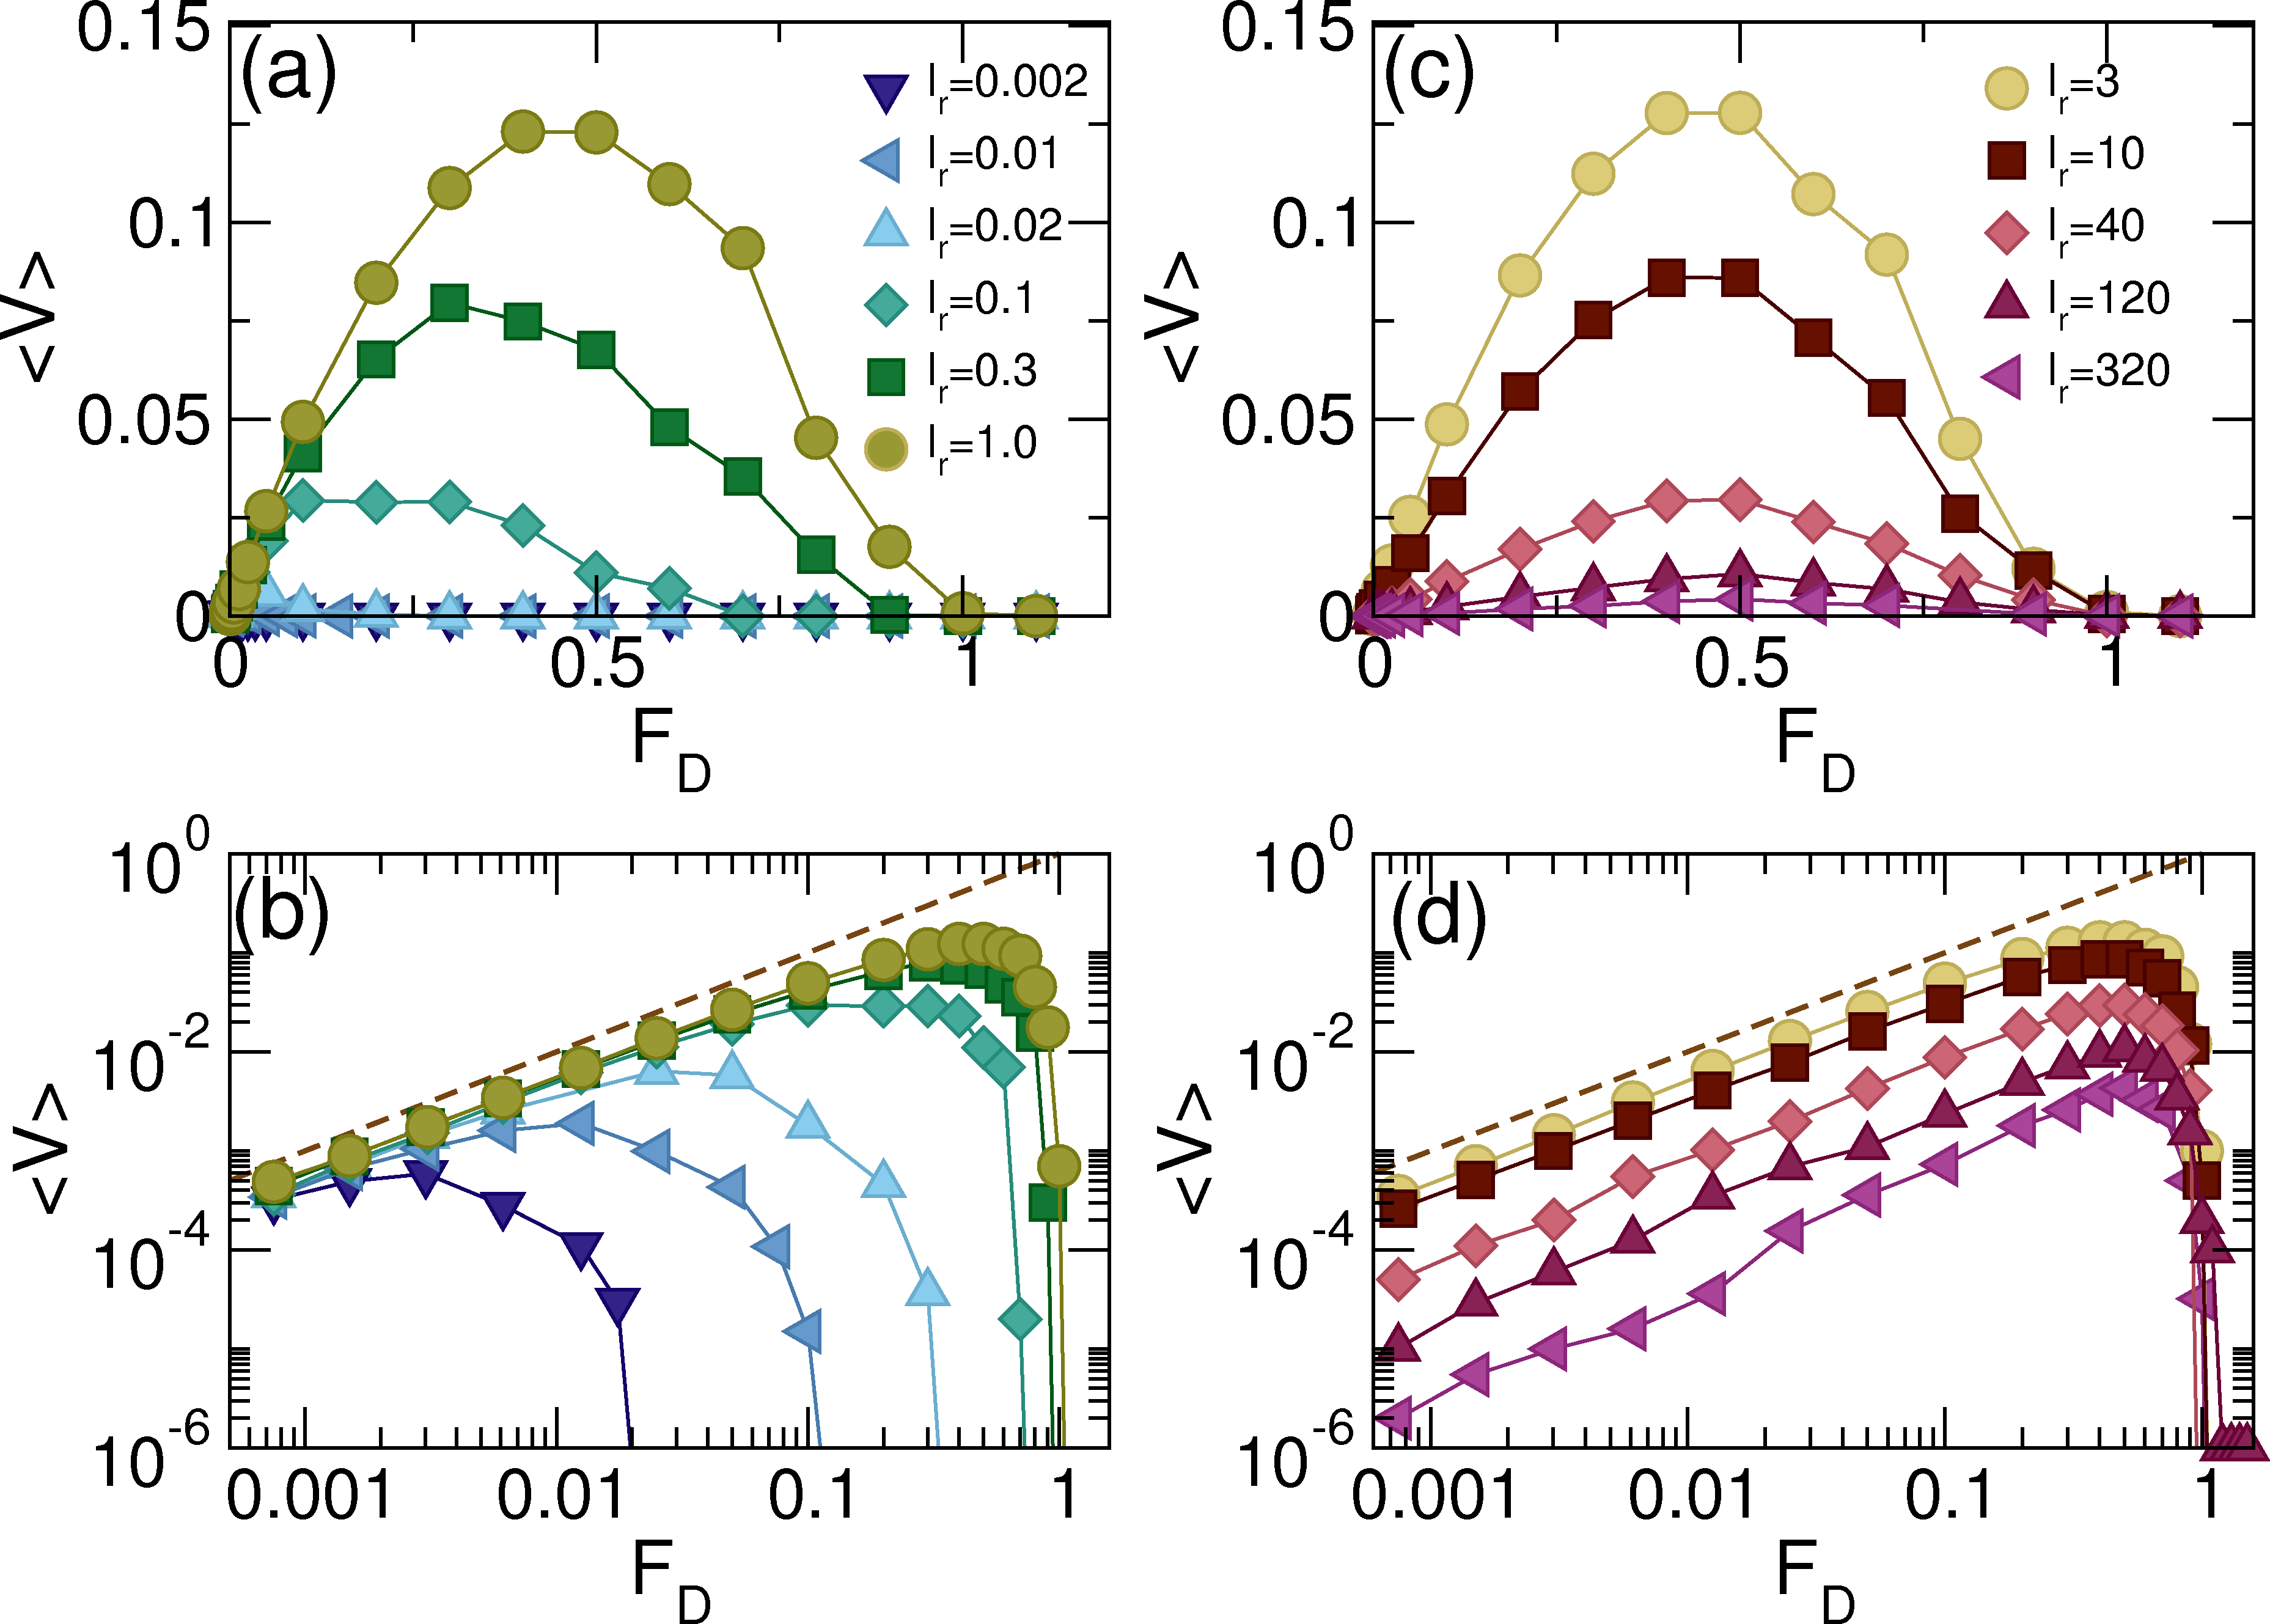
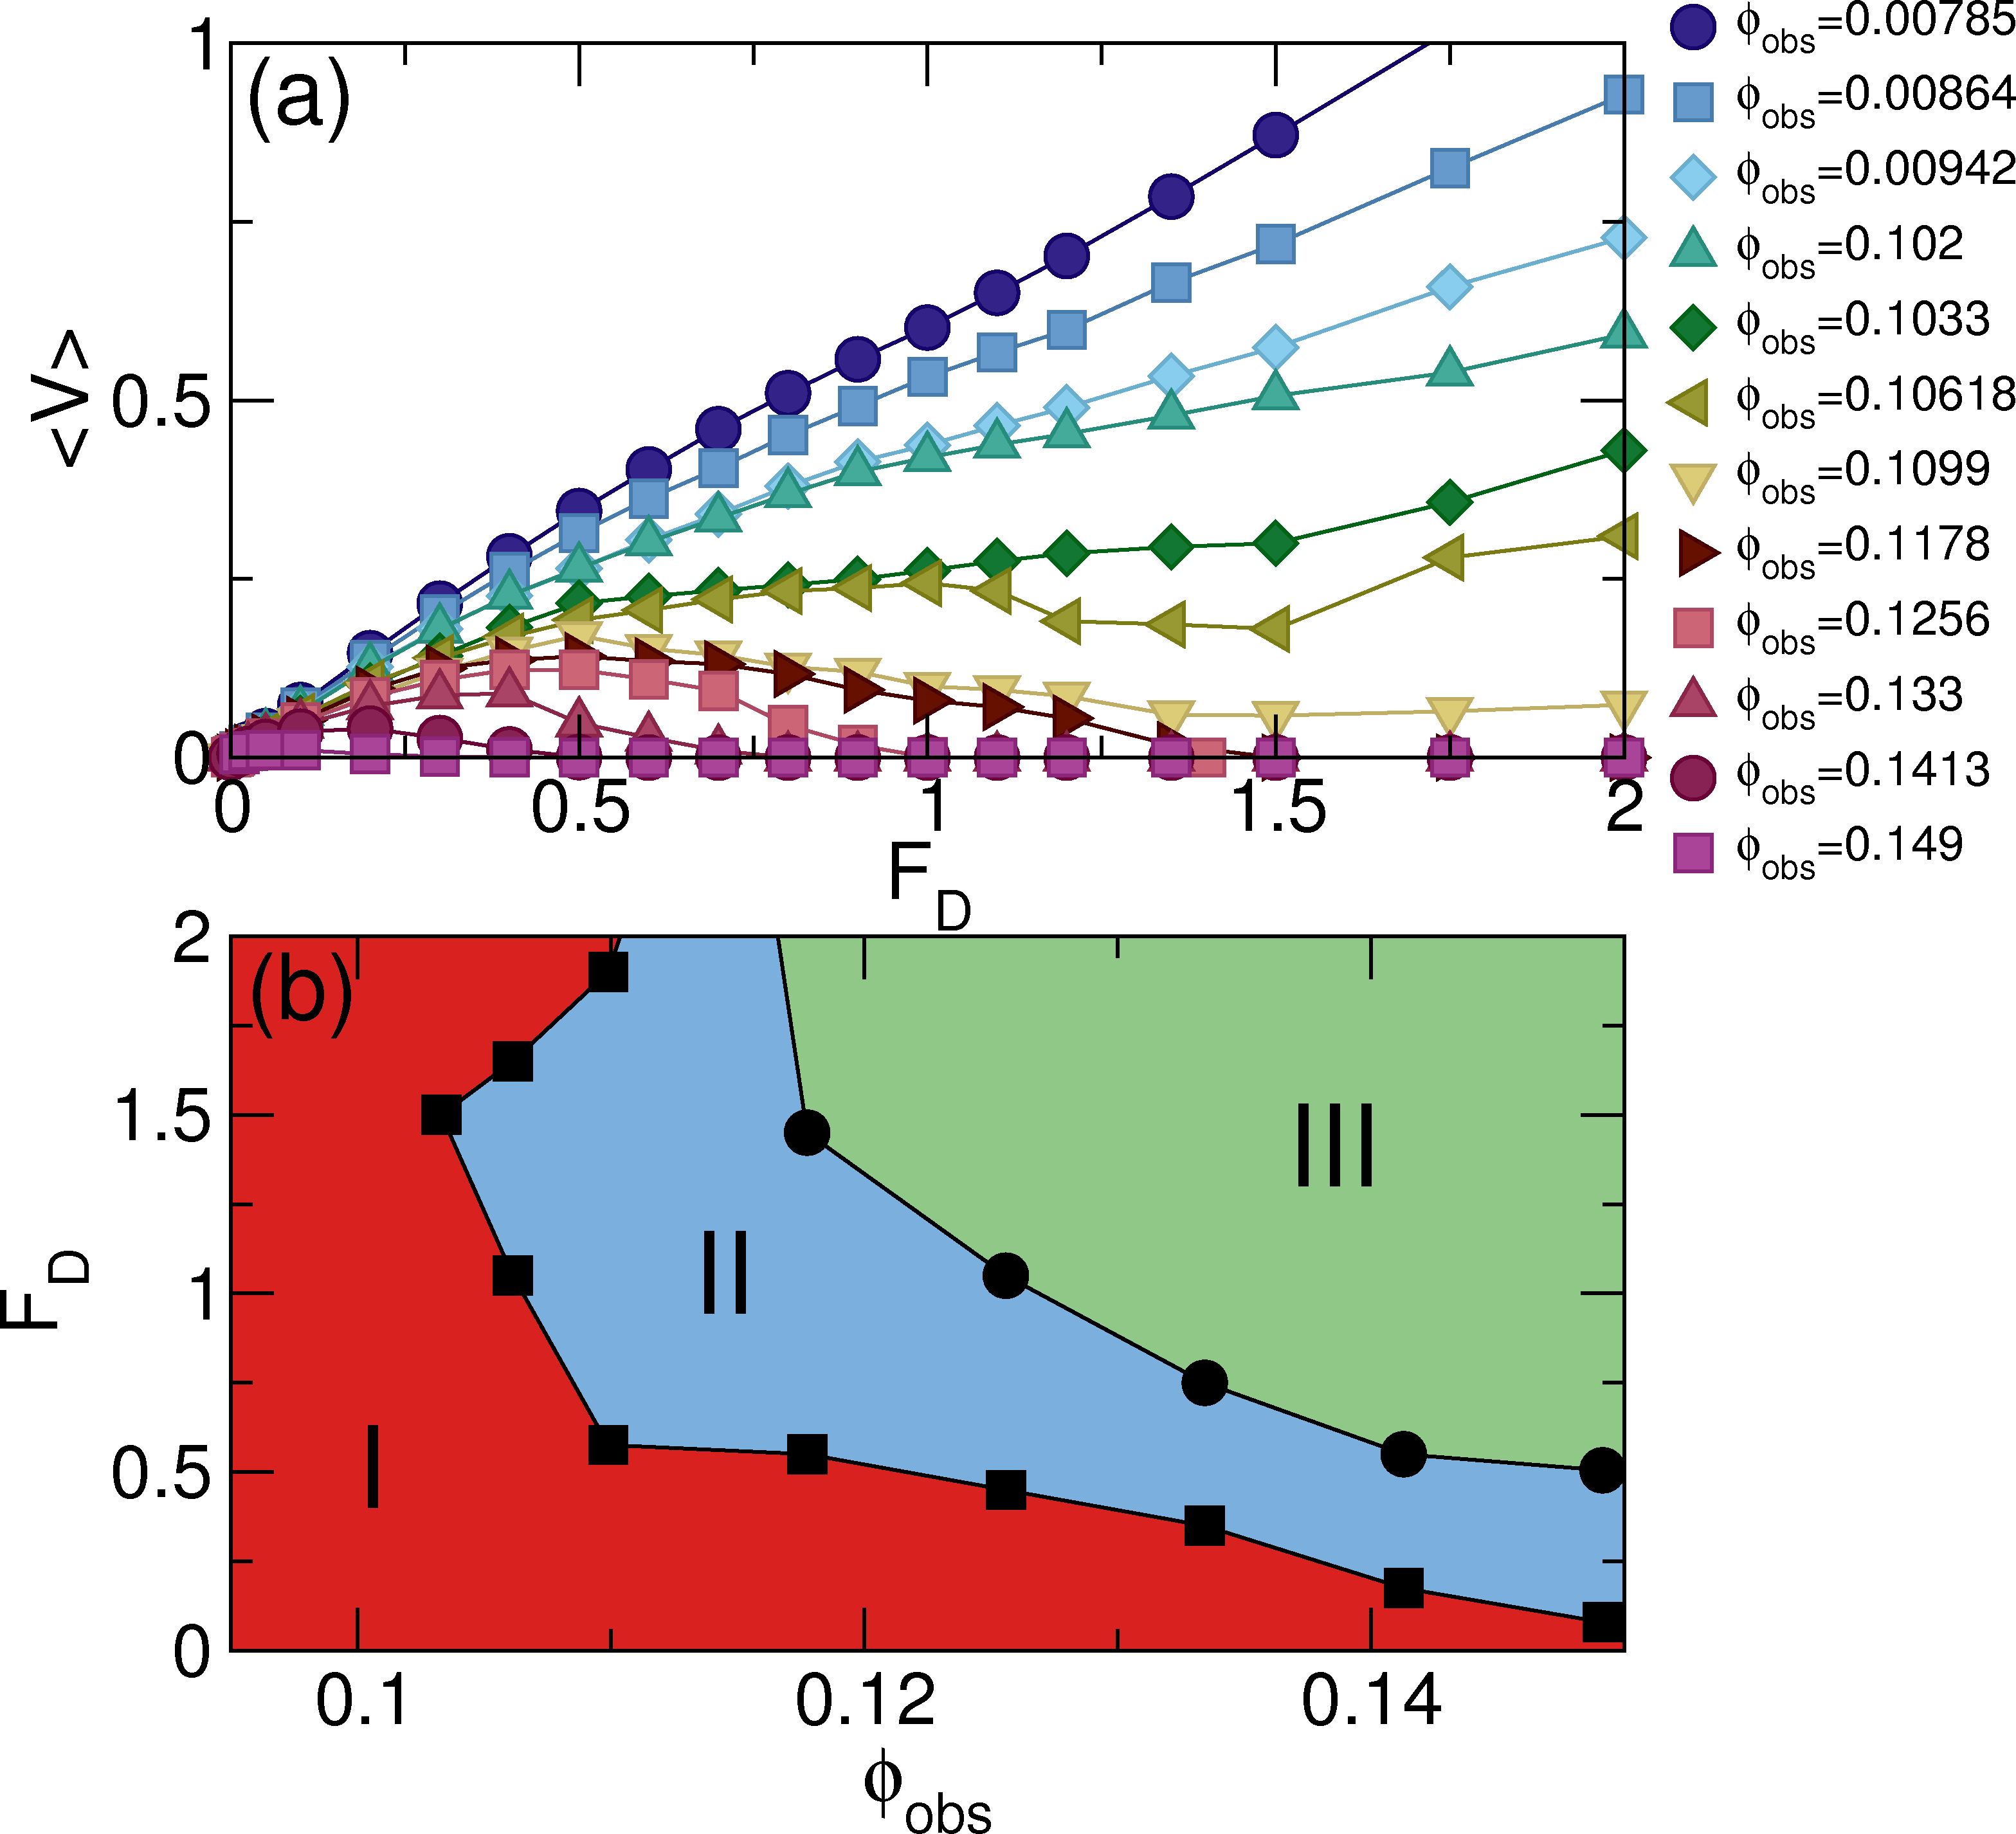
Journal of Physics: Condensed Matter 30, 015404 (2018)

Negative Differential Mobility and Trapping in Active Matter Systems

C. Reichhardt and C. J. O. Reichhardt

Theoretical Division and Center for Nonlinear Studies, Los Alamos National Laboratory, Los Alamos, New Mexico 87545, United States of America

E-mail: cjrx@lanl.gov
Received 5 October 2017, revised 17 November 2017
Accepted for publication 22 November 2017
Published 6 December 2017
Abstract
Using simulations, we examine the average velocity as a function of applied drift force for active matter particles moving through a random obstacle array. We find that for low drift force, there is an initial flow regime where the mobility increases linearly with drive, while for higher drift forces a regime of negative differential mobility appears in which the velocity decreases with increasing drive due to the trapping of active particles behind obstacles. A fully clogged regime exists at very high drift forces when all the particles are permanently trapped behind obstacles. We find for increasing activity that the overall mobility is nonmonotonic, with an enhancement of the mobility for small levels of activity and a decrease in mobility for large activity levels. We show how these effects evolve as a function of disk and obstacle density, active run length, drift force, and motor force.
Keywords: active matter, clogging, negative differential mobility

1. Introduction
2. Simulation
3. Results
3.1. Low versus high activity limit
3.2. Varied run length lr
3.3. Varied obstacle density
3.4. Varied motor force and running time
3.5. Crowding effects at higher disk densities
4. Discussion
5. Summary
References

1.  Introduction

There has been increasing interest in self-driven or active matter systems, which are often modeled as a collection of self-mobile disks with mobility represented by driven diffusion or run-and-tumble dynamics [1,2]. When disk-disk interactions are included, an activity-induced clustering or phase separation into a dense solid phase coexisting with a low density active gas phase can occur for sufficiently high activity and disk density. Such clustering effects occur for both driven diffusive [3,4,5,6,7,8] and run-and-tumble systems [3,7,8,9]. Studies of active matter systems generally focus on samples with featureless substrates, but recent work has addressed the behavior of active matter interacting with more complex environments [2], such as random [10,11,12] or periodic obstacle arrays [13,14,15], pinning arrays or rough substrates [15,16,17], and funnel arrays [18], as well as mixtures of active and passive particles [19]. In run-and-tumble disk systems, studies of the average flux through an obstacle array in the presence of an additional external drift force [10] show that for low activity or short run times, the active disks have Brownian characteristics and are easily trapped; however, for increasing run persistence length or activity, the trapping is reduced and the flux of disks through the system increases. Interestingly, when the run time or activity is large, the disk drift mobility is strongly reduced due to enhanced self-trapping of disks behind the obstacles and by each other. Other studies of active particles moving through an array of obstacles show that for increasing propulsion speed, the particles remain trapped behind obstacles for a longer time, and as a result the long time diffusion constant is decreased for high activity particles compared to passive or Brownian particles [12]. If the obstacles are replaced by a rough substrate, another study showed that the drift mobility of the particles increases with increasing run length since the self-clustering effect allows the particles to act like an effective larger-scale rigid object that couples only weakly to the substrate [17]. Studies of flocking active particles moving through obstacle arrays reveal nonmonotonic behavior as a function of disorder strength [20] and a disorder-induced flocking to non-flocking transition [11,21].
Here we examine run-and-tumble active matter disks in the presence of a random array of obstacles where we apply an external driving force and measure the long time average disk drift velocity in the direction of drive. While in previous work we considered a constant applied drift force [10], here we examine the effects of varied drift forces and compare the resulting velocity-force curves to those found in other systems that exhibit depinning, such as passive particles driven over random disorder [22]. Previous studies of passive or Brownian particles driven though an obstacle array showed that there can be a regime of negative differential mobility where the velocity decreases with increasing drive, and the velocity can even drop to zero in the limit of large drive [23,24,25]. Negative differential mobility also appears when the obstacles themselves are allowed to move [26,27,28]. Such effects can arise for driven particles in laminar flows [29], particles driven through glass formers [30], vortices in type-II superconductors moving through periodic pinning arrays [22,31,32], colloids moving on ordered pinning arrays [33], and in nonequilibrium states of certain types of semiconductors [34].
We specifically examine run-and-tumble driven disks, where a motor force Fmmi acts on disk i during a fixed running time τ in a randomly chosen direction mi. At the end of the running time, a new run begins with the motor force acting in a new randomly chosen direction. The disks move through a random array of obstacles under an external drive FDx, and we measure the average disk drift velocity 〈V〉 in the driving direction as a function of increasing FD. At low drives FD << Fm, the drift velocity 〈V〉 increases linearly with increasing FD, but we find that 〈V〉 reaches a maximum and then decreases with increasing FD due to the partial trapping of disks behind obstacles. For large enough drives, we observe a fully clogged state with 〈V〉 = 0, where Fcl denotes the drive above which complete clogging occurs. The value of Fcl increases with increasing activity and saturates for long run times, while the maximum value of 〈V〉 changes nonmonotonically as a function of run time. In some cases, a system with longer run times has lower mobility for small FD but higher mobility at large FD compared to a system with shorter run times. For fixed run time and increasing motor force Fm, we find that the transition from a linear dependence of 〈V〉 on Fm to a decrease in 〈V〉 with increasing Fm follows the line Fm=FD. When we increase the disk density, we observe crowding effects that reduce the overall mobility but can also increase the range of parameters for which negative differential mobility occurs.
The paper is organized as follows. In Section 2, we provide details of the simulation method. Section 3.1 describes differences in the behavior of the system in the low and high activity limits. In Section 3.2, we explore in more detail how the velocity-force curves change as the running length lr is varied, and how this correlates with the flow of the disks through the sample. The effect of varying the obstacle density in different activity limits is treated in Section 3.3, while the effect of varying the motor force and running time is described in Section 3.4. At higher disk densities we find crowding effects, as shown in Section 3.5. A discussion of possible future directions appears in Section 4, followed by a summary in Section 5.

2.  Simulation

We consider a two-dimensional system of size L ×L with periodic boundary conditions in the x and y directions, where L=50. Within the system we place Na active disks of radius R=0.5 and Nobs obstacles which are modeled as stationary disks of the same size as the active disks. The area coverage of the obstacles is ϕobs = NobsπR2/L2, the area coverage of the active disks is ϕa = NaπR2/L2, and the total area coverage is ϕtot = ϕobs + ϕa. The disk-disk interactions are modeled as a short range harmonic repulsion Fdd = k(d − 2R)Θ(d−2R)d where d is the distance between the disks, d is the displacement vector between the disks, k is the spring constant, and Θ is the Heaviside step function. The dynamics of an active disk i are governed by the following overdamped equation of motion: ηdri/dt = Faai + Fmi + Fobsi + FD where the damping constant η = 1.0. Here Faai=∑jiNaFddij is the interaction between active disks and Fobsi=∑kNobsFddik is the interaction between active disk i and the obstacles. Each mobile disk is driven by a motor force Fmi in the form of a constant force Fm applied in a random direction mi that changes after each run time τ. In the absence of any collisions, during a running time the motor force translates the disk a distance lr = Fmτδt, where δt = 0.002 is the simulation time step. When the value of Fmτ is chosen such that lr < R/2, giving a running distance that is less than half a disk radius, the behavior of the system is effectively thermal rather than active. The mobile disks experience an additional external driving force in the x direction, FD=FDx. After changing FD, we wait for at least 108 simulation time steps to ensure that we have reached a steady state flux before measuring the average drift velocity in the direction of drive, 〈V〉 = Na−1Naiv ·xi. We quantify the activity level of the disks in terms of lr and Fm.
Fig1.png
Figure 1: Average drift velocity 〈V〉 vs FD in samples with ϕobs = 0.1257 and Fm=0.5 for ϕa = 0.00785 (dark blue left triangles), 0.03146 (light blue circles), 0.0628 (green squares), and 0.1257 (red up triangles). (a) lr=0.01 in the low activity limit where the system behaves thermally. (b) Data from (a) on a log-log scale highlighting the negative differential mobility for ϕ = 0.00785, 0.03146, and 0.0628. (c) lr = 120 in the high activity limit where the ballistic component of the disk motion is important.(d) Data from (c) on a log-log scale. The dashed lines in panels (b) and (d) indicate the linear behavior 〈V〉 = FD in an obstacle-free system.

3.  Results

3.1.  Low versus high activity limit

We first compare the differences in the velocity-force curves between the low activity limit lr < 2.0, where the disk behavior is thermal in nature, and the high activity limit lr > 2.0, where the ballistic component of the disk motion is important. In Fig. 1(a) we plot 〈V〉 versus FD for a system with Fm = 0.5, ϕobs=0.1257, and a low activity value of lr = 0.1 at ϕa = 0.00785, 0.03146, 0.0628, and 0.1257, and in Fig. 1(b) we show the same data on a log-log scale. At the lowest density of ϕa = 0.00785, the behavior falls in the single active disk limit and 〈V〉 increases linearly with FD before reaching a maximum near FD = 0.03 and then decreasing to 〈V〉 = 0.0 for FD ≥ 0.21. For the low density ϕa = 0.03146, 〈V〉 reaches a maximum near FD = 0.3 and drops to zero for FD ≥ 0.71. In both cases the system exhibits what is called negative differential mobility (NDM), where the average velocity decreases with increasing FD, while at high enough drives the disks reach a pinned or clogged state. For an intermediate density of ϕ = 0.0628 there is still a region of NDM for FD > 0.8; however, the velocity remains finite up to the maximum drive FD/Fm = 5 that we consider. For the highest density of ϕ = 0.1257, the number of disks equals the number of obstacles, the velocity monotonically increases with FD, and the NDM is lost. In Fig. 1(b) the dashed line indicates the linear behavior 〈V〉 = FD of an obstacle-free system. For all values of ϕa, we find the same linear increase of 〈V〉 with FD for small FD, and the value of FD at which NDM appears shifts to higher values of FD as ϕa increases.
In Fig. 2 we show the trajectories of the active disks at three different values of FD for the ϕa=0.03146 system from the low activity system Fig. 1(a,b). At low FD=0.0125 in Fig. 2(a), 〈V〉 increases with increasing FD. The disk trajectories are space filling, and FD/Fm = 0.025 is small enough that when a disk becomes trapped behind an obstacle, the motor force is large enough to move the disk in the direction opposite to the drive, permitting the disk to work its way around the obstacle. As a result, the active disks can easily explore nearly all the possible paths through the obstacle array. As FD increases, the ability of the disks to back away from an obstacle is reduced, and the amount of time disks spend trapped behind obstacles increases, as illustrated in Fig. 2(b) for an intermediate drive of FD = 0.6, corresponding to FD/Fm = 1.2, where the system exhibits NDM. Here there are several locations in which the disks become trapped for long periods of time. As FD is further increased, more disks become trapped and 〈V〉 diminishes, as shown in Fig. 2(c) for a high drive of FD = 1.0, where all the active disks are permanently trapped and 〈V〉 = 0. Two effects reduce the trapping susceptibility as ϕa increases. Once a portion of the disks becomes trapped behind the most confining obstacle configurations, additional active disks can no longer be trapped at these same locations, meaning that the "deepest" traps are effectively inactivated. In addition, at locations where N multiple active disks are trapped one behind another, there is a finite probability that the motor forces of these disks will simultaneously be oriented in the direction opposite to that of the drift force, permitting the disks to escape, so that complete trapping will occur only when FD > N Fm.
Fig2.png
Figure 2: The obstacle positions (red filled circles), active disks (dark blue open circles), and trajectories (light blue lines) for the lr=0.01 low activity system from Fig. 1(a,b) with ϕobs = 0.1257 and ϕa = 0.03146. (a) A low drive of FD = 0.0125, in the regime where 〈V〉 increases with increasing FD. (b) An intermediate drive of FD = 0.6, in the regime where partial trapping of active disks behind the obstacles occurs and the system exhibits negative differential mobility. (c) A high drive of FD = 1.0, in the regime where 〈V〉 = 0 and the system is in a completely clogged state.
Fig3.png
Figure 3: The obstacle positions (red filed circles), active disks (dark blue open circles), and trajectories (light blue lines) for the lr=120 high activity system from Fig. 1(c,d) with ϕobs = 0.1257 and ϕa = 0.03146. (a) A low drive of FD = 0.0125, where the disks move in straight lines. (b) The same low drive as in (a) drawn without the trajectories, showing that nearly all of the active disks are in contact with an obstacle. (c) A high drive of FD = 1.0, where there is increased trapping but 〈V〉 remains finite, unlike the low activity lr = 0.01 case illustrated in Fig. 2(c) where complete trapping occurs at high drive.
In the high activity limit of lr=120 for the same system with ϕa=0.03146, the plot of 〈V〉 versus FD in Fig. 1(c,d) shows the same general features as in the low activity limit of ld = 0.01. The value of FD at which 〈V〉 reaches zero is shifted upward when the activity is high and the magnitude of 〈V〉 for a given FD is significantly reduced, as indicated by comparing the curves in Fig. 1(d) to the dashed line which is the flow expected in an obstacle-free system. Figure 3(a) shows the active disk trajectories for the high activity system at a low drive of FD = 0.0125. In this regime, 〈V〉 increases with increasing FD; however, 〈V〉 is smaller by nearly a factor of 20 than in the low activity lr = 0.01 case illustrated in Fig. 2(a). The active disks in Fig. 3(a) are not strongly affected by the external drive and move in straight lines while running; however, upon encountering an obstacle, the active disk pushes against it and becomes self-trapped, reducing the mobility of the system. To more clearly demonstrate the self-trapping effect that occurs for large run lengths, in Fig. 3(b) we plot the same low drive and high activity snapshot of the active disk and obstacle positions without trajectories, and find that nearly all of the active disks are in contact with an obstacle. At a high drive of FD=1.0, as illustrated in Fig. 3(c), 〈V〉 is finite in the high activity lr=120 system, whereas 〈V〉 = 0 for a low activity of lr=0.01. Here, although a considerable amount of disk trapping occurs, the longer run times allow some of the disks to become mobile, giving a nonzero contribution to 〈V〉.
Fig4.png
Figure 4: 〈V〉 vs FD in samples with ϕobs = 0.1257, Fm=0.5, and ϕa = 0.03146. 
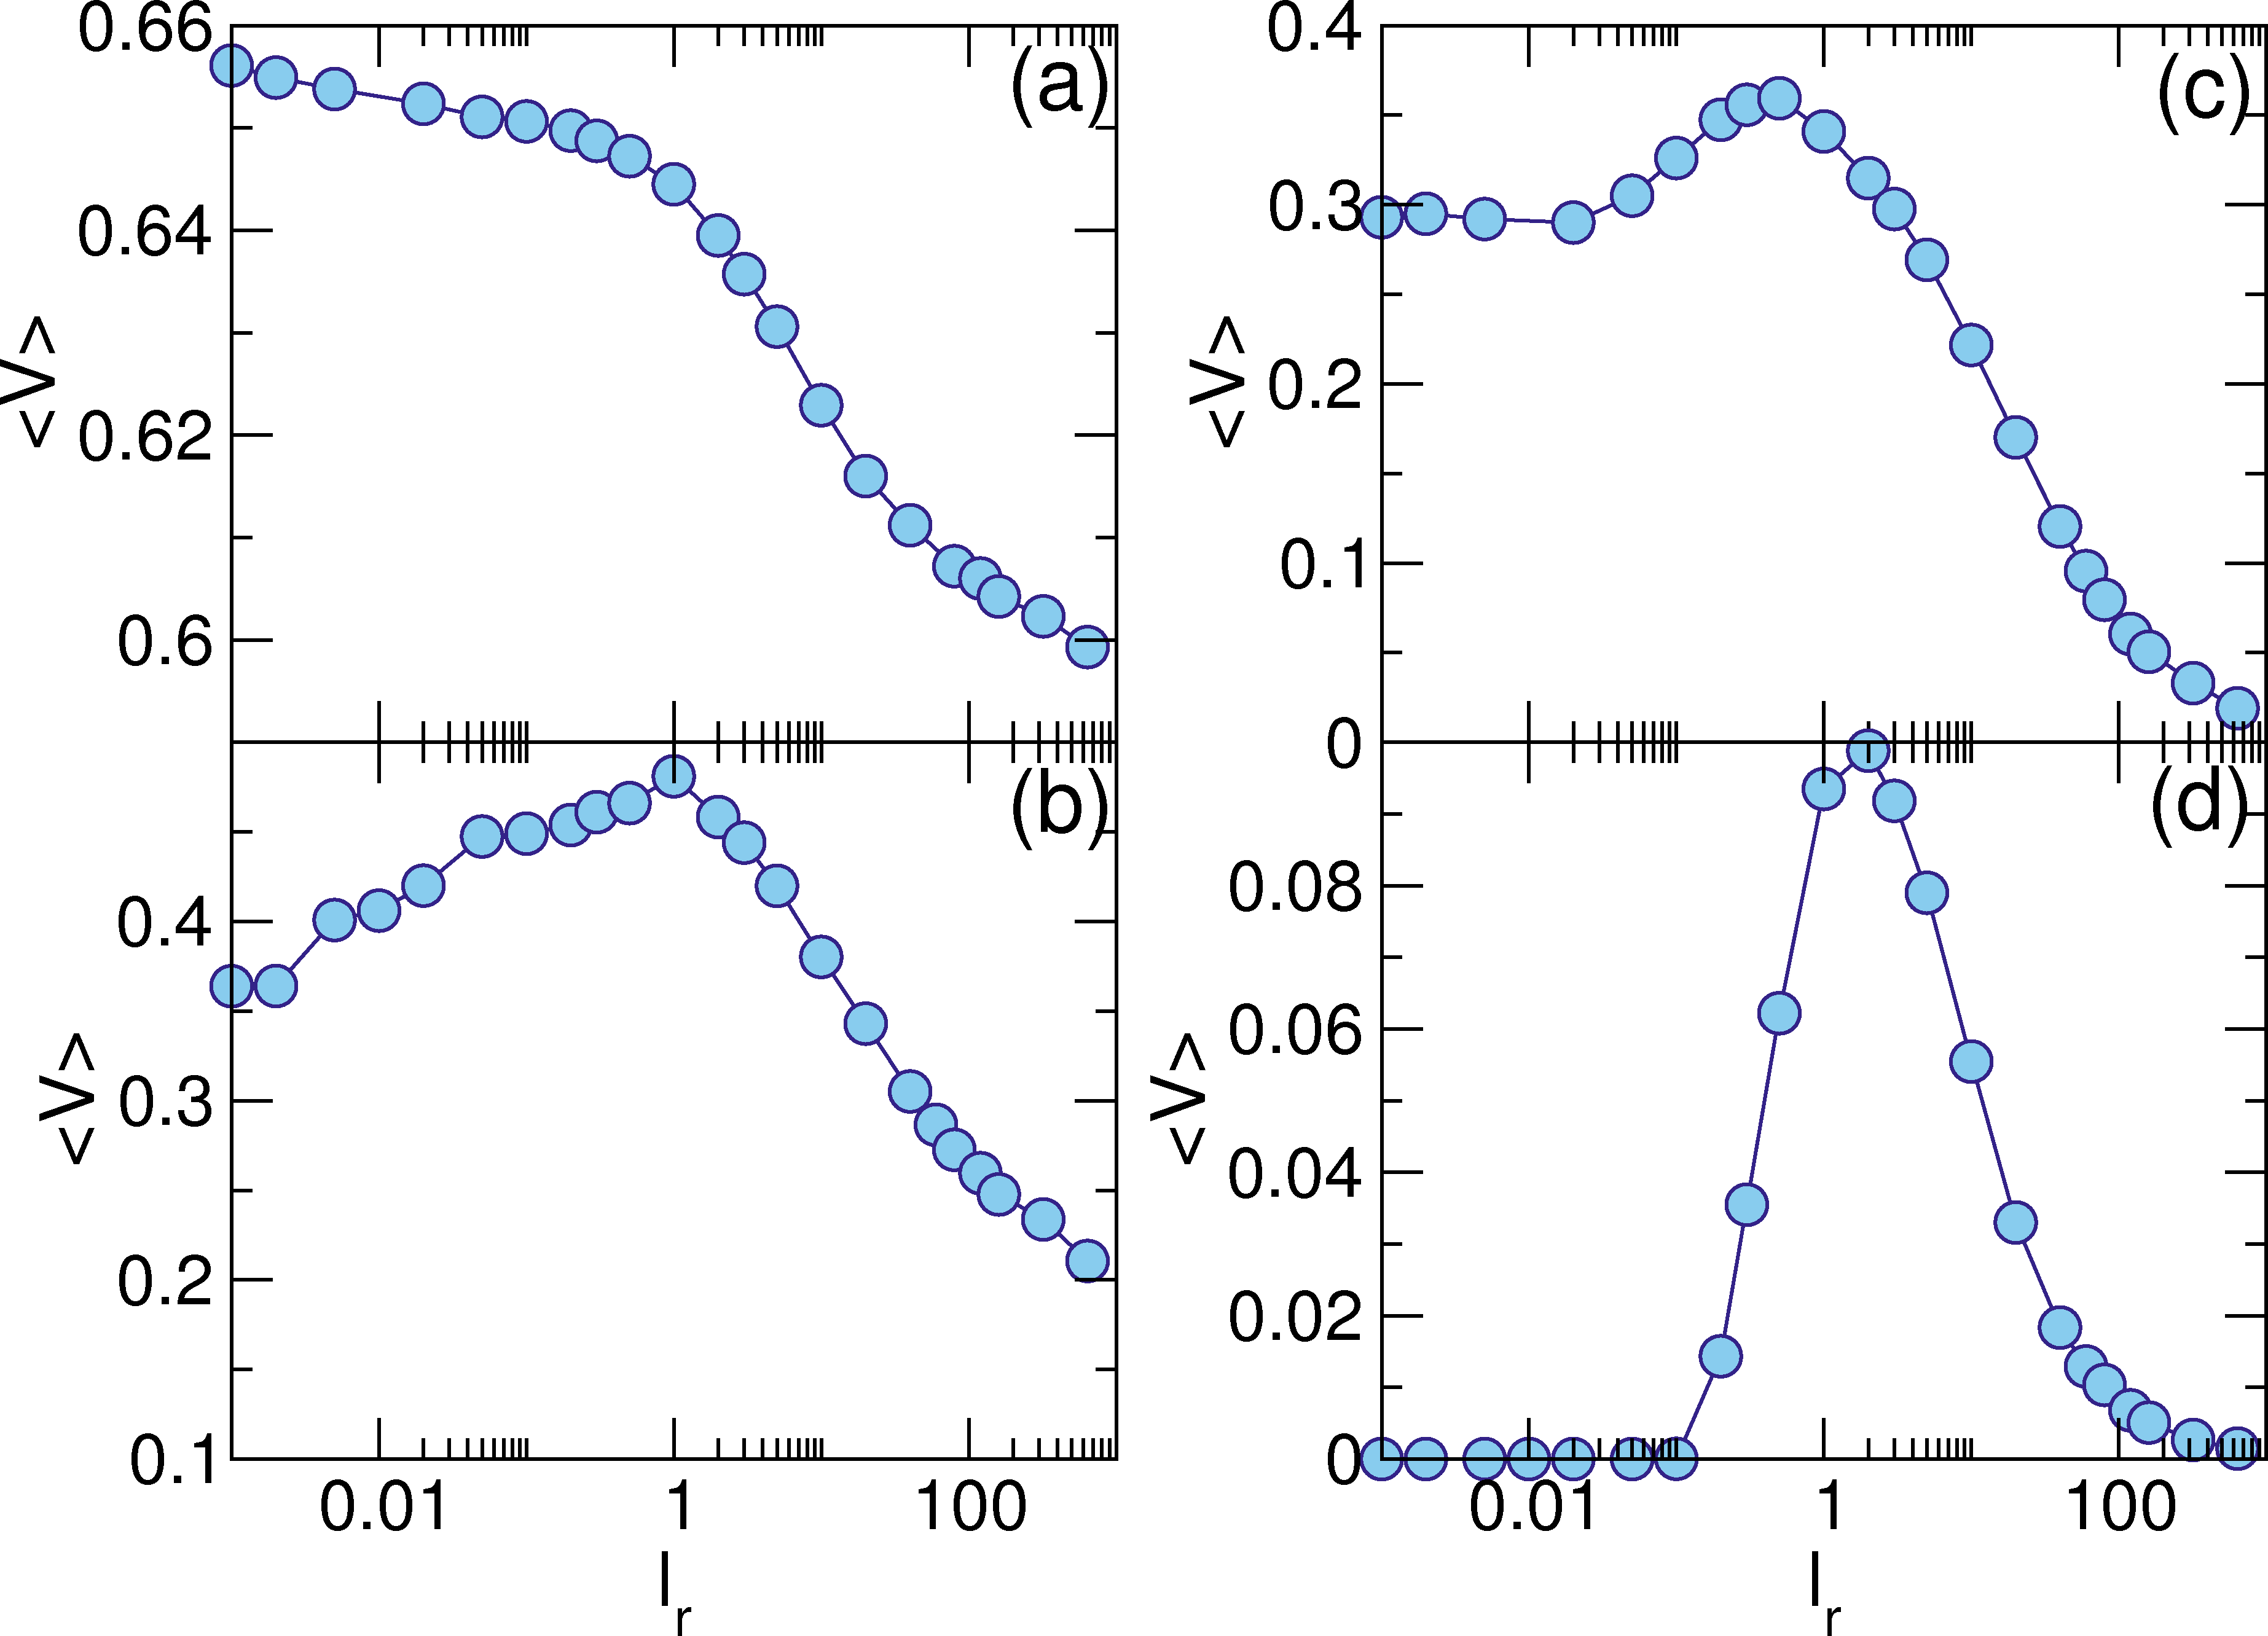
(a) The low activity regime where 〈V〉 increases with increasing lr for lr = 0.002 (dark blue down triangles), 0.01 (medium blue left triangles), 0.02 (light blue up triangles), 0.1 (teal diamonds), 0.3 (dark green squares), and 1.0 (light green circles), from bottom to top. 
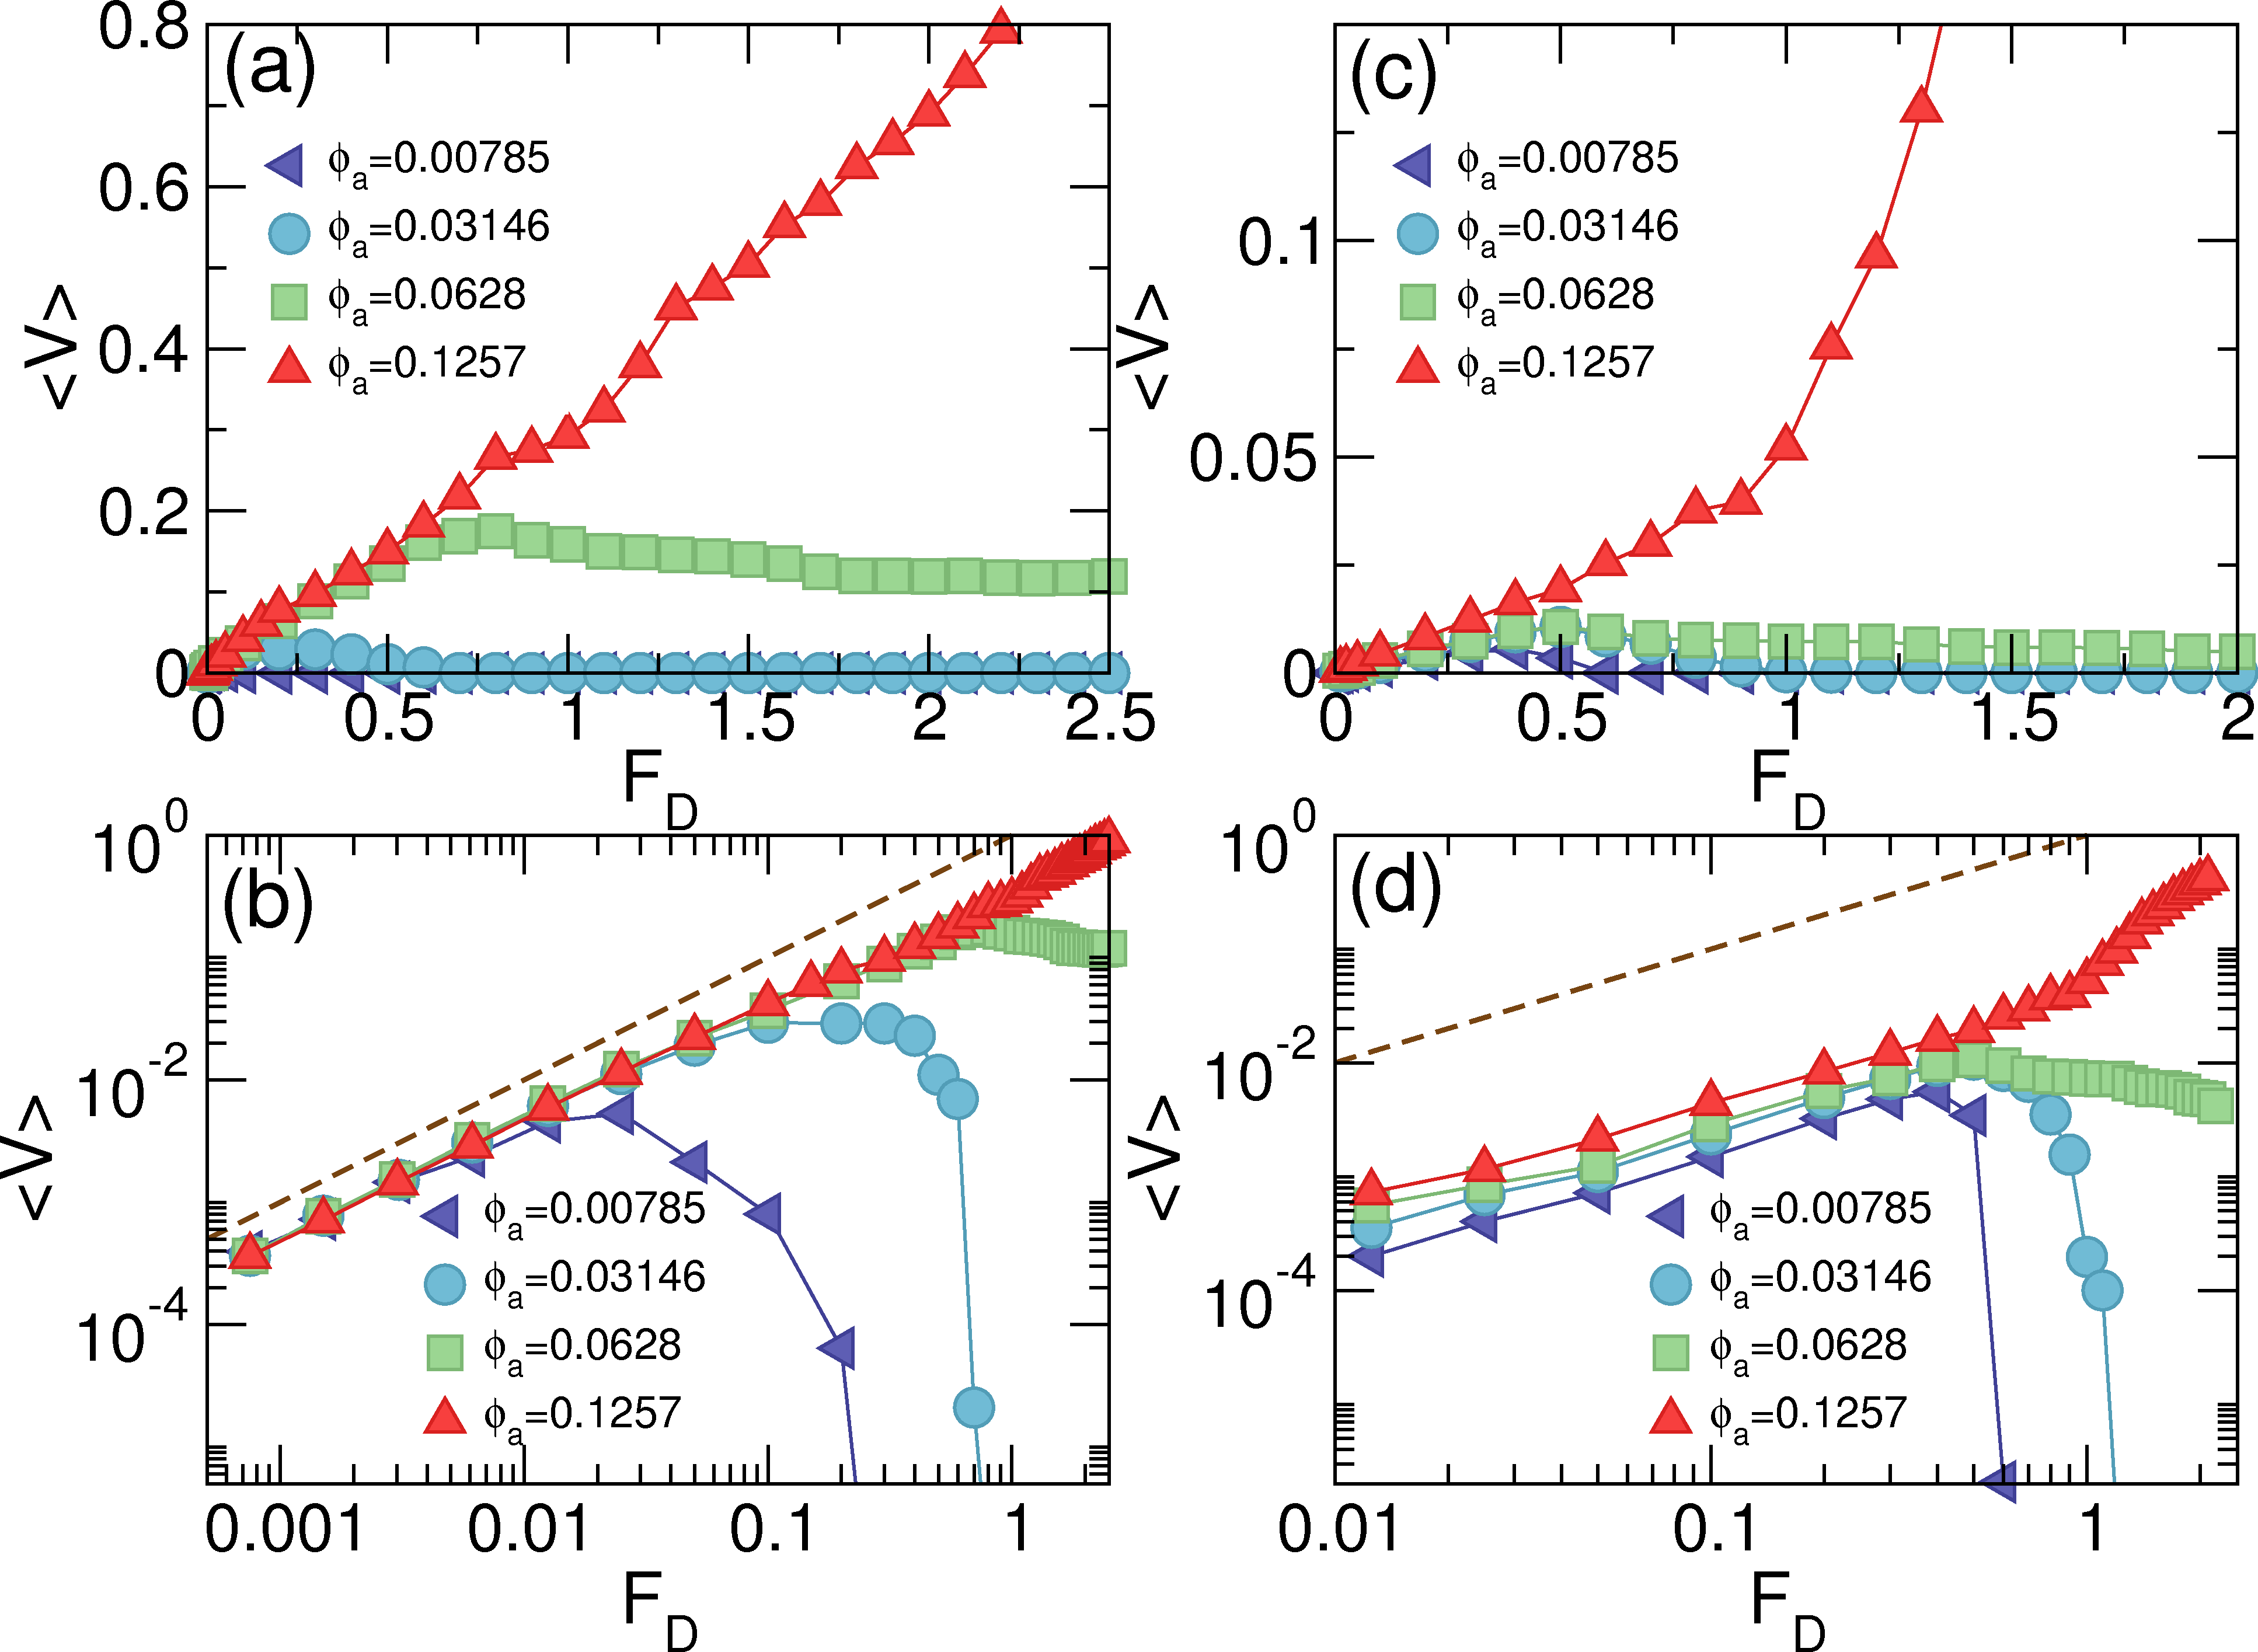
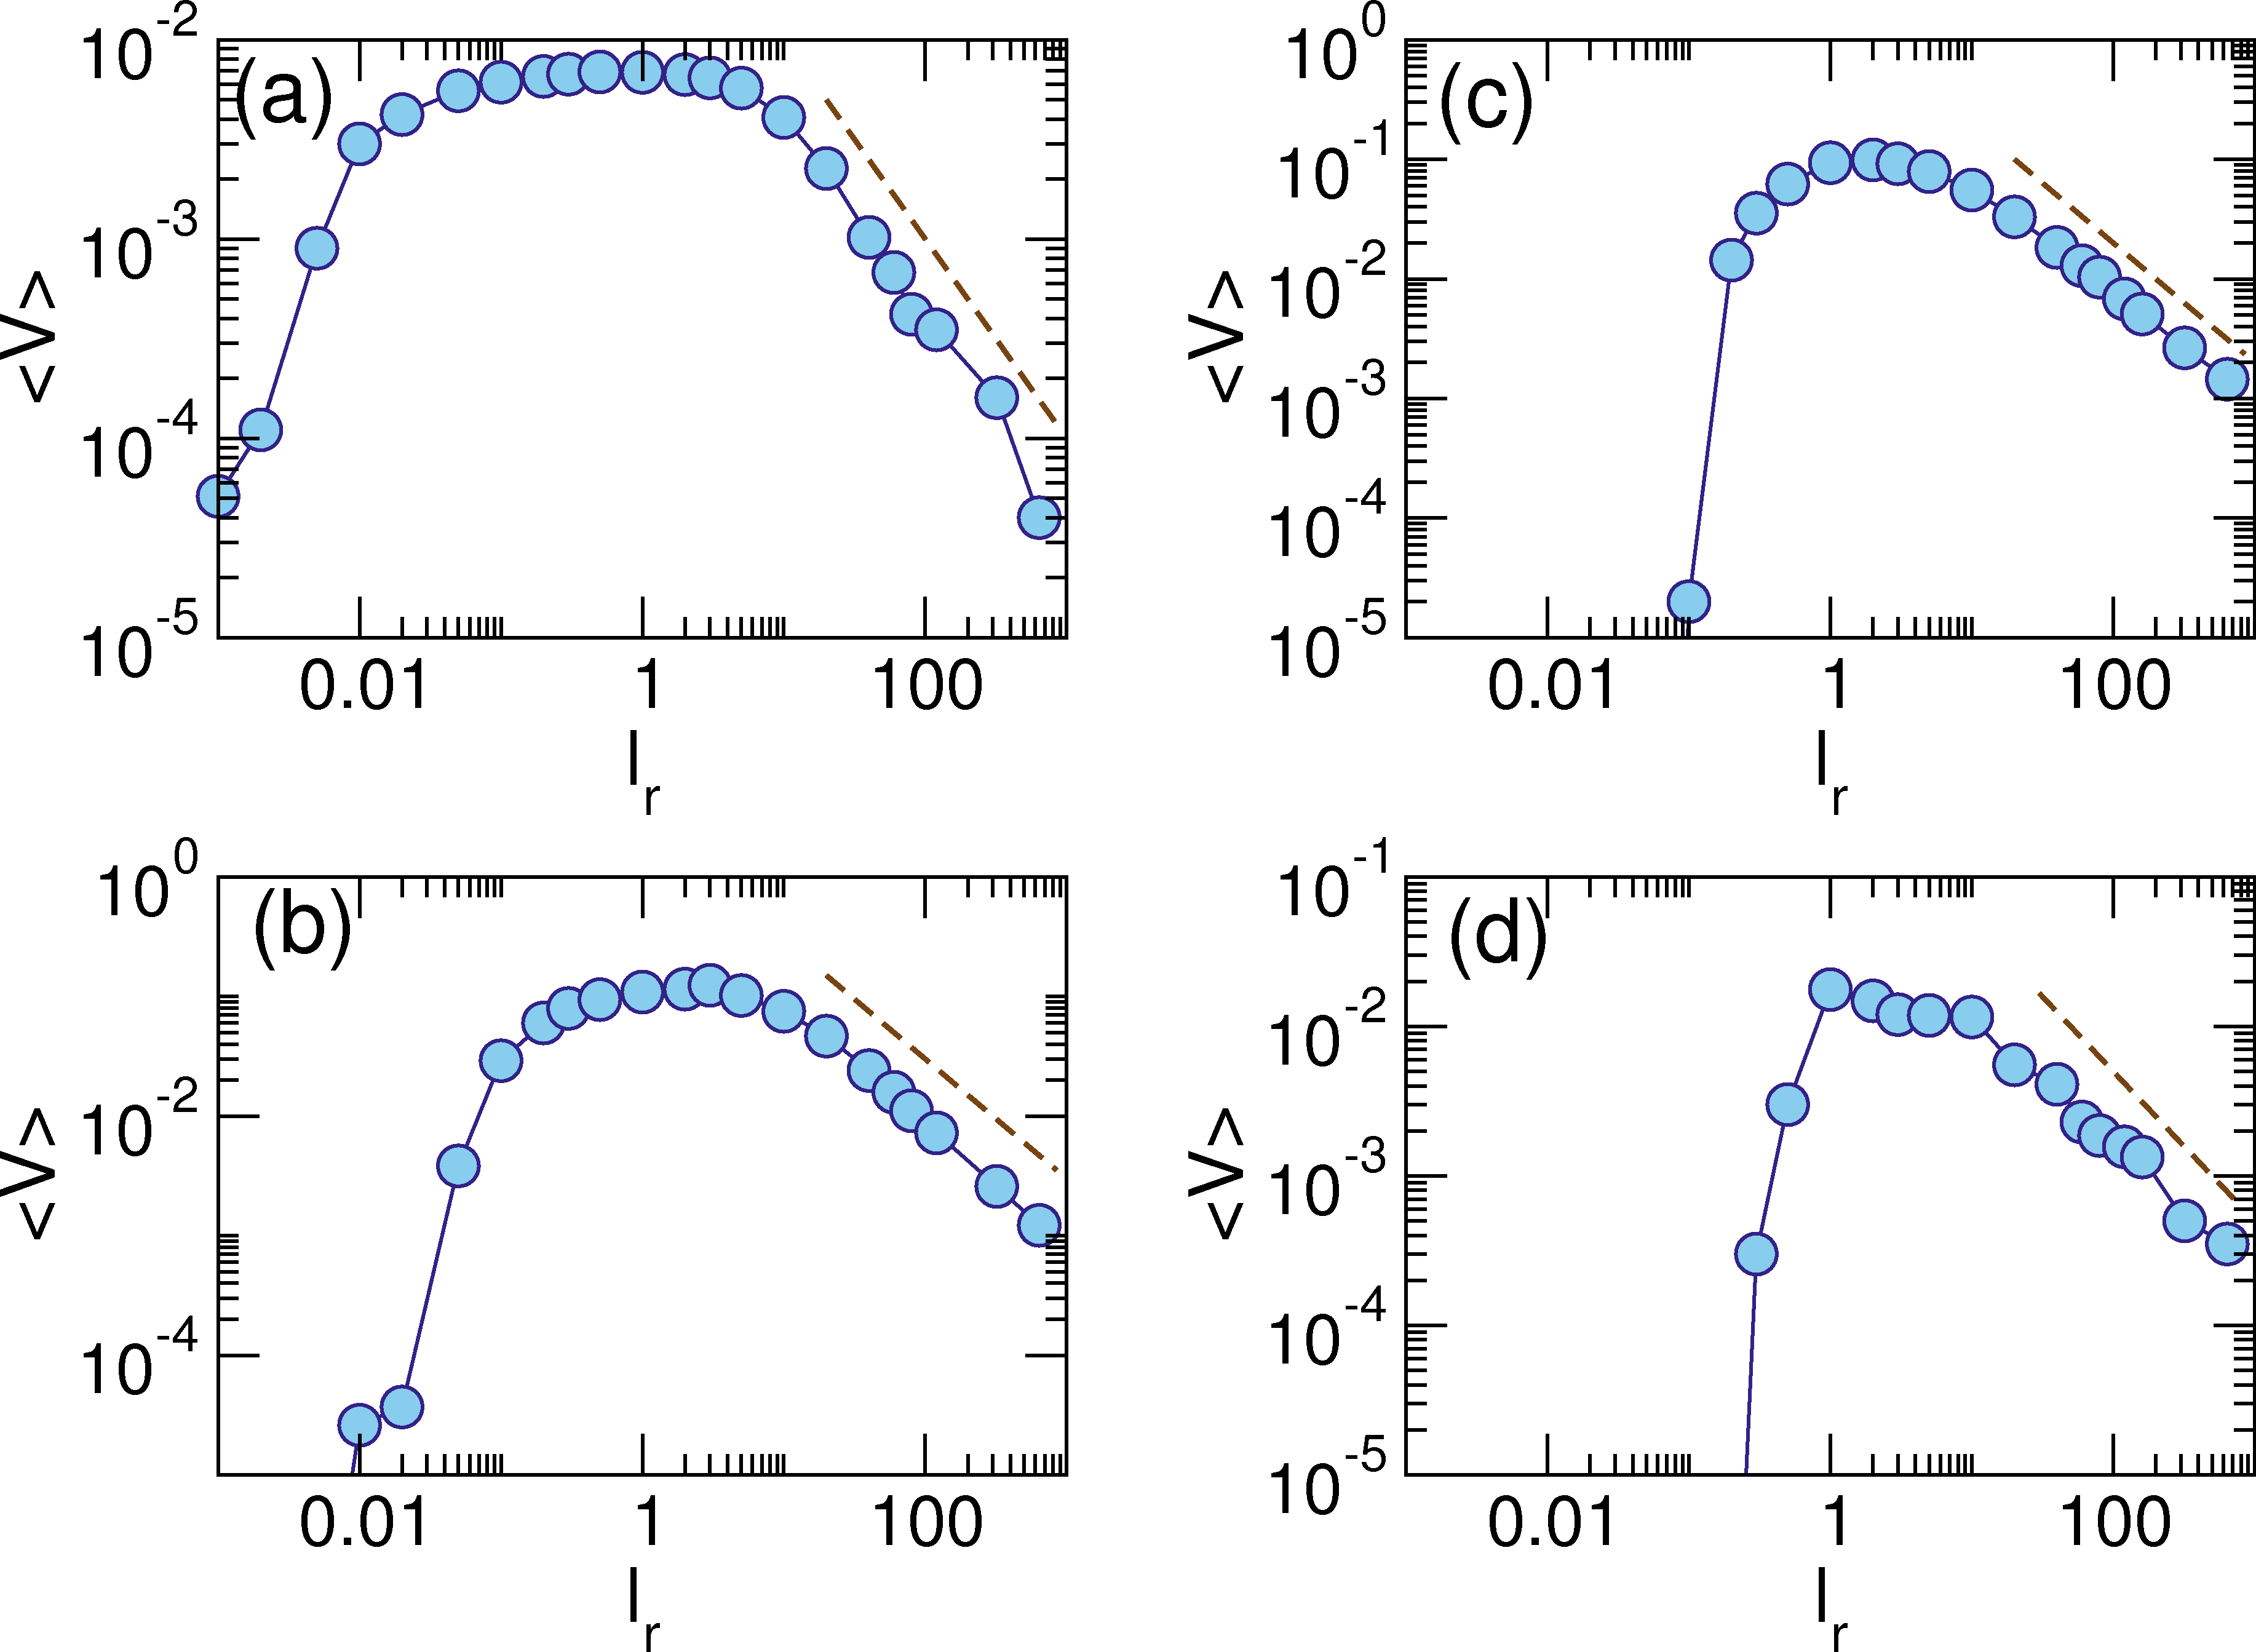
(b) The low activity regime curves from panel (a) plotted on a log-log scale. The dashed line indicates the obstacle-free limit of 〈V〉 = FD. Here 〈V〉 increases with increasing lr. (c) 〈V〉 vs FD for the same system in the high activity regime where 〈V〉 deceases with increasing lr at lr = 3 (yellow circles), 10 (dark red squares), 40 (light pink diamonds), 120 (dark pink up triangles), and 320 (magenta triangles), from top to bottom. (d) The high activity curves from panel (a) plotted on a log-log scale. The dashed line indicates the obstacle-free limit of 〈V〉 = FD. Here 〈V〉 decreases with increasing lr.

3.2.  Varied run length lr

To illustrate how lr affects the shape of the velocity-force curves, in Fig. 4(a) we plot 〈V〉 versus FD for a sample with ϕobs = 0.1257, ϕa = 0.03146, and Fm = 0.5 at low activity lr values ranging from lr=0.002 to lr=1.0. The same curves are shown on a log-log scale in Fig. 4(b), where the dashed line indicates the obstacle-free limit 〈V〉 = FD. We note that for non-active disks with lr = 0, 〈V〉 = 0 for all drive values at this disk density. Three trends emerge from the low activity data. There is an overall increase in 〈V〉 with increasing lr for all values of FD. Additionally, both the maximum value of 〈V〉 and the drive at which 〈V〉 reaches zero shift to higher values of FD with increasing lr.
Figure 4(c) shows 〈V〉 versus FD in the same sample in the high activity regime for lr=3 to lr=320, and in Fig. 4(d) the same curves are plotted on a log-log scale. In this high activity regime there is an overall decrease in 〈V〉 with increasing lr for all values of FD. The drive at which 〈V〉 reaches zero has its largest value of FD=1.0 for lr=1.0 and decreases with increasing lr for lr > 1.0. In the limit lr → ∞, 〈V〉 = 0 for all FD since fluctuations in the disk motion are eliminated, so the system cannot escape from a clogged state. This is similar to what occurs in the lr=0 nonactive disk system.
Fig5.png
Figure 5: The obstacle positions (red filled circles), active disks (dark blue open circles), and trajectories (light blue lines) for the system in Fig. 4(a) at ϕobs = 0.1257, Fm=0.5, ϕa = 0.03146, and FD = 0.5. (a) In the low activity limit at lr = 0.02, most disks are trapped. (b) In the high activity limit at lr = 3.0, the flow through the sample is optimized.
In Fig. 5(a) we illustrate the active disk trajectories for the system in Fig. 4 in the low activity limit lr = 0.02 at an intermediate drive of FD = 0.5, where most of the disks are trapped. At later times, all the disks become trapped and 〈V〉 = 0. In Fig. 5(b) we show the same system with a high activity of lr=3.0 at the same intermediate drive FD=0.5, where 〈V〉 passes through its maximum value in Fig. 4(c,d). Here the disks can move easily through the system and the amount of trapping is significantly reduced. At higher values of FD more trapping occurs, and for large enough FD, 〈V〉 = 0.
Fig6.png
Figure 6: The drift velocity 〈V〉 vs FD for the system in Fig. 3 with ϕobs = 0.1257, Fm=0.5, and ϕa = 0.03146. (a) A low activity of lr = 0.1 (blue circles) compared to a high activity of lr = 10 (magenta squares). (b) A low activity of lr = 0.1 (blue circles) compared to a higher activity of lr = 40 (green squares). In both cases there is a crossing of the curves. These results suggest that it should be possible to mix particles of different activity by setting FD to the value where the curves cross, or to fractionate particles of different activity by setting FD to the value at which the difference between the curves is greatest.
Fig7.png
Figure 7: 〈V〉 vs lr for samples with ϕobs = 0.1257, Fm=0.5, and ϕa = 0.03146. (a) A very low drive of FD = 0.0125. (b) A low drive of FD = 0.3. (c) A high drive of FD = 0.7. (d) A very high drive of FD = 0.9. Dashed lines indicate fits to 〈V〉 ∝ l−1r. The response can be divided into a low activity regime lr < 2 where 〈V〉 increases with increasing lr and a high activity regime lr > 2 where 〈V〉 decreases with increasing lr.
Fig8.png
Figure 8: Dynamic phase diagrams. Phase I (red) is the ohmic flow regime in which 〈V〉 increases with increasing FD. Phase II (blue) is the partial trapping regime where NDM occurs. Phase III (green) is the complete clogging regime in which 〈V〉 = 0. (a) Dynamic phase diagram as a function of FD vs lr for a system with ϕobs = 0.1257, ϕa = 0.03146, and Fm = 0.5. The crossover from the low activity regime to the high activity regime appears as a flattening of the II-III transition line above lr = 2. (b) Dynamic phase diagram as a function of FD vs ϕtot for ϕobs = 0.1257 and Fm = 0.5.
The value of lr that maximizes the flux through the system depends strongly on FD. In Fig. 6(a) we plot 〈V〉 versus FD for the system in Fig. 4 at a low activity of lr = 0.1 and a high activity of lr = 10. For small drives FD < 0.1, 〈V〉 is larger in the low activity lr=0.1 system than in the high activity lr=10 system, while for larger drives FD > 0.1, the situation is reversed and 〈V 〉 is largest in the high activity lr=10 system. A comparison of 〈V〉 versus FD for a low activity of lr=0.1 and a higher activity of lr=40 appears in Fig. 6(b), where 〈V 〉 is larger in the low activity lr=0.1 system for small drives FD < 0.3 and larger in the high activity lr=40 system for larger drives FD > 0.3, while the maximum value of 〈V〉 is nearly the same for both values of lr. This result has implications for active particle separation or mixing, and indicates that a less active particle species would move faster under a drift force at smaller FD than a more active particle species. At larger FD the reverse would occur, with the less active species becoming immobile while the more active particles are still able to flow through the system. The curves in Fig. 6 also indicate that is possible to tune FD such that active particle species with very different activity levels drift at equal values of 〈V〉, such as by setting FD=0.3 for the low activity lr=0.1 and high activity lr=40 disks in Fig. 6(b). It is possible that certain living systems such as bacteria subjected to an external drift may actually lower their activity in order to move through a heterogeneous environment if the external flow is weak, while if there is a strong drift flow, an increase in the activity level would improve the mobility.
In Fig. 7 we plot 〈V〉 versus lr for the system in Fig. 1 with ϕobs = 0.1257, Fm=0.5, and ϕa = 0.03146 for different values of FD. For a very low drive of FD = 0.0125 in Fig. 7(a), 〈V〉 initially increases with increasing lr before reaching a maximum value at lr = 1.0, after which it drops by several orders of magnitude as lr → 320. At a low drive of FD=0.3 in Fig. 7(b), a high drive of FD=0.7 in Fig. 7(c), and a very high drive of FD=0.9 in Fig. 7(d), 〈V〉 = 0 at small values of lr, and as lr increases, 〈V〉 passes through a maximum value before decreasing again. In the high activity lr > 2 regime where 〈V〉 is a decreasing function of lr, the drift velocity approximately follows the form 〈V〉 ∝ 1/lr, as indicated by the fits in each panel. This is distinct from the behavior in the low activity lr < 2 regime where 〈V〉 increases with increasing lr.
In Fig. 8(a) we show the evolution of the three different phases as a function of FD versus lr for a system with ϕobs = 0.1257, ϕa = 0.03146, and Fm = 0.5. In phase I, the ohmic flow regime, 〈V〉 increases with increasing FD. In phase II, partial trapping occurs and we observe NDM. Phase III is the completely clogged regime with 〈V〉 = 0. The extent of phase I grows as lr increases until the I-II boundary saturates at large lr to the value FD=0.5, corresponding to FD/Fm=1.0. Similar behavior appears for phase II, with a saturation of the II-III boundary for lr > 2 to FD = 1.0. The onset of phase III drops to FD = 0 when lr = 0, indicating that for this density, nonactive disks are permanently clogged. In Fig. 8(b) we plot a dynamic phase diagram as a function of FD versus ϕtot, where we vary ϕtot by fixing ϕobs = 0.1257 and changing ϕa. Phase III disappears for ϕtot > 0.17, and the extent of phase I increases as the ratio ϕaobs of active disks to obstacles increases.
Fig9.png
Figure 9: 〈V〉 vs lr for samples with fixed ϕtot = 0.157 and varied ϕobs. (a) Dilute obstacles at ϕobs = 0.03146. (b) Moderately dilute obstacles at ϕobs=0.0628. (c) Moderately dense obstacles at ϕobs=0.09424. (d) Dense obstacles at ϕobs=0.1257. In all cases there is a crossover from the low activity limit for lr < 2 to the high activity limit in which 〈V〉 decreases with increasing lr.

3.3.  Varied obstacle density

We next consider the effect of holding ϕtot fixed at ϕtot=0.157 while decreasing ϕobs. In Fig. 9(a) we plot 〈V〉 versus lr for a sample with dilute obstacles at ϕobs = 0.03146. Here 〈V〉 decreases monotonically with increasing lr and the flow persists even when lr = 0. For moderately dilute obstacles at ϕobs=0.0628 in Fig. 9(b) and moderately dense obstacles at ϕobs=0.09424 in Fig. 9(c), there is still finite flow for lr = 0, and a peak in 〈V〉 emerges near lr = 1.0. For dense obstacles at ϕobs = 0.1257 in Fig. 9(d), 〈V〉 = 0 when lr < 0.1, and the optimum flow, indicated by the highest value of 〈V〉, has shifted to a higher run length of lr = 2.0. We note that for ϕobs > 0.175 there is almost no flow since there are few available regions in which a disk of finite radius can move through the sample. In all cases we observe a crossover from the low activity or thermal limit lr < 2 to the high activity limit lr > 2 in which 〈V〉 decreases with increasing lr.
In Fig. 10(a) we plot 〈V〉 versus FD for a system with low activity of lr=1.0, Fm=0.5, fixed ϕtot = 0.157, and varied obstacle density ranging from ϕobs=0.007853 to ϕobs=0.1492. The upper value of FD at which 〈V〉 drops to zero decreases with increasing ϕobs for very dense obstacles ϕobs > 0.1178, while for dense obstacles 0.1033 < ϕobs < 0.1178 we observe a window of NDM where 〈V〉 decreases with increasing FD separating low and high FD regions in which 〈V〉 increases with increasing FD. For dilute obstacles ϕobs < 0.1033, 〈V〉 monotonically increases with increasing FD, and although the NDM has disappeared, there is still a decrease in the slope of 〈V〉 for FD > 0.5 because an increased amount of trapping occurs once FD > Fm. Due to the harmonic form of the disk-disk interaction potential, if FD is increased to a large enough value the disks eventually are able to depin and move even in the completely clogged state; however, this occurs well above the range of FD that we consider here. In Fig. 10(b), the dynamic phase diagram as a function of FD versus ϕobs for the system in Fig. 10(a) shows that the ohmic flow phase I is reentrant.
Fig10.png
Figure 10: (a) 〈V〉 vs FD for samples with fixed ϕtot = 0.157 and varied ϕobs at low activity lr = 1.0 and Fm=0.5. From top to bottom, ϕobs = 0.00785 (dark blue circles), 0.00864 (medium blue squares), 0.00942 (light blue diamonds), 0.102 (teal up triangles), 0.1033 (dark green diamonds), 0.10618 (light green left triangles), 0.1099 (yellow down triangles), 0.1178 (dark red right triangles), 0.1256 (light pink squares), 0.133 (dark pink up triangles), 0.1413 (dark magenta circles), and 0.149 (light magenta squares). (b) Dynamic phase diagram as a function of FD vs ϕobs for the system in panel (a), showing reentrance in phase I. Phase I (red): ohmic flow; phase II (blue): partial trapping with NDM; phase III (green): clogged.

3.4.  Varied motor force and running time

Up to now we have characterized the activity by the run length lr = τFmδt and have focused on the case Fm = 0.5. It is, however, possible to obtain different behaviors at fixed lr by varying Fm and τ. If FD < Fm, the value of 〈V〉 should always be finite. In Fig. 11(a) we plot 〈V〉 versus Fm in systems with fixed FD = 0.5, ϕa = 0.0314, and dense obstacles ϕobs = 0.1257 for three values of τ. In order to compare these plots to our previous results, note that for Fm=0.5, a short τ = 100 gives a low activity lr=0.1, an intermediate τ = 10000 is equivalent to a high activity of lr = 10, and a long τ = 120000 corresponds to a very high activity of lr = 120. For short τ = 100, 〈V〉 = 0 at small Fm < 0.4, and for large Fm ≥ 0.4, 〈V〉 increases monotonically with Fm. At intermediate τ = 10000, 〈V〉 > 0 for large Fm > 0.2 and 〈V〉 passes through a maximum near Fm = 0.8. For long τ = 120000, the maximum in 〈V〉 falls at Fm = 0.5, and the overall magnitude of 〈V〉 is much smaller than that observed at the smaller τ values. In Fig. 11(b) we plot a dynamic phase diagram as a function of Fm versus FD for the long τ = 120000 system. The I-III transition line separating the clogged phase III and the ohmic flow phase I falls at Fm = FD/2, while the NDM in phase II appears when Fm > FD .
Fig11.png
Figure 11: 〈V〉 vs the motor force Fm for a system with FD = 0.5, dense obstacles ϕobs = 0.1257, and ϕa = 0.0314 at short τ = 100 (circles), intermediate τ = 10000 (squares), and long τ = 120000 (triangles). (b) Dynamic phase diagram as a function of Fm vs FD for the same system at long τ = 120000 showing a linear increase of the transition lines with increasing FD.
Fig12.png
Figure 12: 〈V〉 vs FD for samples with dense obstacles ϕobs = 0.173, Fm = 0.5, and low activity lr = 1.0 at low ϕtot = 0.25 (blue circles), moderately low ϕtot=0.377 (green squares), moderately high ϕtot=0.565 (orange diamonds), and high ϕtot=0.7 (red triangles).

3.5.  Crowding effects at higher disk densities

In previous work examining the mobility as a function of ϕa for fixed ϕobs and fixed FD, 〈V〉 increased with increasing ϕa up to a maximum value and then decreased for higher ϕa as the disks approached the jamming density due to a crowding effect in which the active disks become so dense that they impede each other's motion [10]. In Fig. 12 we plot 〈V〉 versus FD for a system with dense obstacles ϕobs = 0.173, Fm = 0.5, and low activity lr = 1.0 at low ϕtot = 0.25, moderately low ϕtot=0.377, moderately high ϕtot=0.565, and high ϕtot=0.7. For low ϕtot = 0.25, 〈V〉 drops to zero for FD > 1.25, while for moderately low ϕtot = 0.377, there is a region of NDM for 0.4 < FD < 0.7 but the velocities remain finite and the overall magnitude of 〈V〉 is larger than that of the low ϕtot=0.25 system. For moderately high ϕtot = 0.565, the average 〈V〉 is smaller than that for moderately low ϕtot = 0.377 due to the crowding effect, and there is only a very small window of NDM near FD = 0.6. For high ϕtot = 0.7, the increased crowding effect causes a substantial decrease in the overall magnitude of 〈V〉, and at the same time an extended region of NDM appears for 0.05 < FD < 0.4.
In Fig. 13(a) we plot the active disk trajectories for the system in Fig. 12 at moderately high ϕtot = 0.565 and low FD = 0.0125, a regime in which 〈V〉 increases with increasing FD. There is a considerable amount of disk motion throughout the sample. In contrast, Fig. 12(b) illustrates an NDM regime at high ϕtot = 0.7 and high FD = 0.5, where a large jammed or clogged area has formed in the center of the sample, indicating the role played by crowding in inhibiting the mobility of the active disks.
Fig13.png
Figure 13: The obstacle positions (red filled circles), active disks (dark blue open circles), and trajectories (light blue lines) for the system in Fig. 12 at (a) moderately high ϕtot = 0.565 with low FD=0.0125, where the disk density is relatively uniform and the system acts like a liquid, and (b) high ϕtot = 0.7 with high FD=0.5, where the system acts like a clogged solid.

4.  Discussion

There are a number of interesting directions for future studies of this system. One is an examination of the role of dimensionality. We considered only two dimensions, but there could be a change in the behavior in three dimensions due to the appearance of distinct three-dimensional clustering effects. Another issue to explore is the effect of placing the obstacles in periodic arrangements rather than distributing them randomly. In previous work on non-active disks driven through periodic obstacle arrays, a strong dependence of the dynamics on the relative angle between the driving direction and an obstacle lattice symmetry direction appeared, such that for some driving directions flow occurred easily while for other driving directions the flow was strongly disordered or jammed easily [35,36,37]. We expect that similar directional locking or clogging effects would also occur for active disks. Other topics for study include a system in which the active particles interact with obstacles that are mobile or even active rather than stationary. If the obstacles do not experience the drift force, the motion of the active particles could induce pattern formation or other structures in the background of obstacles. We considered active disks at zero temperature, but it would also be possible to combine thermal Brownian noise with the activity. In some cases this thermal noise could break up clogs or increase the flow. Similarly, an ac drift force could be superimposed on the dc drift force, and this could also break up clogs in some cases to allow for increased flow; however, in other cases the ac drive might increase the tendency of the system to clog.

5.  Summary

We have numerically examined the velocity-force curves for active matter disks driven through a random obstacle array and find three distinct dynamical phases. In the low drive regime, the velocity increases linearly with increasing external drive. For intermediate drives, the system exhibits negative differential mobility where the velocity decreases with increasing drive due to the trapping of disks behind obstacles. Finally, at high drive we find a fully clogged state in which the drift velocity drops to zero. For increasing activity or run length, we find that the onsets of the NDM phase and the fully clogged phase are shifted to larger external drift forces. Additionally, the drift velocity at fixed drive changes nonmonotonically with increasing activity, indicating that there is a drive-dependent optimal activity or run length that maximizes the flux of disks through the system. We map the locations of the dynamic phases as a function of activity, active disk density, obstacle density, and motor force. We describe how an external drift force could be tuned to either separate or mix active disk species with different mobilities. We have also examined the role of active disk density, and find that at low disk densities, the NDM and clogging effects disappear with increasing disk density when the trapping is reduced; however, for much larger densities where crowding effects become important, the NDM reappears and is enhanced.

Acknowledgments

This work was carried out under the auspices of the NNSA of the U.S. DoE at LANL under Contract No. DE-AC52-06NA25396.

ORCID iDs

C J O Reichhardt https://orcid.org/0000-0002-3487-5089

References

[1]
Marchetti M C, Joanny J F, Ramaswamy S, Liverpool T B, Prost J, Rao M and Simha R A 2013 Hydrodynamics of soft active matter Rev. Mod. Phys. 85 1143
[2]
Bechinger C, Di Leonardo R, Löwen H, Reichhardt C, Volpe G and Volpe G 2016 Active Brownian particles in complex and crowded environments Rev. Mod. Phys. 88 045006
[3]
Reichhardt C and Reichhardt C J O 2015 Active microrheology in active matter systems: Mobility, intermittency, and avalanches Phys. Rev. E 91 032313
[4]
Fily Y and Marchetti M C 2012 Athermal phase separation of self-propelled particles with no alignment Phys. Rev. Lett. 108 235702
[5]
Redner G S, Hagan M F and Baskaran A 2013 Structure and dynamics of a phase-separating active colloidal fluid Phys. Rev. Lett. 110 055701
[6]
Palacci J, Sacanna S, Steinberg A P, Pine D J and Chaikin P M 2013 Living crystals of light-activated colloidal surfers Science 339 936
[7]
Cates M E and Tailleur J 2013 When are active Brownian particles and run-and-tumble particles equivalent? Consequences for motility-induced phase separation Europhys. Lett. 101 20010
[8]
Cates M E and Tailleur J 2015 Motility-induced phase separation Annu. Rev. Condens. Mat. Phys. 6 219
[9]
Thompson A G, Tailleur J, Cates M E and Blythe R A 2011 Lattice models of nonequilibrium bacterial dynamics J. Stat. Mech. 2011 P02029
[10]
Reichhardt C and Reichhardt C J O 2014 Active matter transport and jamming on disordered landscapes Phys. Rev. E 90 012701
[11]
Morin A, Desreumaux N, Caussin J-B and Bartolo D 2017 Distortion and destruction of colloidal flocks in disordered environments Nature Phys. 13 63
[12]
Zeitz M, Wolff K and Stark H 2017 Active Brownian particles moving in a random Lorentz gas Eur. Phys. J. E 40 23
[13]
Lozano C, ten Hagen B, Löwen H and Bechinger C 2016 Phototaxis of synthetic microswimmers in optical landscapes Nature Commun. 7 12828
[14]
Sándor Cs, Libál A, Reichhardt C and Reichhardt C J O 2017 Collective transport for active matter run-and-tumble disk systems on a traveling-wave substrate Phys. Rev. E 95 012607
[15]
Choudhury U, Straube A V, Fischer P, Gibbs J G and Höfling F 2017 Active colloidal propulsion over a crystalline surface Preprint arXiv:1707.05891
[16]
Pince E, Velu S K P, Callegari A, Elahi P, Gigan S, Volpe G and Volpe G 2016 Disorder-mediated crowd control in an active matter system Nature Commun. 7 10907
[17]
Sándor Cs, Libál A, Reichhardt C and Reichhardt C J O 2017 Dynamic phases of active matter systems with quenched disorder Phys. Rev. E 95 032606
[18]
Reichhardt C J O and Reichhardt C 2017 Ratchet effects in active matter systems Annu. Rev. Condens. Mat. Phys. 8, 51
[19]
Kümmel F, Shabestari P, Lozano C, Volpe G and Bechinger C 2015 Formation, compression and surface melting of colloidal clusters by active particles Soft Matter 11 6187
[20]
Chepizhko O, Altmann E G and Peruani F 2013 Optimal noise maximizes collective motion in heterogeneous media Phys. Rev. Lett. 110 238101
[21]
Quint D and Gopinathan A 2015 Topologically induced swarming phase transition on a 2D percolated lattice Phys. Biol. 12 046008
[22]
Reichhardt C and Reichhardt C J O 2017 Depinning and nonequilibrium dynamic phases of particle assemblies driven over random and ordered substrates: A review Rep. Prog. Phys. 80 026501
[23]
Barma M and Dhar D 1983 Directed diffusion in a percolation network J. Phys. C 16 1451
[24]
Leitmann S and Franosch T 2013 Nonlinear response in the driven lattice Lorentz gas Phys. Rev. Lett. 111 190603
[25]
Baerts P, Basu U, Maes C and Safaverdi S 2013 Frenetic origin of negative differential response Phys. Rev. E 88 052109
[26]
Bénichou O, Illien P, Oshanin G, Sarracino A and Voituriez R 2014 Microscopic theory for negative differential mobility in crowded environments Phys. Rev. Lett. 113 268002
[27]
Baiesi M, Stella A L and Vanderzande C 2015 Role of trapping and crowding as sources of negative differential mobility Phys. Rev. E 92 042121
[28]
Bénichou O, Illien P, Oshanin G, Sarracino A and Voituriez R 2016 Nonlinear response and emerging nonequilibrium microstructures for biased diffusion in confined crowded environments Phys. Rev. E 93 032128
[29]
Sarracino A, Cecconi F, Puglisi A and Vulpiani A 2016 Nonlinear response of inertial tracers in steady laminar flows: differential and absolute negative mobility Phys. Rev. Lett. 117 174501
[30]
Jack R L, Kelsey D, Garrahan J P and Chandler D 2008 Negative differential mobility of weakly driven particles in models of glass formers Phys. Rev. E 78 011506
[31]
Reichhardt C, Olson C J and Nori F 1998 Nonequilibrium dynamic phases and plastic flow of driven vortex lattices in superconductors with periodic arrays of pinning sites Phys. Rev. B 58 6534
[32]
Gutierrez J, Silhanek A, Van de Vondel J, Gillijns W and Moshchalkov V 2009 Transition from turbulent to nearly laminar vortex flow in superconductors with periodic pinning Phys. Rev. B 80 140514
[33]
Eichhorn R, Regtmeier J, Anselmetti D and Reimann P 2010 Negative mobility and sorting of colloidal particles Soft Matter 6 1858
[34]
Scholl E 1987 Nonequilibrium Phase Transitions in Semiconductors (Berlin:Springer-Verlag)
[35]
Korda P T, Taylor M B and Grier D G 2002 Kinetically locked-in colloidal transport in an array of optical tweezers Phys. Rev. Lett. 89 128301
[36]
Li Z and Drazer G 2007 Separation of suspended particles by arrays of obstacles in microfluidic devices Phys. Rev. Lett. 98 050602
[37]
Nguyen H T, Reichhardt C and Reichhardt C J O 2017 Clogging and jamming transitions in periodic obstacle arrays Phys. Rev. E 95 030902(R)


File translated from TEX by TTHgold, version 4.00.
Back to Home