Results
Time evolution to a jammed or clogged state
Velocity measurement of the transition from clogging to jamming
Transient velocities near the clogging and jamming transitions
Local disk densities in clogged and jammed states
Discussion
Methods
References
The concept of jamming is used in loose assemblies of particles such as grains or bubbles to describe the transition from an easily flowing fluidlike state to a rigid jammed or solidlike state [1,2,3,4]. Liu and Nagel proposed a generalized jamming phase diagram combining temperature, load, and density, where a particularly important point is the density ϕj at which jamming occurs [1]. Jamming has been extensively studied in a variety of systems [3,4,5], and there is evidence that in certain cases, the jamming transition has the properties of a critical point, such as a correlation length that diverges as the jamming density is approached [2,3,4,5,6,7,8,9]. A related phenomenon is the clogging that occurs for particles flowing through a hopper, where as a function of time there is a probability for arch structures to form that block the flow [10,11,12,13]. Clogging is associated with the motion of particulate matter past a physical constraint such as wells, barriers, obstacles, or bottlenecks [14,15,16,17,18,19]; however, it has not been established whether jamming and clogging are two forms of the same phenomenon or whether there are key features that distinguish jamming from clogging. Here we show for frictionless disks moving through a random obstacle array that jamming and clogging are distinct phenomena and that a transition from clogging to jamming occurs as a function of increasing disk density. We identify the number of obstacles required to stop the flow and the transient times needed to reach a stationary clogged or jammed state. There are two critical obstacle densities, ϕcj for the jammed state and ϕcc for the clogged state. In the jamming regime, the obstacle density ϕcj at which flow ceases drops to lower obstacle densities with increasing disk density, and the system forms a homogeneous jammed state when the rigidity correlation length associated with ϕj becomes larger than the average distance between obstacles. In contrast, during clogging the system organizes over time into a heterogeneous or phase-separated state, and the transient time diverges at a critical obstacle density ϕcc that is independent of the disk density. The phase-separated state consists of regions with a density near ϕj coexisting with low density regions.
Results
Time evolution to a jammed or clogged state
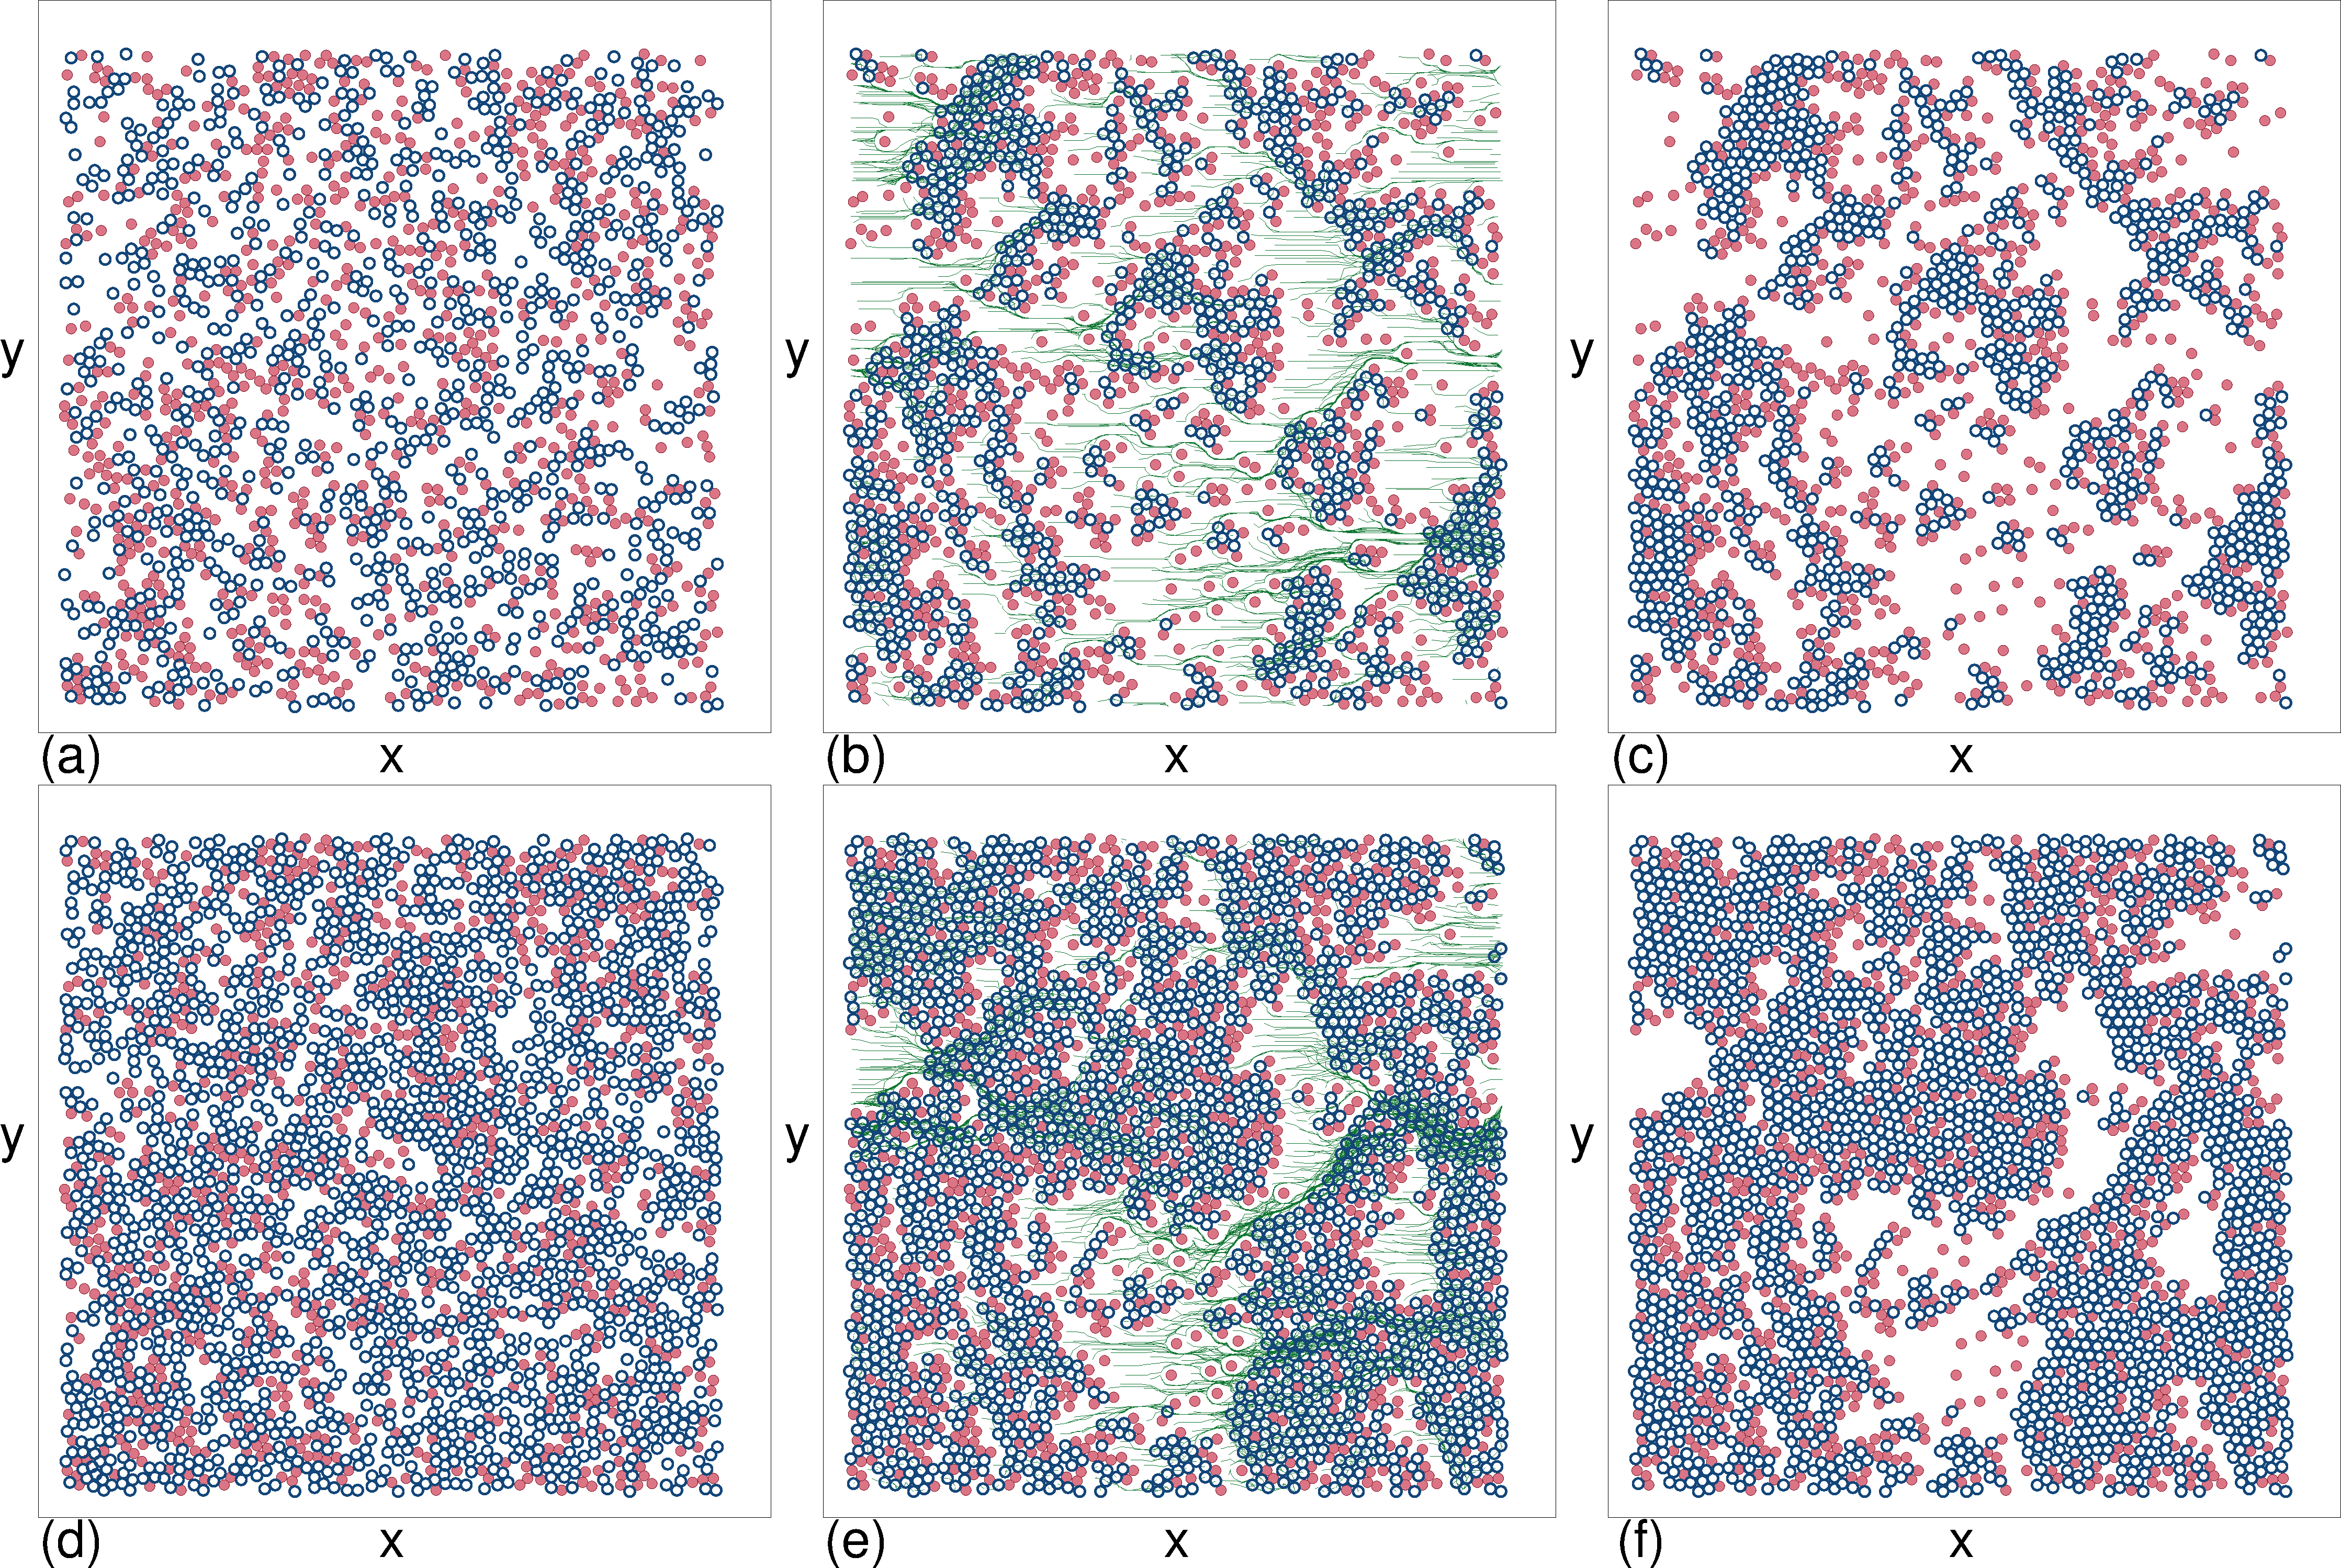
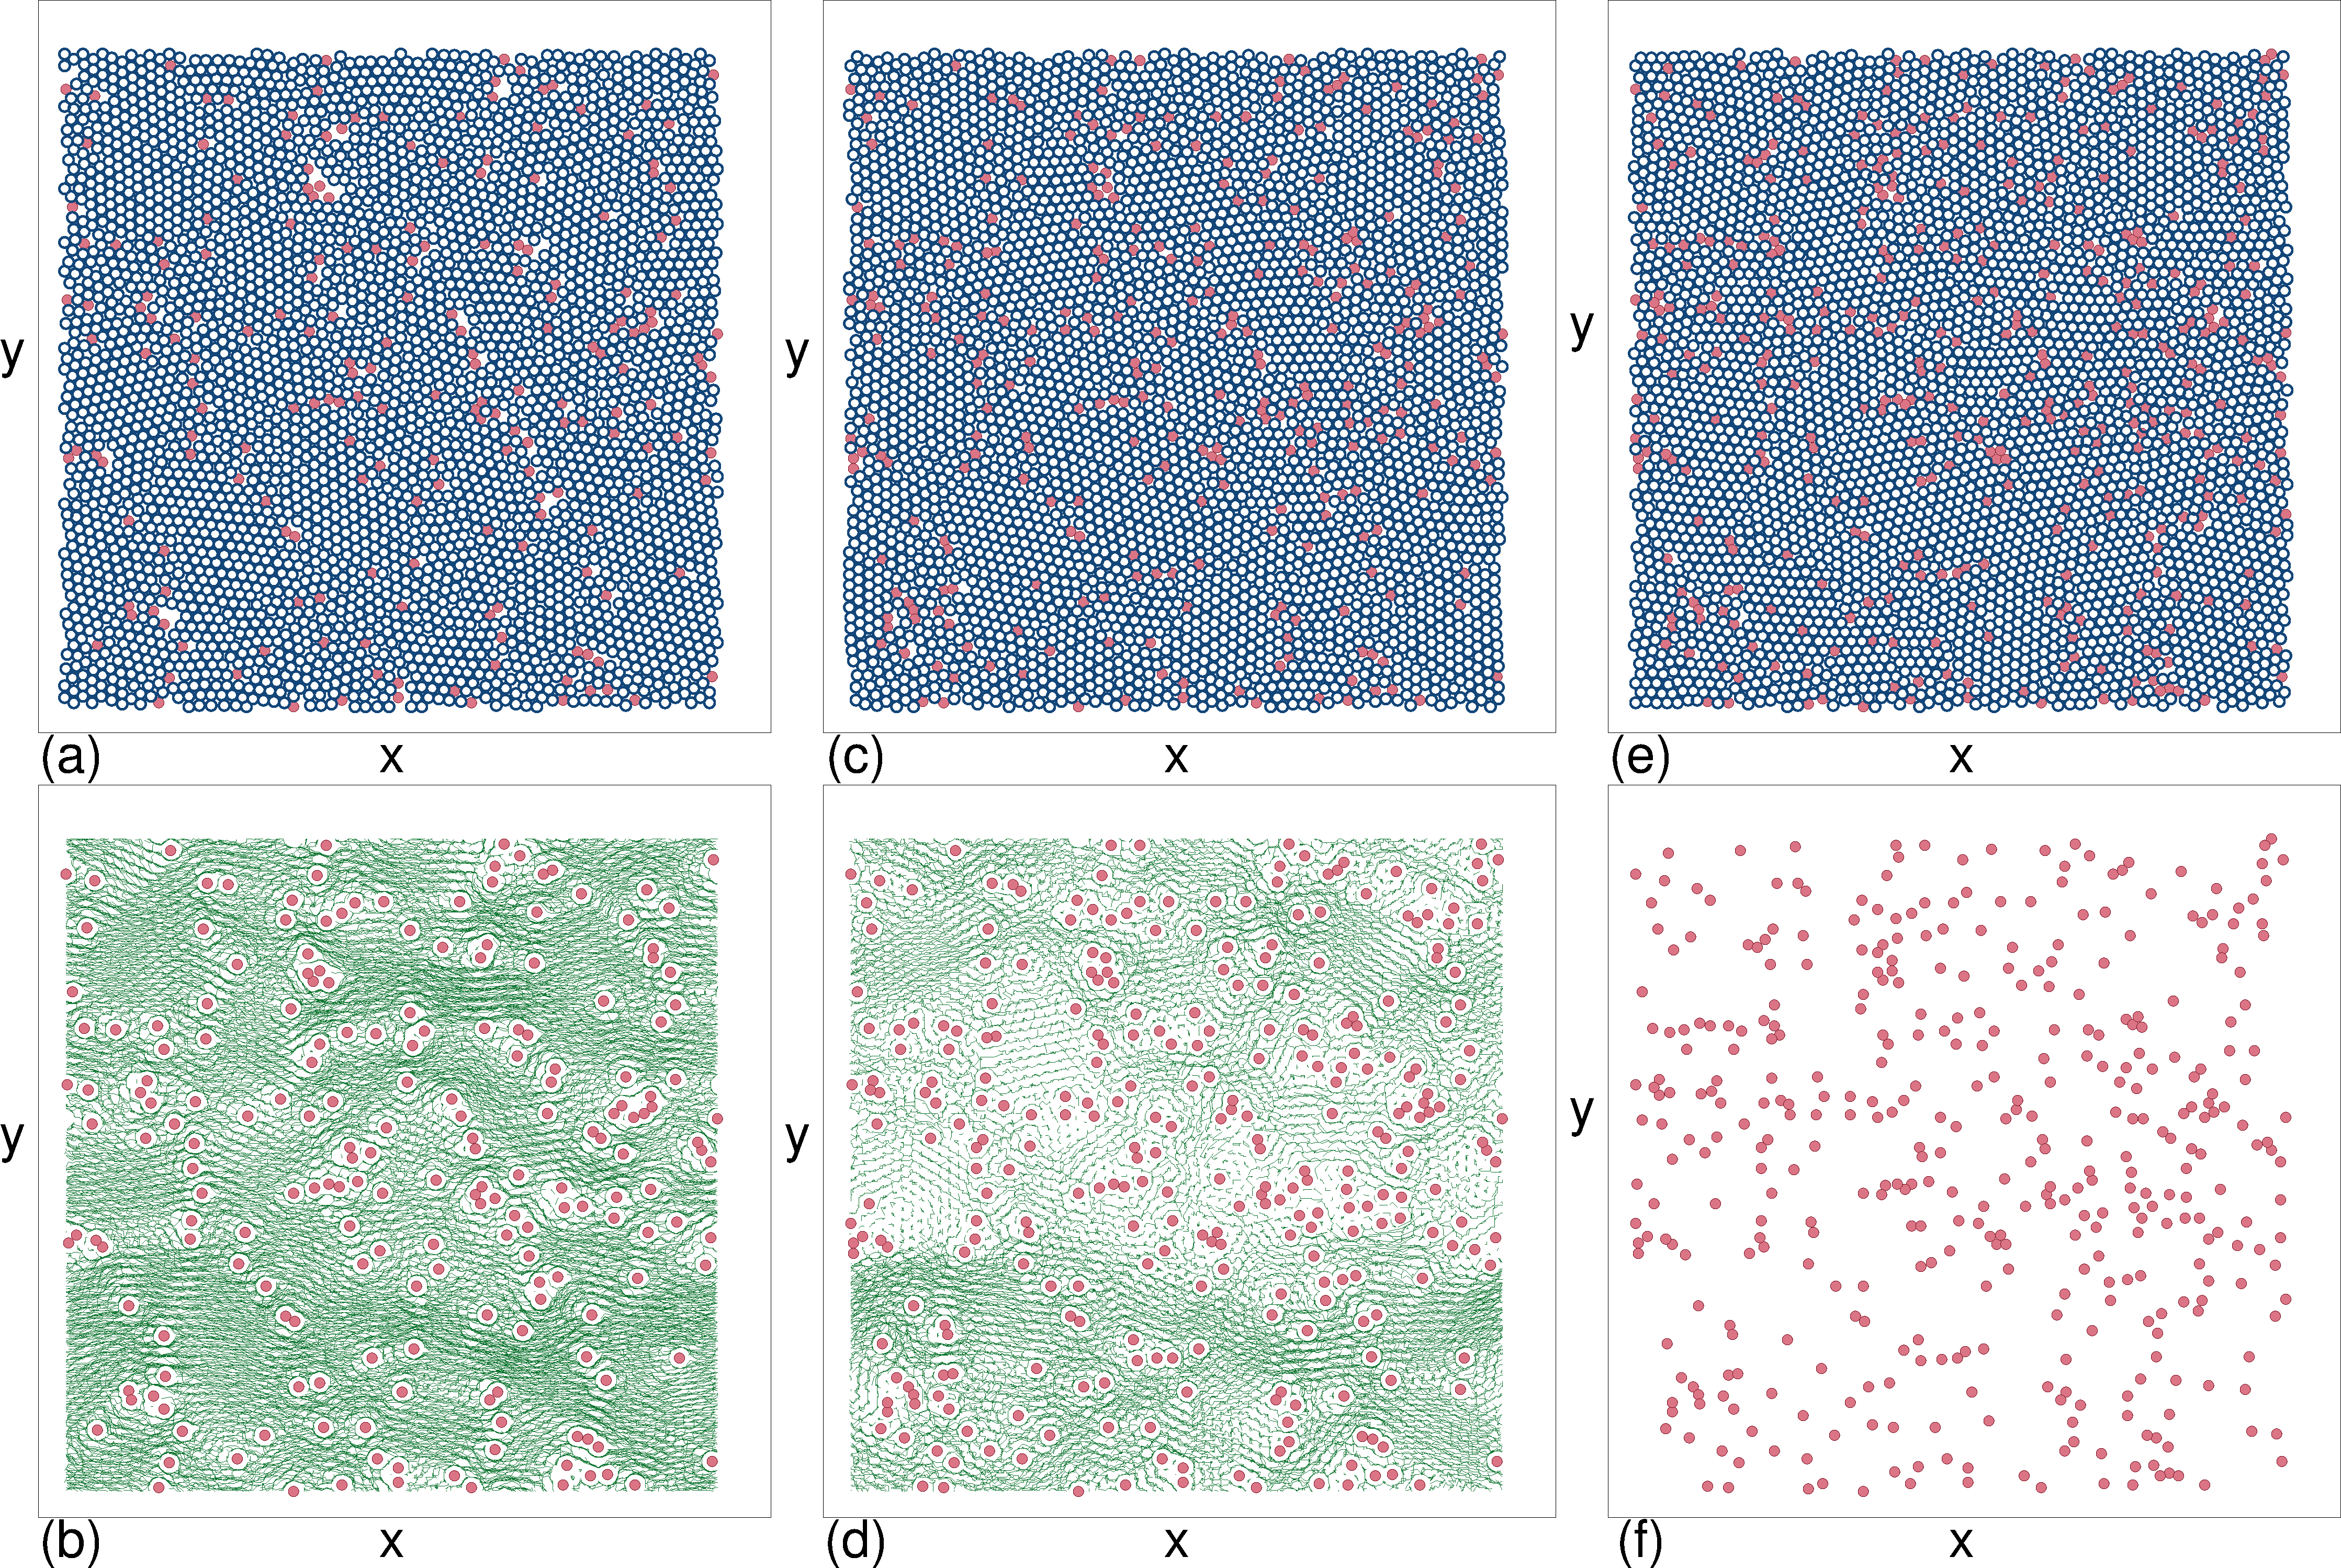
We numerically examine disks driven through a two-dimensional array of obstacles in the form of immobile disks. Simulation details appear in the Methods section. The total area density of the system is ϕtot=ϕp + ϕps, where ϕp is the area density of the moving disks and ϕps is the area density of the obstacles. Starting from a uniformly dense sample, we apply a driving force and find that over time the system evolves either to a steady free flowing state or to a motionless clogged or jammed state. In Fig. 1a,b,c we illustrate the time evolution of a system with a disk density of ϕp = 0.2186 and an obstacle density of ϕps = 0.175, beginning with the uniform density initial state in Fig. 1a. Upon application of a drive, we find a transient flowing state as shown in Fig. 1b which gradually evolves into the final motionless phase-separated or clustered clogged state in Fig. 1c. For a higher disk density of ϕp=0.436, Fig. 1d,e,f shows that the same evolution from uniform initial state to transient flowing state to static clogged state occurs, but the dense clusters in the clogged state are larger. At much higher disk densities of ϕp=0.785, we find jamming behavior when the obstacle density is larger than a critical value ϕcj. Below ϕcj, the system quickly settles into steady state flow, as shown in Fig. 2(a,b) for ϕps=0.043 and in Fig. 2(c,d) for ϕps=0.065. The magnitude of the flow decreases with increasing ϕps. Above ϕcj the disks quickly form a disordered jammed state when driven, as illustrated in Fig. 2(e,f) for ϕps=0.0872. In contrast to the density phase-separated clogged states that form at lower ϕp, the jammed states are homogeneously dense. The randomly placed obstacles prevent the monodisperse disks from developing long-range crystalline order.
|
Velocity measurement of the transition from clogging to jamming
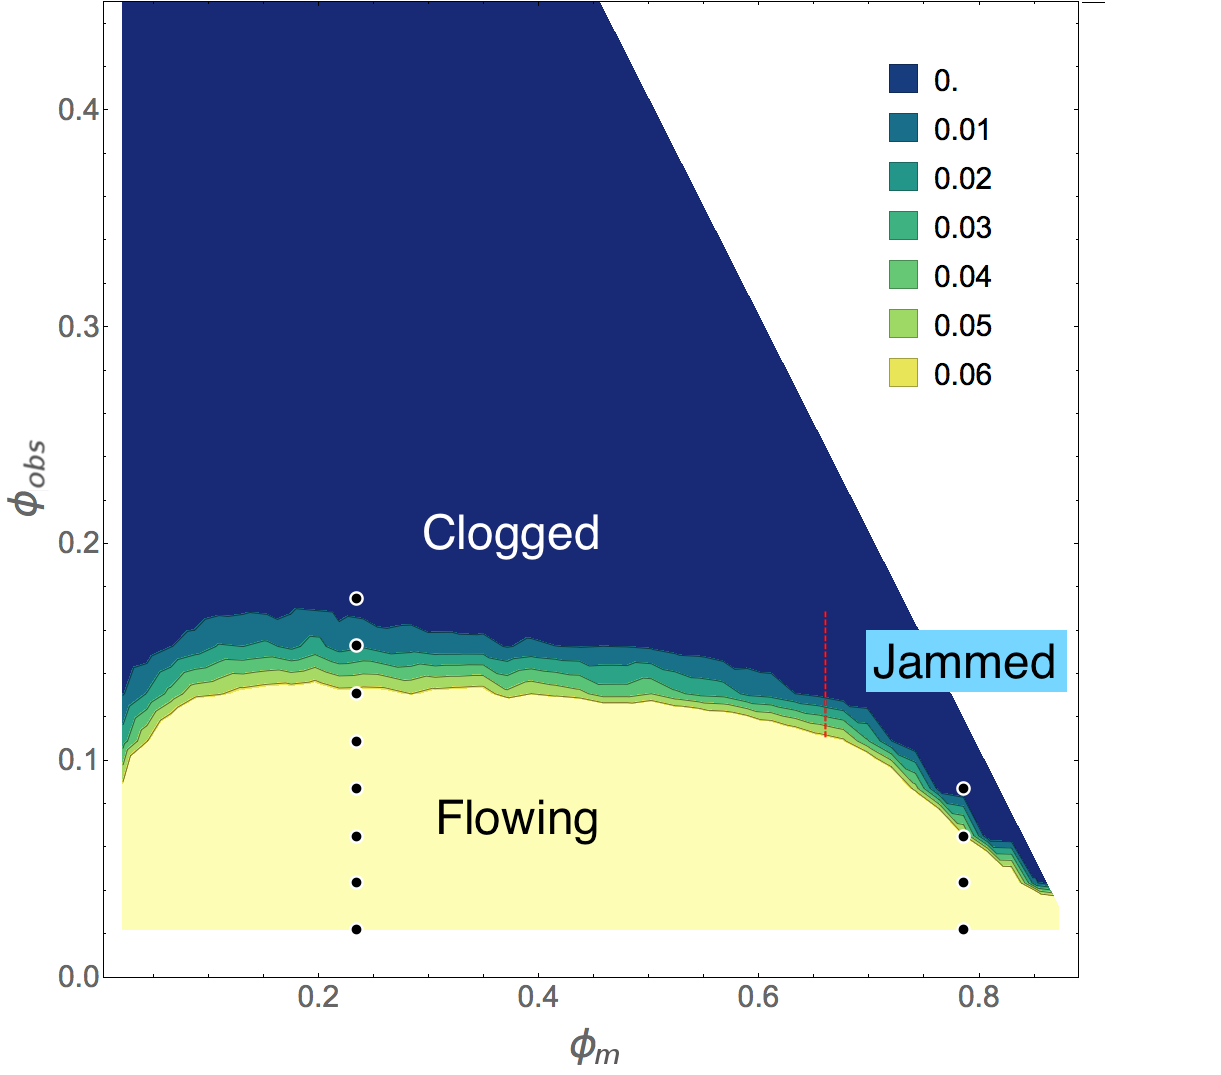
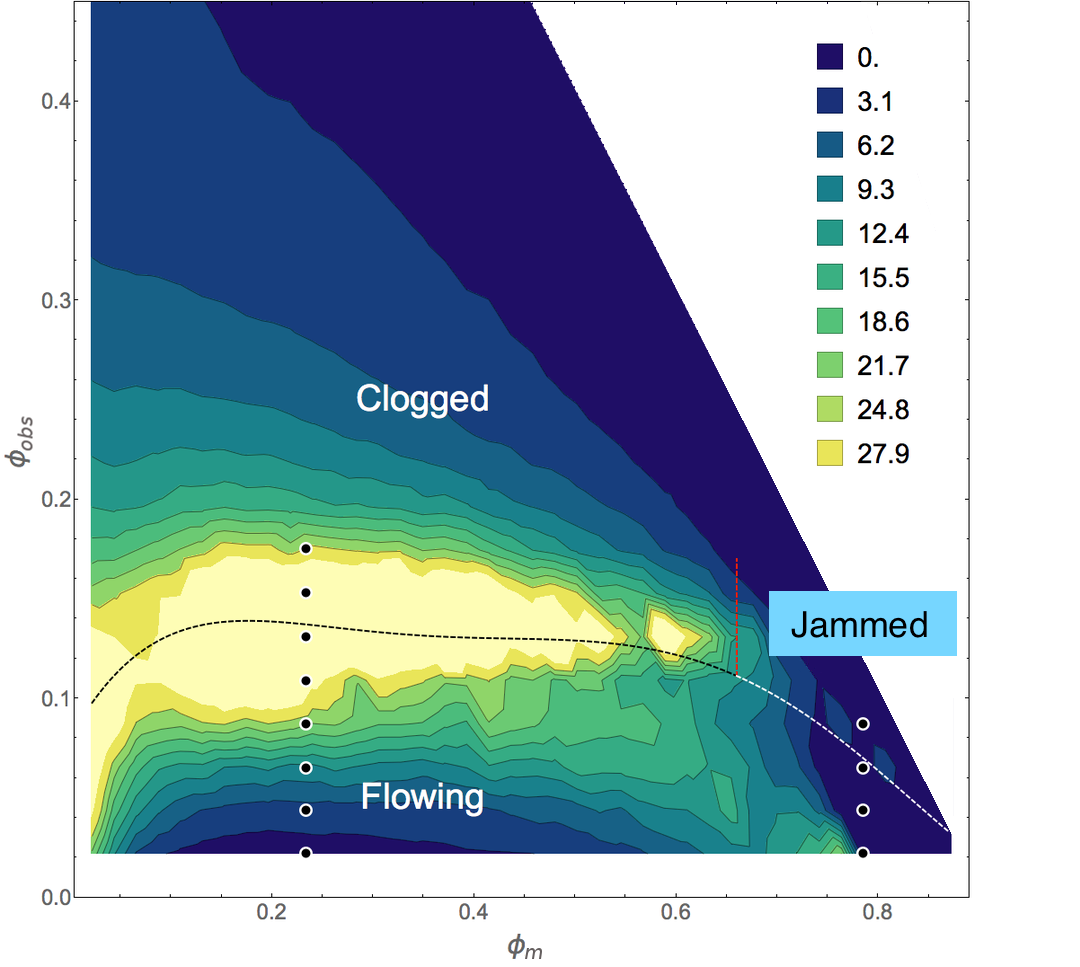
To characterize the system we perform a series of simulations with varied ϕp and ϕps. We measure the final velocity V0 of the mobile disks after a fixed time interval, and average over ten different realizations. In Fig. 3 we plot a velocity heat map as a function of ϕps versus ϕp. We find a flowing regime at small ϕps, a clogged regime for ϕp < 0.67, and a jammed regime for ϕp > 0.67. The critical obstacle density ϕcc above which the velocity V0 drops to zero in the clogging regime remains roughly constant at ϕcc ≈ 0.15, independent of the value of ϕp. This indicates that the transition to a clogged state is controlled by the average spacing lps=1/√{ϕps} between obstacles, similar to the manner in which hopper clogging is controlled by the aperture size. In contrast, in the jamming regime the critical obstacle density ϕcj separating flowing from jammed states decreases linearly with increasing ϕp and reaches ϕcj=0 for ϕp ≈ 0.9069, indicating that this transition is controlled by a growing correlation length ξ associated with the jamming point ϕj [5]. We argue that the system jams when ξ = lps. If we assume that near jamming in a clean system, the correlation length grows as ξ ∝ (ϕj − ϕp)−ν, then the transition to the jammed state varies with obstacle density according to ϕcj ∝ (ϕj −ϕp)2ν. In Fig. 3, ϕcj ∝ ϕp, implying that ν = 1/2, consistent with the exponent ν = 1/2 proposed for jamming in Refs. [20,21], as well as with simulation measurements giving ν in the range 0.6 to 0.7 for two-dimensional bidisperse disks [6,8]. The exponent we find is also in agreement with that observed for the shift in the jamming point in bidisperse disks on random pinning arrays [22]. Studies of bidisperse disk jamming with dilute obstacles very near ϕj also show that ϕj decreases linearly with obstacle density, giving ν = 1/2 [23]. Previous simulations of bidisperse disks of radius Rs=0.5 and Rl=0.7 flowing through a periodic array of obstacles with radius Rs=0.5 showed that clogging is strongly enhanced when lps <~2.35 [24]. This is because in order for a pair of disks, one large and one small, to fit between two obstacles, the lattice constant a of the obstacle array must be at least large enough to accommodate the size of the obstacle itself plus the size of the two disks, a ≥ 2Rs+2Rs+2Rl=2.4. In our monodisperse disk system, the obstacles are placed randomly, but one can obtain an estimate of the lps for the onset of clogging by considering the circular holes in the obstacle array [25]. If we construct a circle that just touches any three disks and/or obstacles, this circle is defined to be a hole when it does not overlap any disks. For a pair of disks to pass between two obstacles, the obstacle spacing must once again accommodate the size of the obstacle itself plus the size of the two disks, lps ≥ lpsc = 2Rd+2Rd+2Rd=3.0. This spacing can be achieved by placing the obstacles such that circular holes of size Rd can form on all sides of the hole on average, giving an effective obstacle radius of 3Rd and a critical obstacle density of ϕpsc=(1/6)(π/(2√3))=0.15. Below ϕpsc, the holes percolate and the disks can flow, while above ϕpsc, not enough holes are available to permit steady state free flow and a clogged state forms. In Fig. 3, the onset of clogging, ϕcc ≈ 0.15, is close to ϕpsc. When ϕp <~0.15, ϕcc is no longer constant but decreases with decreasing ϕp. At these low disk densities, mobile disks are trapped independently, so at least one additional obstacle must be added for every additional mobile disk, giving ϕcc ∝ ϕp.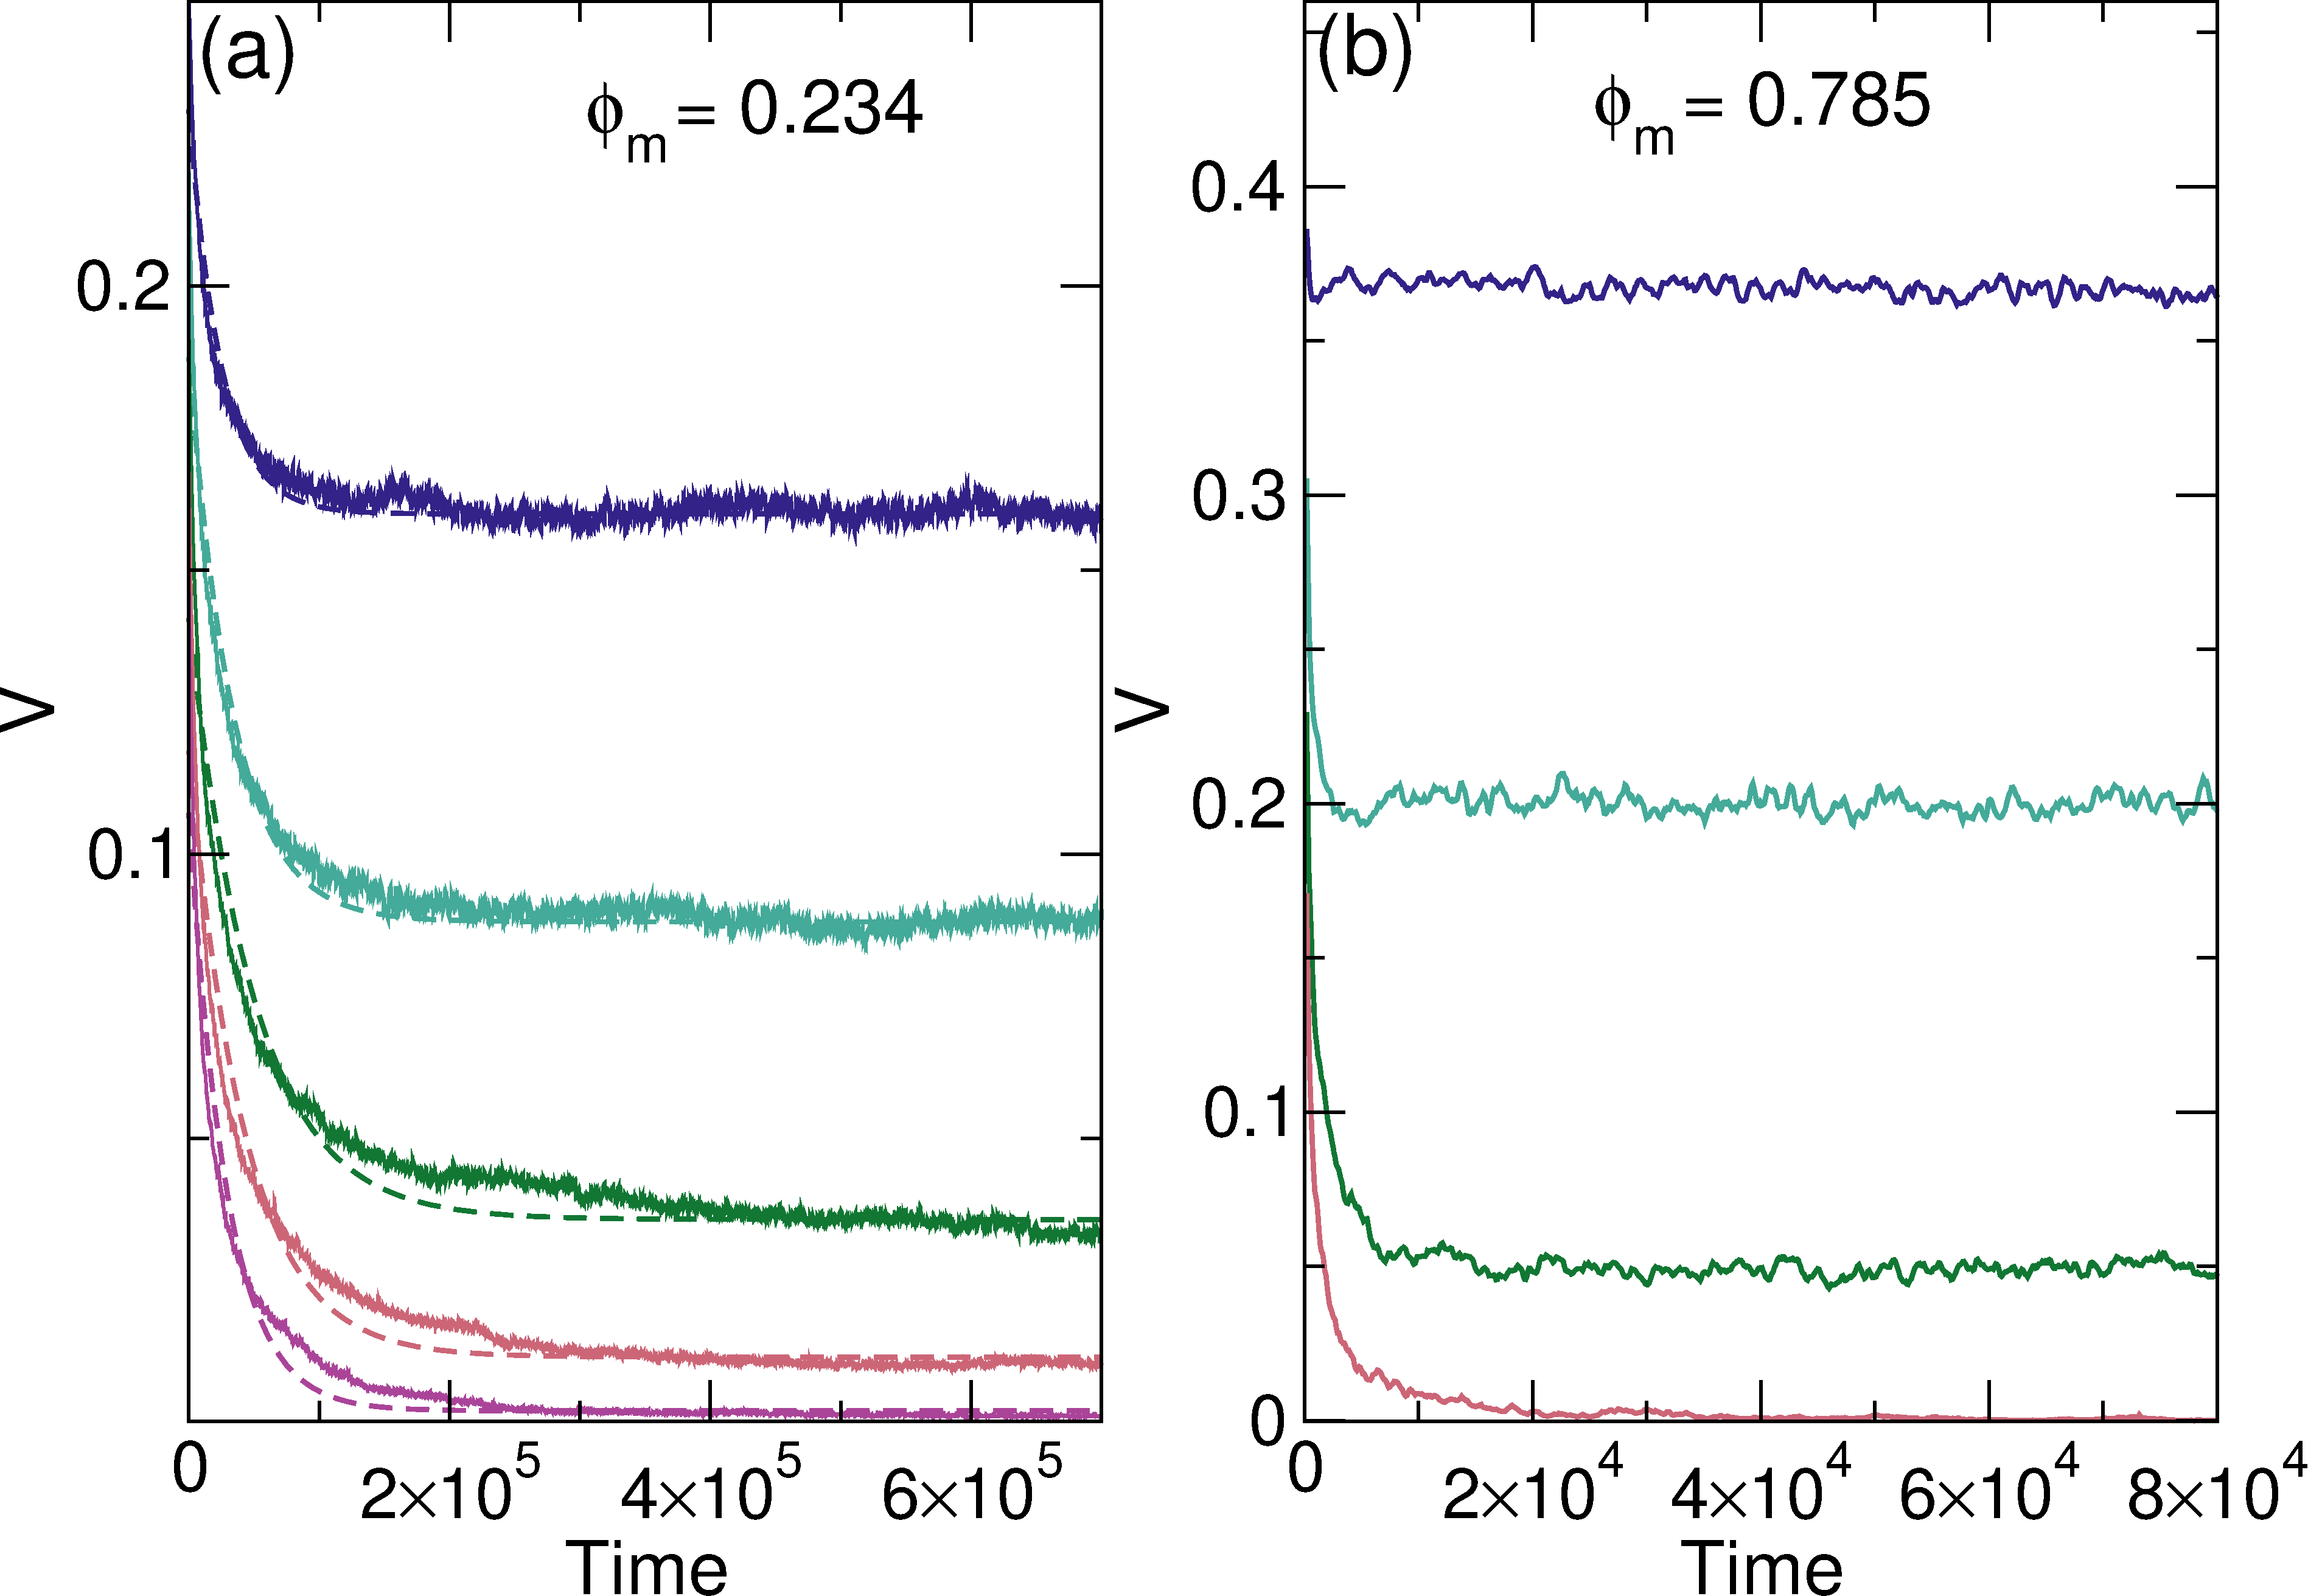
Transient velocities near the clogging and jamming transitions
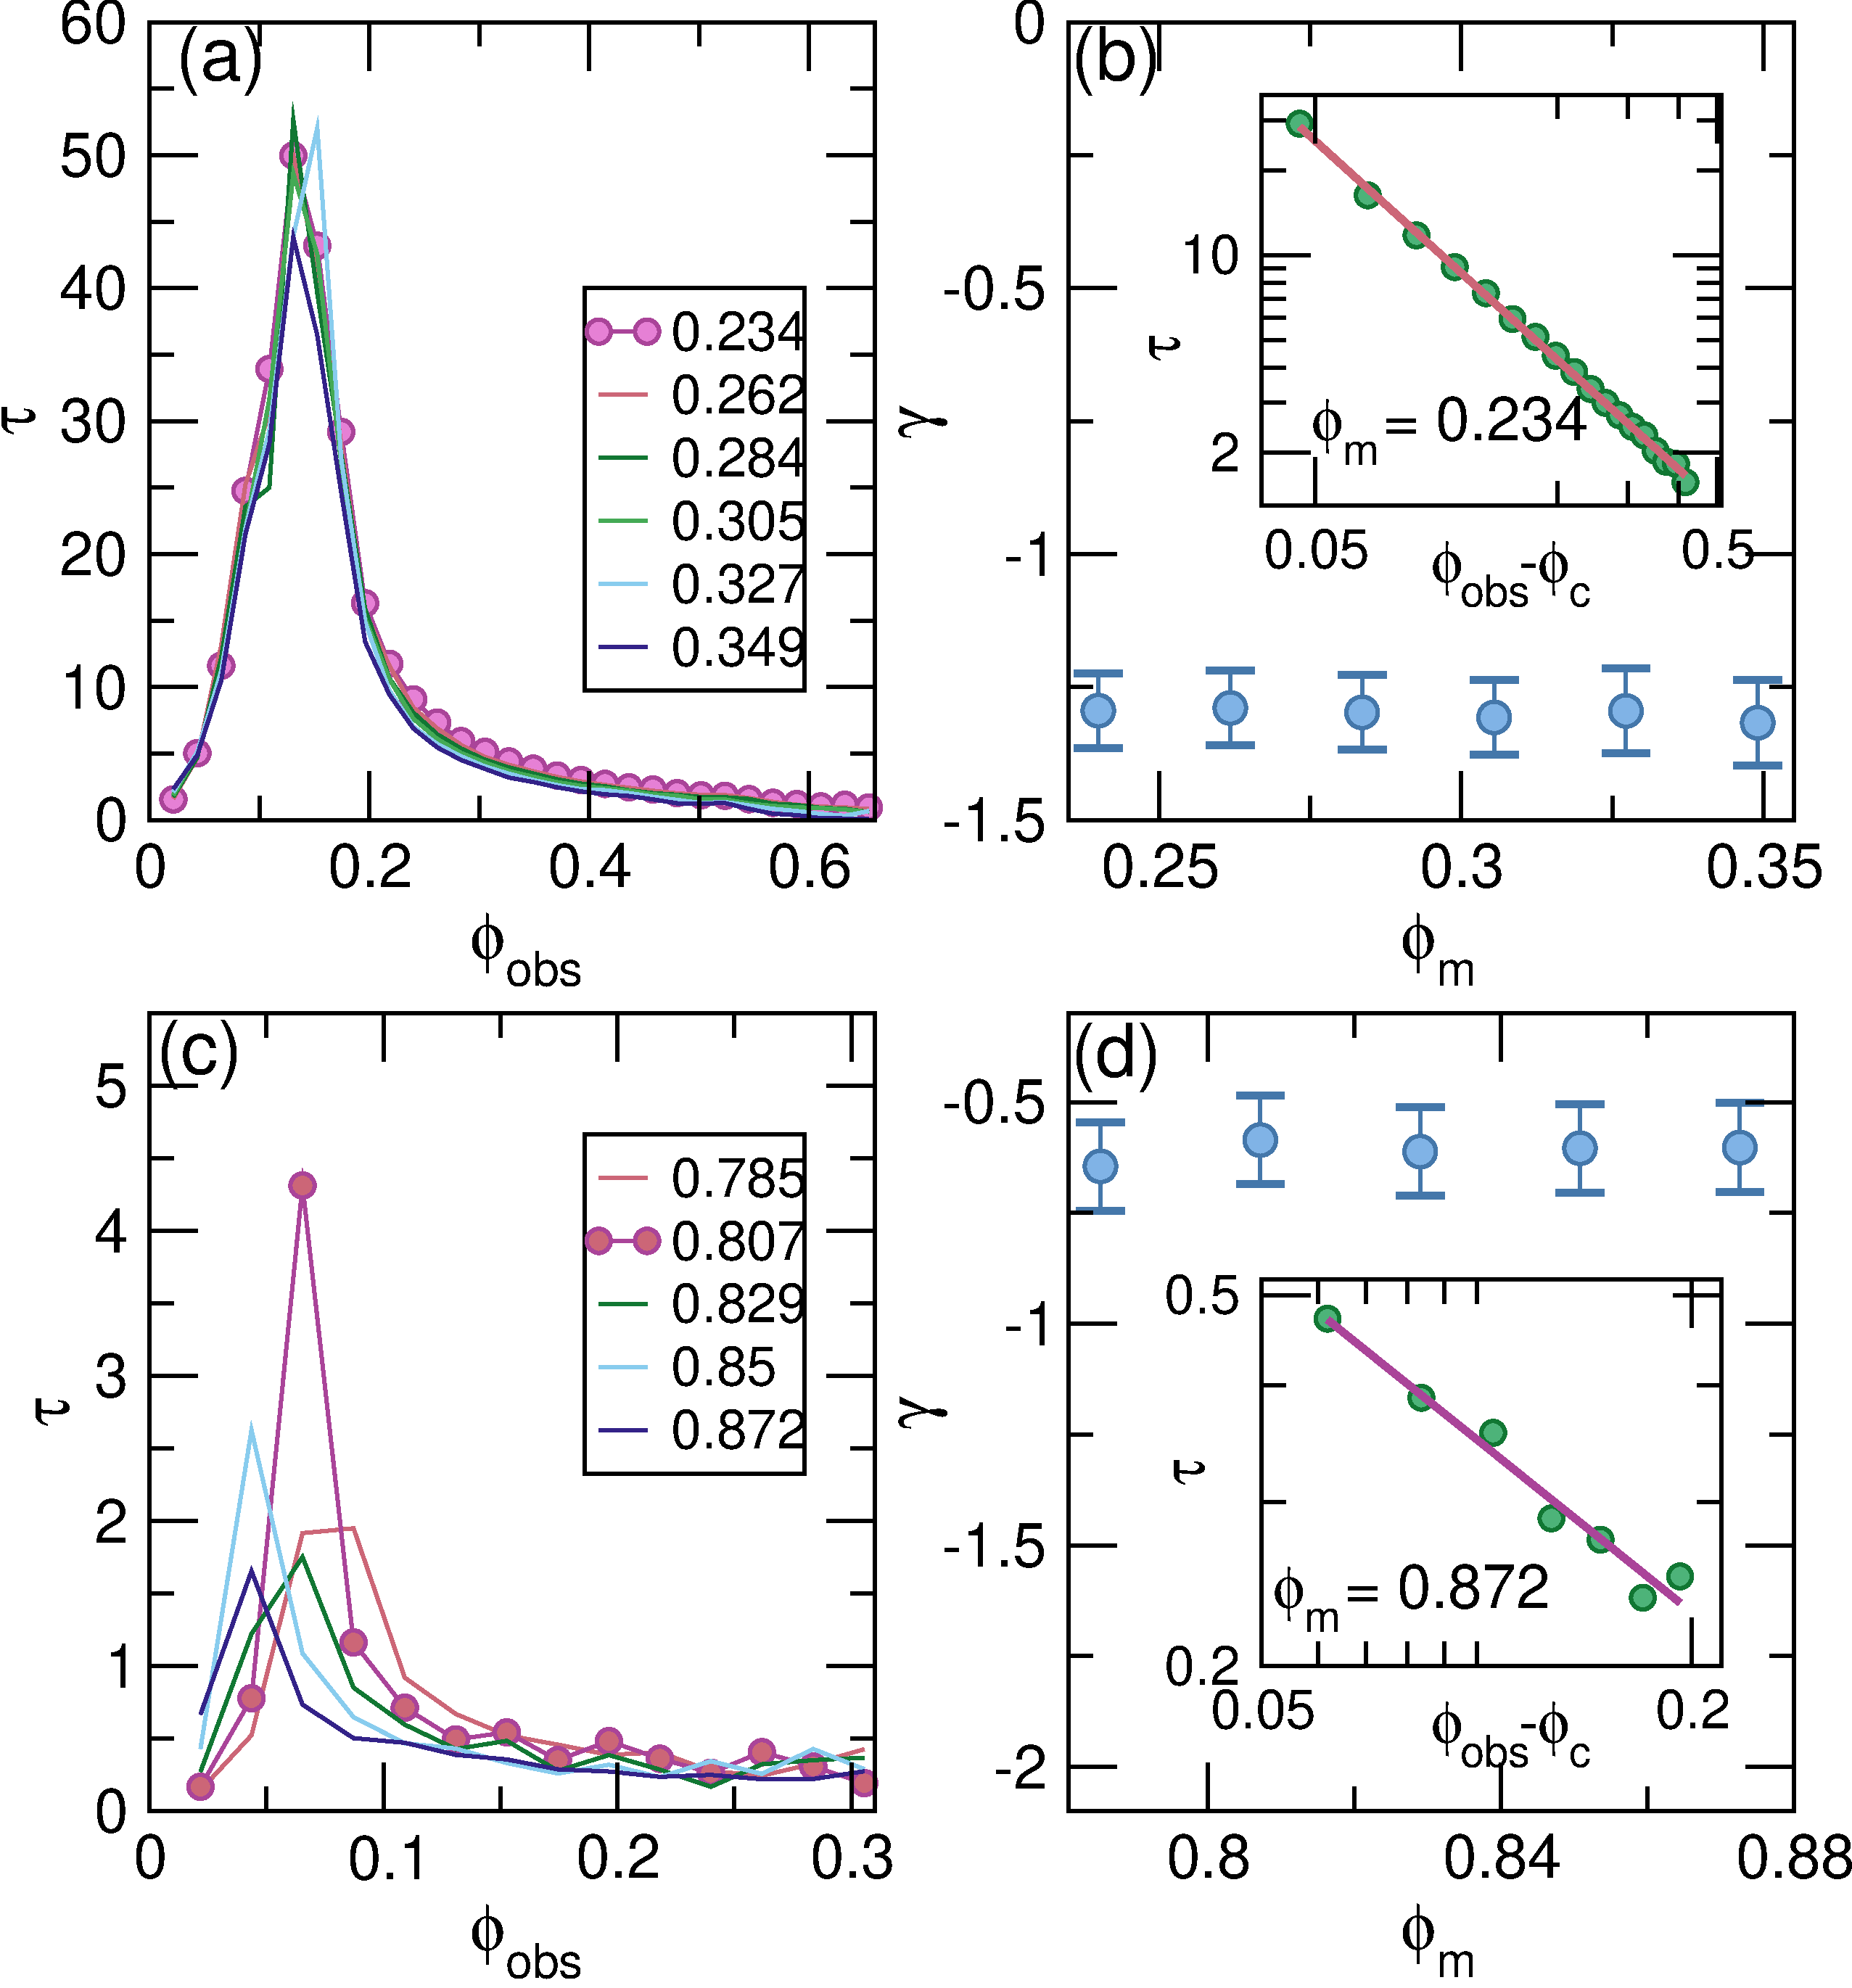
In Fig. 4a we show representative time series of the average velocity V per mobile disk in the clogging regime at ϕp = 0.234 for ϕps ranging from ϕps=0.087 to 0.175. At low obstacle densities, the disks reach a steady state flow after a very short transient time τ. As ϕps increases, τ increases, showing a divergence at the critical obstacle density ϕcc where clogging first occurs, while for ϕps > ϕcc, τ decreases with increasing ϕps and the disks reach a completely clogged state with V=0. We fit V(t) ∝ Aexp(−t/τ) + V0, as indicated by the dashed lines in Fig. 4(a), and plot the resulting values of τ in Fig. 5a as a function of ϕps for ϕp=0.234 to 0.349. In each case, τ diverges near ϕps = 0.15. We fit this divergence for ϕps > ϕcc to a power law, τ ∝ (ϕps − ϕcc)γ, as shown in the inset of Fig. 5b for ϕp = 0.234, where γ = −1.29 ±0.1. The plot of γ versus ϕp in the main panel of Fig. 5(b) indicates that γ has a constant value in the range −1.25 to −1.35. The transient time behavior is similar to that found for the diverging time scales that appear near the irreversible-reversible transition in systems exhibiting random organization [26,27,28] and near the depinning transition for colloids [29] and vortices [30,31] driven over random pinning arrays. The power law exponents are also close to the value γ = −1.295 expected for the universality class of two-dimensional directed percolation [32], and we find similar values of γ for ϕp < 0.67 throughout the clogging regime. Directed percolation is often used to describe nonequilibrium absorbing phase transitions [32], and in our case the steady state flow corresponds to a fluctuating state, while the clogged state is the non-fluctuating or absorbed state.
|
|


Local disk densities in clogged and jammed states.
The clogged and jammed systems can also be distinguished by examining the local disk density ϕloc measured in areas 6Rd ×6Rd in size. In Fig. 8a we plot the local density distribution P(ϕloc) averaged over ten realizations of the final clogged state for a system with ϕp = 0.5 and ϕps = 0.175. As shown in the inset of Fig. 8a, the disks phase separate into low density regions associated with the peak at ϕloc=0.1 and high density regions which produce a second peak at ϕloc=0.85. The local density of the dense regions is lower than the value of ϕloc=0.9069 for a dense ordered hexagonal disk arrangement due to the considerable disorder introduced in the packing by the randomly placed obstacles. In Fig. 8b, P(ϕloc) for a system with ϕp = 0.8 and ϕps = 0.06 that reaches a jammed state has a single peak near ϕloc=0.9, reflecting the uniform disk density at jamming that is illustrated in the inset of Fig. 8(b).Discussion
Our results suggest that clogging and jamming processes have different dynamics. Clogging in the presence of random obstacles has signatures of an absorbing transition falling in a directed percolation universality class, and its dynamics are controlled by the average spacing of the obstacles. In the jamming that occurs for higher ϕtot, the dynamics are controlled by the growing correlation length associated with ϕj, the jamming density of an obstacle-free system. These results show that jamming and clogging in obstacles are indeed different phenomena. Jamming is associated with an equilibrium critical point, the formation of a homogeneous rigid state, and short transient times to reach this state, while clogging is a nonequilibrium dynamical phenomenon in which the system evolves over an extended time into a strongly spatially heterogeneous state. Our results have implications for flow though heterogeneous media [33], erosion [34], depinning transitions in particle assemblies [35], and active matter in disordered environments [36,37]. Experimentally our results could be tested using colloidal particles at low flow rates to reduce hydrodynamic effects. It would also be interesting to examine the effects of adding frictional contacts between the disks, since these can change the characteristics of the jamming transition [38,39], or to replace the disks by elongated particles [40] or chains [41,42].Methods
Numerical simulation details
We conduct simulations of nonoverlapping disks and obstacles confined to a two-dimensional plane. The system size is L ×L with L=60, and we use periodic boundary conditions in both the x and y directions. We introduce Np mobile disks of radius Rd=0.5 along with Nps obstacles represented by disks of radius Rd that are not allowed to move. The area coverage of the mobile disks is ϕp=NpπRd2/L2, the area coverage of the obstacles is ϕps=NpsπRd2/L2, and the total area coverage is ϕtot=ϕp+ϕps. The disk dynamics are given by the overdamped equation of motion
| (1) |
References
- [1]
- Liu, A. J. & Nagel, S.R. Nonlinear dynamics: Jamming is not just cool any more. Nature (London) 396, 21-22 (1998).
- [2]
- O'Hern, C. S., Silbert, L. E., Liu, A. J. & Nagel, S. R. Jamming at zero temperature and zero applied stress: The epitome of disorder. Phys. Rev. E 68 011306 (2003).
- [3]
- van Hecke, M. Jamming of soft particles: geometry, mechanics, scaling and isostaticity. J. Phys. Condens. Matter 22, 033101 (2010).
- [4]
- Liu, A. J. & Nagel, S. R. The jamming transition and the marginally jammed solid. Annu. Rev. Condens. Matter Phys. 1, 347-369 (2010).
- [5]
- Reichhardt, C. & Olson, C. J. Aspects of jamming in two-dimensional athermal frictionless systems. Soft Matter 10, 2932-2944 (2014).
- [6]
- Drocco, J. A., Hastings, M. B., Reichhardt, C. J. O. & Reichhardt, C. Multiscaling at Point J: Jamming is a critical phenomenon. Phys. Rev. Lett. 95, 088001 (2005).
- [7]
- Henkes, S. & Chakraborty, B. Jamming as a critical phenomenon: A field theory of zero-temperature grain packings. Phys. Rev. Lett. 95, 198002 (2005).
- [8]
- Olsson, P. & Teitel, S. Critical scaling of shear viscosity at the jamming transition. Phys. Rev. Lett. 99, 178001 (2007).
- [9]
- Candelier, R. & Dauchot, O. Creep motion of an intruder within a granular glass close to jamming. Phys. Rev. Lett. 103, 128001 (2009).
- [10]
- To, K., Lai, P.-Y. & Pak, H. K. Jamming of granular flow in a two-dimensional hopper. Phys. Rev. Lett. 86, 71-74 (2001).
- [11]
- Zuriguel, I., Pugnaloni, L. A., Garcimartín, A. & Maza, D. Jamming during the discharge of grains from a silo described as a percolating transition. Phys. Rev. E 68, 030301(R) (2003).
- [12]
- Chen, D., Desmond, K. W. & Weeks, E. R. Topological rearrangements and stress fluctuations in quasi-two-dimensional hopper flow of emulsions. Soft Matter 8, 10486-10492 (2012).
- [13]
- Thomas, C. C. & Durian, D. J. Geometry dependence of the clogging transition in tilted hoppers. Phys. Rev. E 87, 052201 (2013).
- [14]
- Redner, S. & Datta, S. Clogging time of a filter. Phys. Rev. Lett. 84, 6018-6021 (2000).
- [15]
- Wyss, H. M., Blair, D. L., Morris, J. F., Stone, H. A. & Weitz, D. A. Mechanism for clogging of microchannels. Phys. Rev. E 74, 061402 (2006).
- [16]
- Roussel, N., Nguyen, T. L. H. & Coussot, P. General probabilistic approach to the filtration process. Phys. Rev. Lett. 98, 114502 (2007).
- [17]
- Zuriguel, I. et al. Clogging transition of many-particle systems flowing through bottlenecks. Sci. Rep. 4, 7324 (2014).
- [18]
- Agbangla, G. C., Bacchin, P. & Climent, E. Collective dynamics of flowing colloids during pore clogging. Soft Matter 10, 6303-6315 (2014).
- [19]
- Dressaire, E. & Sauret, A. Clogging of microfluidic systems. Soft Matter 13, 37-48 (2017).
- [20]
- Wyart, M., Nagel, S. R. & Witten, T. A. Geometric origin of excess low-frequency vibrational modes in weakly connected amorphous solids. Europhys. Lett. 72, 486-492 (2005).
- [21]
- Wyart, M., Silbert, L. E., Nagel, S. R. & Witten, T. A. Effects of compression on the vibrational modes of marginally jammed solids. Phys. Rev. E 72, 051306 (2005).
- [22]
- Reichhardt, C. J. O., Groopman, E., Nussinov, Z. & Reichhardt, C. Jamming in systems with quenched disorder. Phys. Rev. E 86, 061301 (2012).
- [23]
- Graves, A. L., Nashed, S., Padgett, E., Goodrich, C. P, Liu, A. J. & Sethna, J. P. Pinning susceptibility: The effect of dilute, quenched disorder on jamming. Phys. Rev. Lett. 116, 235501 (2016).
- [24]
- Nguyen, H. T., Reichhardt, C. & Reichhardt, C. J. O. Clogging and jamming transitions in periodic obstacle arrays. Phys. Rev. E 95, 030902 (2017).
- [25]
- Hinrichsen, E. L., Feder, J. & Jøssang, T. Geometry of random sequential adsorption. J. Stat. Phys. 44, 793-827 (1986).
- [26]
- Corte, L., Chaikin, P. M., Gollub, J. P. & Pine, D. J. Random organization in periodically driven systems. Nature Phys. 4, 420-424 (2008).
- [27]
- Milz, L. & Schmiedeberg, M. Connecting the random organization transition and jamming within a unifying model system. Phys. Rev. E 88, 062308 (2013).
- [28]
- Tjhung, E. & Berthier, L. Criticality and correlated dynamics at the irreversibility transition in periodically driven colloidal suspensions. J. Stat. Mech. 2016 033501 (2016).
- [29]
- Reichhardt, C. & Reichhardt, C. J. O. Random organization and plastic depinning. Phys. Rev. Lett. 103, 168301 (2009).
- [30]
- Shaw, G., Mandal, P., Banerjee, S. S., Niazi, A., Rastogi, A. K., Sood, A. K., Ramakrishnan, S. & Grover, A. K. Critical behavior at depinning of driven disordered vortex matter in 2H-NbS2. Phys. Rev. B 85, 174517 (2012).
- [31]
- Okuma, S., Tsugawa, Y. & Motohashi, A. Transition from reversible to irreversible flow: Absorbing and depinning transitions in a sheared-vortex system. Phys. Rev. B 83, 012503 (2011).
- [32]
- Hinrichsen, H. Non-equilibrium critical phenomena and phase transitions into absorbing states. Adv. Phys. 49, 815-958 (2000).
- [33]
- Mays, D. C. & Hunt, J. R. Hydrodynamic aspects of particle clogging in porous media. Environ. Sci. Technol. 39, 577-584 (2005).
- [34]
- Aussillous, P., Zou, Z., Guazzelli, E., Yan, L. & Wyart, M. Scale-free channeling patterns near the onset of erosion of sheared granular beds. Proc. Natl. Acad. Sci. 113, 11788-11793 (2016).
- [35]
- Reichhardt, C. & Reichhardt, C. J. O. Depinning and nonequilibrium dynamic phases of particle assemblies driven over random and ordered substrates: a review. Rep. Prog. Phys 80, 026501 (2017).
- [36]
- Bechinger C., Di Leonardo R., Löwen, H., Reichhardt, C., Volpe, G. & Volpe, G. Active particles in complex and crowded environments. Rev. Mod. Phys. 88, 045006 (2016).
- [37]
- Morin, A., Desreumaux, N., Caussin, J.-B. & Bartolo, D. Distortion and destruction of colloidal flocks in disordered environments. Nature Phys. 13, 63-67 (2017).
- [38]
- Bi, D., Zhang, J., Chakraborty, B. & Behringer, R. P. Jamming by shear. Nature 480, 335 (2011).
- [39]
- Henkes, S., Quint, D. A., Fily, Y. & Schwarz, J. M. Rigid cluster decomposition reveals criticality in frictional jamming. Phys. Rev. Lett. 116, 028301 (2016).
- [40]
- Gerbode, S. J., Agarwal, U., Ong, D. C., Liddell, C. M., Escobedo, F. & Cohen, I. Glassy dislocation dynamics in 2D colloidal dimer crystals. Phys. Rev. Lett. 105, 078301 (2010).
- [41]
- Zou, L.-N., Cheng, X., Rivers, M. L., Jaeger, H. M. & Nagel, S. R. The packing of granular polymer chains. Science 326, 408-410 (2009).
- [42]
- Lopatina, L. M., Reichhardt, C. J. O. & Reichhardt, C. Jamming in granular polymers. Phys. Rev. E 84, 011303 (2011).
Acknowledgments
This work was carried out under the auspices of the National Nuclear Security Administration of the U.S. Department of Energy at Los Alamos National Laboratory under Contract No. DEAC52-006NA25396. The authors wish to thank LDRD at LANL for financial support through grant 20170147ER.Author contributions:
C.R. and C.J.O.R. conceived the work and wrote the manuscript, H.P. and A.L. conducted the simulations and performed data analysis.Additional information
Competing interests: The authors declare no competing interests.File translated from TEX by TTHgold, version 4.00.
Back to Home