 Figure 4:
(Color online)
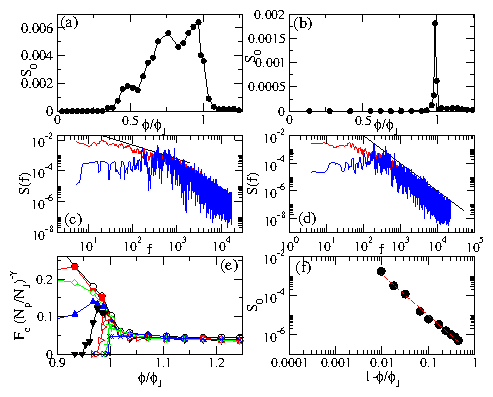
(a,b) S0 vs ϕ/ϕJ
for FD=1.1Fc.
(a) Np/NJ = 0.277. S0 drops at the onset of
jamming and at low ϕ/ϕJ.
(b) Np/NJ = 0.0346.
S0 peaks just below jamming.
(c) S(f) vs f from the system in
(a) for (upper red curve) ϕ/ϕJ = 0.968 where the
depinning is plastic and (lower blue curve) ϕ/ϕJ=1.141 where the
depinning is elastic and a narrow band noise signal appears. Solid black
line: a fit to 1/f0.9.
(d) S(f) vs f for the system in (b)
for (upper red curve) ϕ/ϕJ = 0.989 and (lower blue curve)
ϕ/ϕJ = 1.141 showing narrow band noise in the jammed phase.
Solid black line: a fit to 1/f2.
(e) The data from Fig. 2 plotted as Fc (Np/NJ)−γ vs ϕ/ϕJ
with γ = 0.43 for
Np/NJ = 0.828 (black \bigcirc),
0.415 (red black square),
0.277 (green lozenge),
0.138 (blue black triangle),
0.09267 (black black triangle down),
0.0346 (red triangle right),
0.00692 (green +),
and 0.00138 (blue ×), showing
noncritical scaling of Fc in the jammed region.
(f) The data from Fig. 4(b) plotted as S0 vs 1−ϕ/ϕJ showing
scaling below the jamming transition. The dotted line is a fit
to S0 ∝ (1−ϕ/ϕJ)−β
with β = 2.09.
Figure 4:
(Color online)
(a,b) S0 vs ϕ/ϕJ
for FD=1.1Fc.
(a) Np/NJ = 0.277. S0 drops at the onset of
jamming and at low ϕ/ϕJ.
(b) Np/NJ = 0.0346.
S0 peaks just below jamming.
(c) S(f) vs f from the system in
(a) for (upper red curve) ϕ/ϕJ = 0.968 where the
depinning is plastic and (lower blue curve) ϕ/ϕJ=1.141 where the
depinning is elastic and a narrow band noise signal appears. Solid black
line: a fit to 1/f0.9.
(d) S(f) vs f for the system in (b)
for (upper red curve) ϕ/ϕJ = 0.989 and (lower blue curve)
ϕ/ϕJ = 1.141 showing narrow band noise in the jammed phase.
Solid black line: a fit to 1/f2.
(e) The data from Fig. 2 plotted as Fc (Np/NJ)−γ vs ϕ/ϕJ
with γ = 0.43 for
Np/NJ = 0.828 (black \bigcirc),
0.415 (red black square),
0.277 (green lozenge),
0.138 (blue black triangle),
0.09267 (black black triangle down),
0.0346 (red triangle right),
0.00692 (green +),
and 0.00138 (blue ×), showing
noncritical scaling of Fc in the jammed region.
(f) The data from Fig. 4(b) plotted as S0 vs 1−ϕ/ϕJ showing
scaling below the jamming transition. The dotted line is a fit
to S0 ∝ (1−ϕ/ϕJ)−β
with β = 2.09.
|


