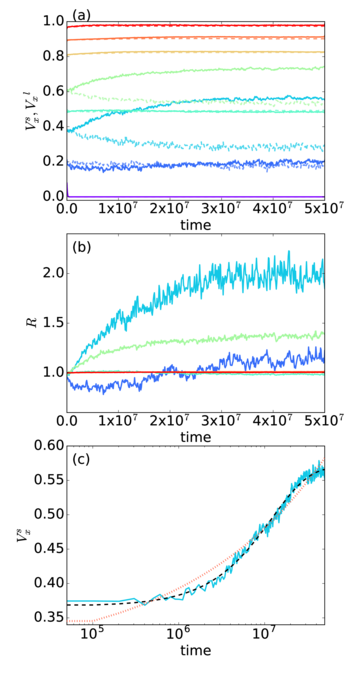
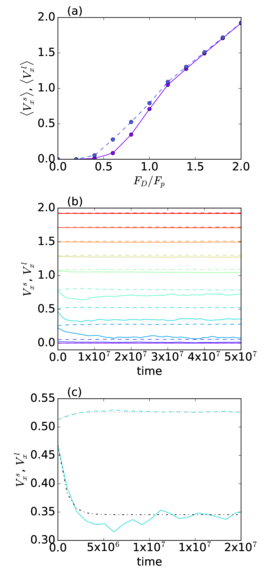
 Figure 15:
(a) 〈Vxs〉 (solid lines)
and 〈Vxl〉 (dashed lines)
vs FD/Fp
in a sample with Ψ = 1.4,
Ns=0.9Nd, and Nl=0.1Nd at
ϕ = 0.48.
(b) The instantaneous disk velocity Vxs (solid lines)
and Vxl (dashed lines) versus time for the small and large
disks, respectively, in the sample from panel (a) at
FD=0.2 (phase I),
0.4,
0.6,
0.8 (phase IIIa),
1.0,
1.2 (phase IVa),
1.4,
1.6,
1.8,
and 2.0 (phase V),
from bottom to top.
The large disks reach a steady state quickly,
while the small disks
continue to evolve at
t > 107 timesteps.
(c) A detail showing only the FD=0.8 curves in phase IIIa from panel (b).
Dot-dashed line: A fit to 〈Vxs〉 = et/τs with τs=8.46 ×10⁵.
Dotted line: A fit to 〈Vxl〉 = et/τl with τl=1.19 ×10⁶.
|
