Velocity force curves, laning, and jamming for oppositely driven disk systems
C. Reichhardt and C.J.O. Reichhardt*
Theoretical Division, Los Alamos National Laboratory, Los Alamos, New Mexico 87545,
USA. E-mail: cjrx@lanl.gov; Fax: +1 505 606 0917; Tel: +1 505 665 1134
Received 2nd November 2017,
Accepted 1st December 2017
DOI: 10.1039/c7sm02162c
rsc.li/soft-matter-journal
Using simulations we examine a two-dimensional disk system in which two disk
species are driven in opposite directions. We measure the average velocity of
one of the species versus the applied driving force and identify
four phases as a function of drive and disk density: a jammed state, a completely
phase separated state, a continuously mixing phase, and a laning phase.
The transitions between these phase are correlated with jumps in the
velocity-force curves that are similar to the behavior observed at dynamical
phase transitions in driven particle systems with quenched disorder such as
vortices in type-II superconductors. In some cases the transitions between
phases are associated with negative differential mobility in which the average
absolute velocity of either species decreases with increasing drive. We also consider
the situation where the drive is applied to only one species as well as systems in
which both species are driven in the same direction with different drive amplitudes.
We show that the phases are robust against the addition of thermal fluctuations.
Finally, we discuss how the transitions we observe could be related to absorbing
phase transitions where a system in a phase separated or laning regime organizes
to a state in which contacts between the disks no longer occur and dynamical
fluctuations are lost.
1 Introduction 2 Simulation 3 Velocity force curves and dynamic phases 4 Varied species ratios and driving force ratios 5 Summary References
A wide variety of systems can be modeled as a collection of interacting particles
that, when driven over a quenched substrate, exhibit depinning and dynamical
transitions as a function of increasing driving force [1]. Such systems include
vortices in type-II superconductors [2, 3, 4], electron crystals [5],
driven colloidal systems [6, 7, 8, 9, 10], and sliding friction [11, 12].
At low drives these systems are in a pinned
state where the velocity is zero, while above a critical driving force,
the particles become depinned and slide. Within the
moving states there can be different dynamical modes of motion such as
a plastic phase with strong fluctuations in
the particle positions and velocities [1, 2, 4, 6, 7].
At higher drives the system can
organize to a dynamically ordered state such as a moving crystal [2, 3, 13]
or moving smectic [4, 13, 14, 15, 16]. For particles driven
over a periodic substrate, additional types of dynamic phases can appear such
as soliton motion or one-dimensional (1D) to
two-dimensional (2D) transitions,
along with ordered and disordered flow phases [1, 8, 9, 10, 11, 12, 17, 18, 19],
negative mobility [20], and sorting dynamics [21].
The transitions between these different dynamical states are associated
with cusps, jumps, or dips in
the velocity force curves,
as well as with global changes in the ordering of the particle configurations
or the amount of dynamical fluctuations.
In all these systems the pinning arises from quenched disorder that
is fixed in space; however, there can also be cases
where the pinning is not fixed but can move in response to the
driven particles.
For example, if a number of particles that are not coupled to the
external drive can block the motion of
particles that are coupled to the external drive,
the driven particles can move the blocking particles and over time rearrange
them to create a new landscape or pattern [22, 23].
A previously studied system that closely resembles this case is
two species of interacting particles driven in opposite directions that
exhibit a variety of
dynamical behavior, including a transition to a laning state [24, 25, 26, 27, 28, 29, 30, 31]
where the particles separate into
quasi one-dimensional chains of the same species, as well as regimes in which
the particles mix and undergo disordered flow.
Such phases have been observed
in experiments on
colloids moving in opposite directions [32, 33] and dusty plasma systems [34].
This type of system can also exhibit
pattern forming states [27, 28, 35, 36, 37] and jammed or clogged states [27, 38].
Certain active matter systems
have similar laning behavior [39], such as pedestrian flows
that can be mimicked by particles moving in opposite directions [40].
The velocity-force relations for laning systems have never been
systematically studied,
nor have parallels between
laning systems and systems with quenched disorder that exhibit depinning and
distinct dynamic phases been drawn.
In this work we examine the velocity-force relations for
a two-dimensional system of disks
under lane formation conditions.
Half the disks are driven
in one direction and the other half in the opposite direction,
and we measure the net velocity
of one disk species along with the amount of six-fold ordering
as a function of the driving force and disk density.
Previous studies of laning transitions have generally focused on systems
of colloids or particles with Yukawa interactions [24, 26]. In our case
the system is close to the hard disk limit
and the density ϕ is defined as the area covered by the
disks. For ϕ > 0.9 the
disks form a triangular solid or jammed state [41].
For ϕ ≥ 0.55 we find that the disks can organize into four possible
dynamic phases: a jammed phase (I) where all the disks
are in contact forming a triangular solid with zero net velocity;
a fully phase separated state (II) where the disks organize into two bands
with crystalline order
moving in opposite directions and where disk-disk collisions do not occur;
a strongly fluctuating disordered phase (III)
where disk collisions are continuously occurring and the system has liquidlike features;
and a laning state (IV)
where the disks form a series of lanes, disk-disk collisions are absent,
velocity fluctuations drop to zero, and the system has smectic properties.
The transitions between these phases correlate
with changes in the net velocity of each disk species as well
as with changes in the disk ordering and the nature of
the dynamic fluctuations.
The mobility in the phase separated and laning states
is high since the disks can move freely past one another without collisions,
while the transition to the
disordered phase is accompanied by a drop in the net velocity, leading to
a region of negative differential mobility similar to that found
in transitions from laminar flow to turbulent flow as a function of
increasing drive in certain systems with quenched disorder [17, 18, 19].
For ϕ < 0.55 the system
always organizes into a laning state where all disk collisions are lost.
We show that when finite thermal fluctuations
are introduced,
all the phases are robust at low temperatures.
As the temperature increases, phase II vanishes,
while the III-IV transition remains robust but
shifts to higher values of the external drive.
We also examine the situation where only one species is driven and show that the
same four phases can arise in the high density limit.
Here the jammed state consists of a
drifting solid phase
where the non-driven disks lock to the driven disks, while
the phase separated and laning states are composed of assemblies
of driven disks moving past stationary regions of
non-driven disks.
These phases can even occur when both species are driven in the same direction with
different couplings to the external drive.
We conjecture that some of
the transitions between phases fall into the class of
absorbing phase transitions [42]
when the system reaches a state where the disk collisions and fluctuations are
completely lost, similar to the
recently observed irreversible-reversible
transitions in periodically sheared disk systems [43]
and systems with quenched disorder [44, 45, 46, 47] that exhibit
depinning transitions or transitions into a reversible state. We
measure the transient time τ required for the system to organize into
phase IV and find that as the III-IV transition is approached from above,
τ
increases as a power law
with an exponent of ν = 1.35,
in agreement with previous studies of
systems with absorbing phase transitions.
We model a 2D system of size L ×L where L=36
with periodic boundary conditions
in the x and y directions
containing Nd disks of radius Rd=0.5.
The disk-disk interaction is modeled as a finite range repulsive
harmonic spring.
The overdamped equation of motion for disk i is
η
dRi
dt
= Fidd + FDi .
(1)
The disk-disk interaction force is
Fdd = ∑i ≠ jNdk(2Rd − |rij|)Θ(2Rd − |rij|) ∧rij,
where rij = Ri − Rj,
∧rij = rij/|rij|, and Θ is the Heaviside
step function.
The spring constant k = 60, and we
find negligible changes in the dynamics for larger values of k.
Each disk is subjected to an applied driving force
FDi = AiFD∧x, and N1 disks
are driven in the positive x direction with
Ai = C, where C=1.0 unless otherwise noted.
The remaining N2=Nd−N1 disks
are driven in the negative x direction with Ai = −1.0.
After applying the drive,
we wait for the system to settle into
a steady state.
This transient waiting time is a strong function of disk density, and under
some conditions can be as large as
1 ×10⁸ simulation time steps.
After the system
reaches a steady state we measure
the average disk velocity for each species and normalize
it by N1(2)
to obtain the average velocity per disk
〈V1(2)〉 = N1(2)−1∑N1(2)i=1vi·∧x ,
where vi is the
instantaneous velocity of disk i. Since we use overdamped dynamics with a
damping constant of η = 1.0,
in the free flow limit the disks move at a velocity of
〈V1〉 = CFD and 〈V2〉 = −FD.
The density ϕ is defined
as the area coverage of the disks,
ϕ = NdπR2d/L2, and in the absence of driving
the system forms a uniform crystalline solid at ϕ = 0.9.
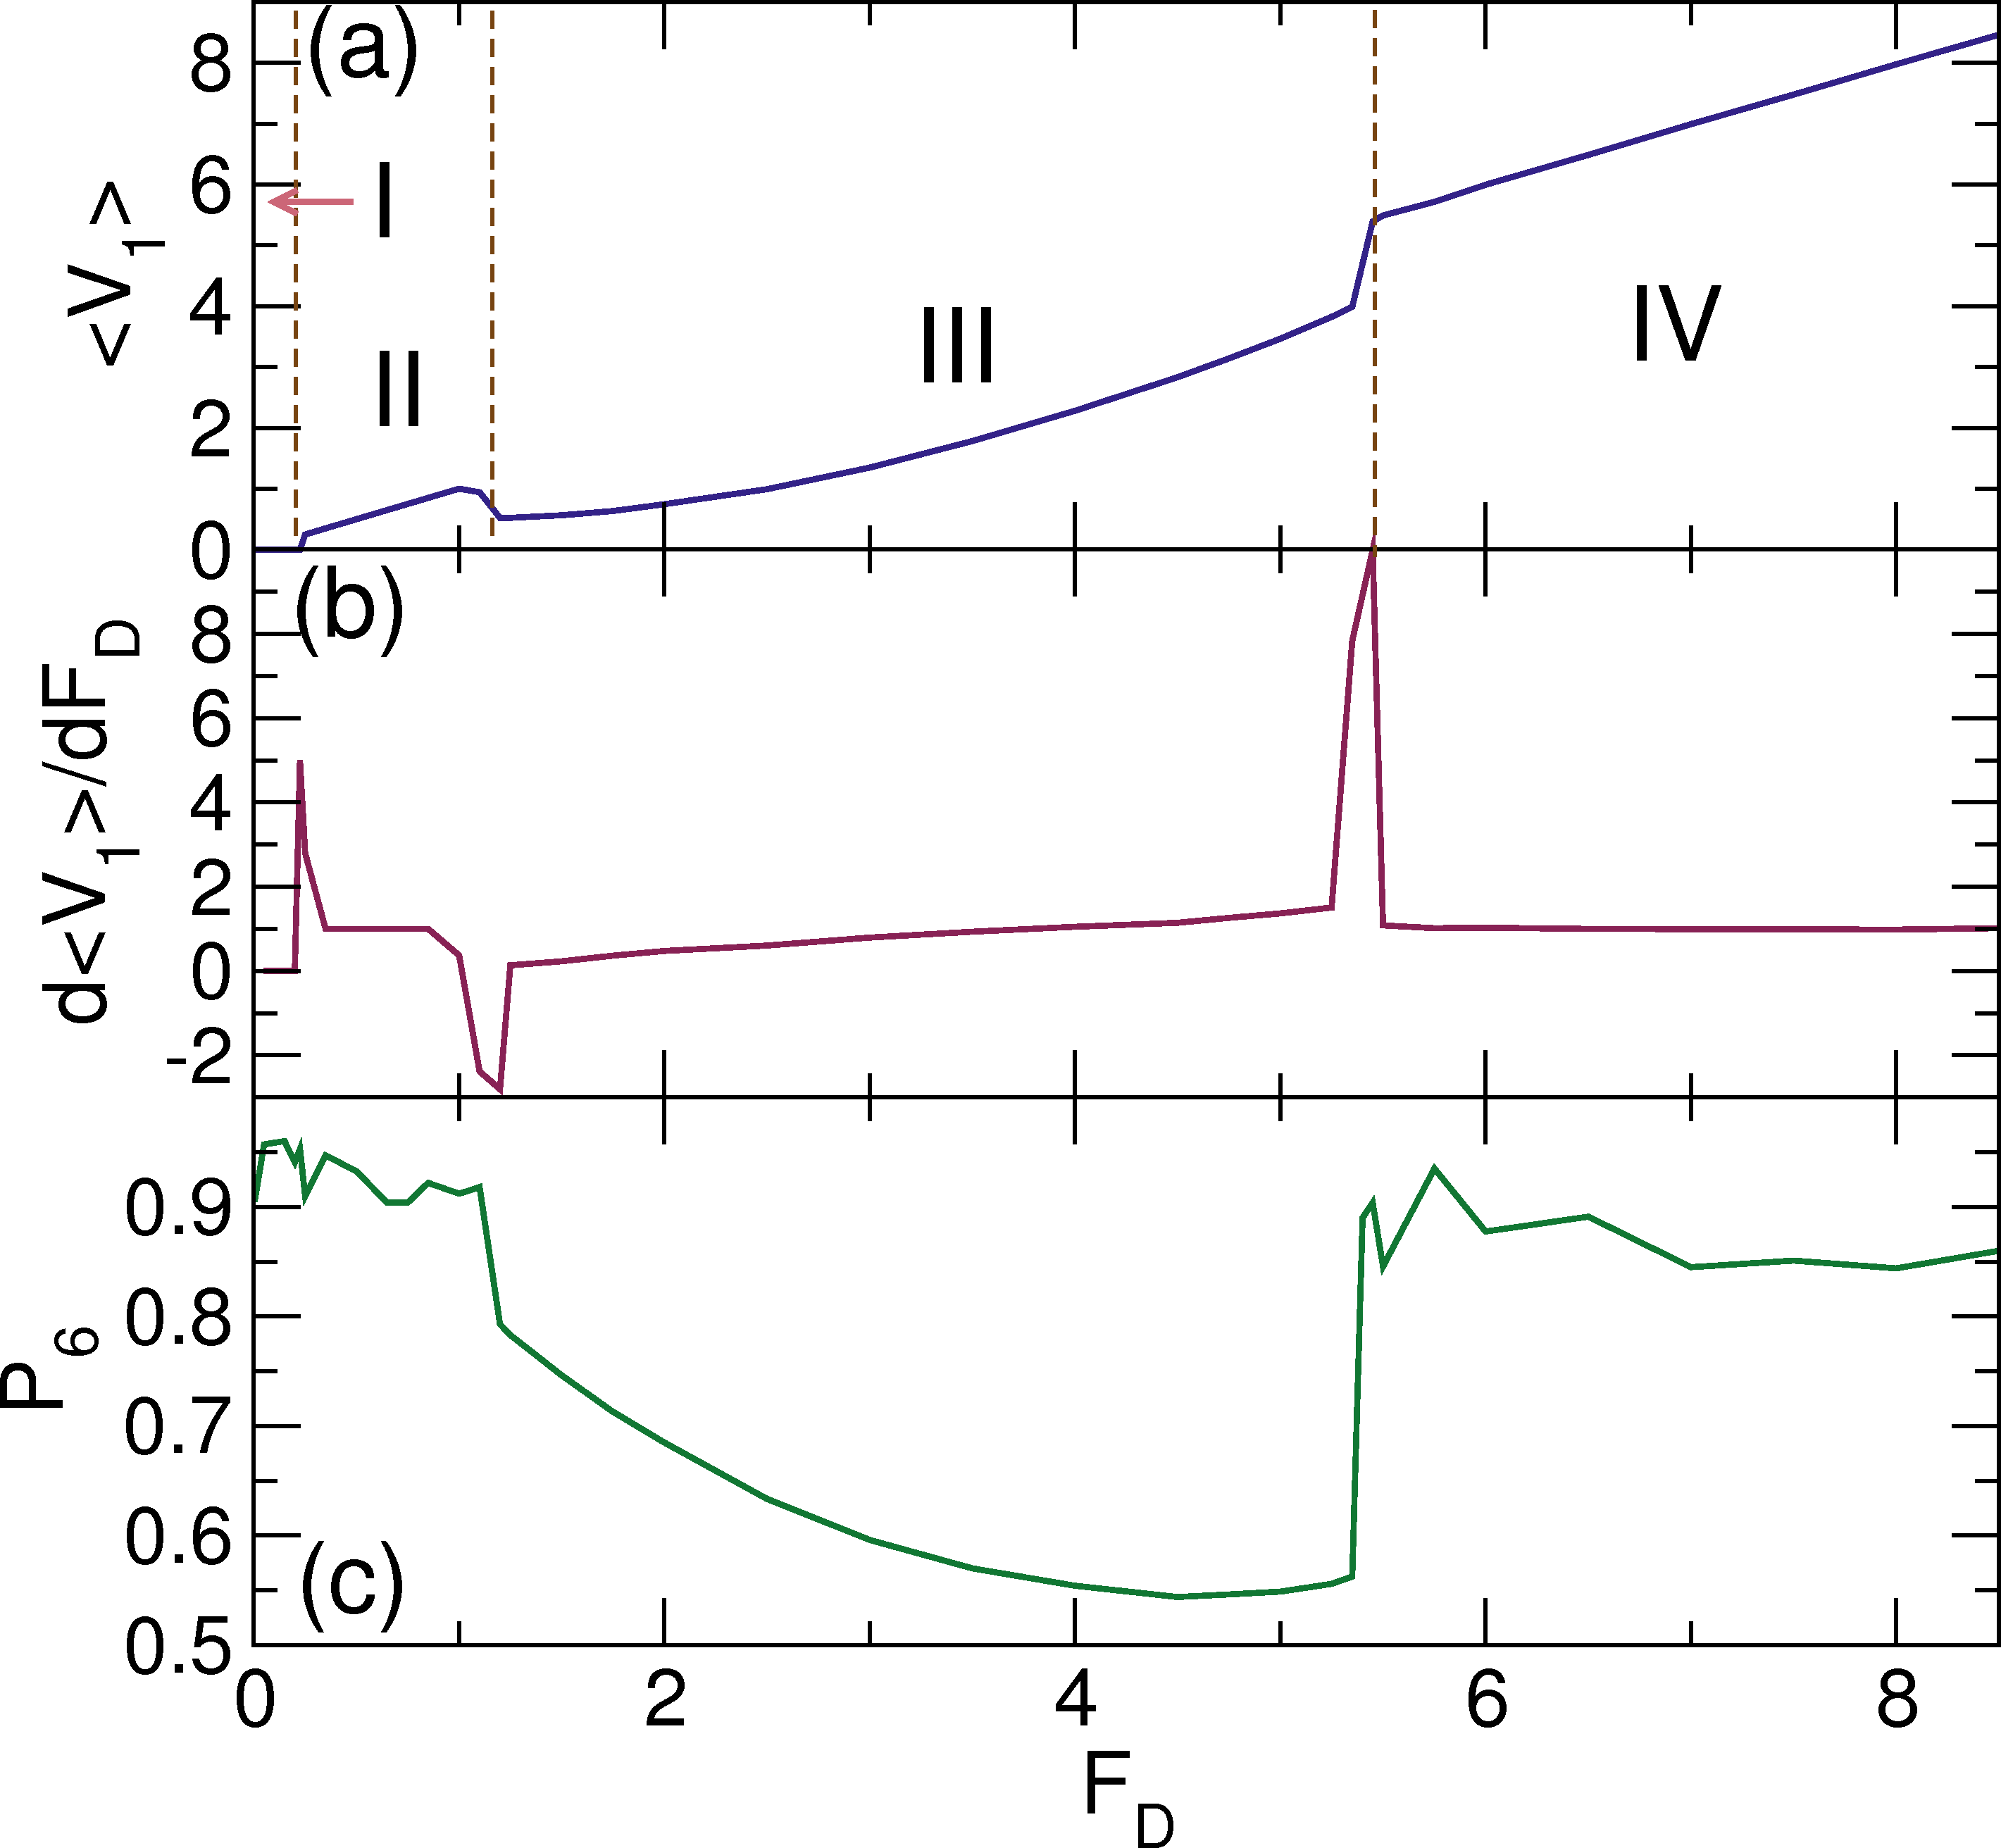
Fig. 1: (a) The average velocity per disk 〈V1〉, measuring only
the N1 disks driven in the +x direction, vs FD
for a system with oppositely driven disks and N1=N2=0.5Nd at
ϕ = 0.848.
(b) d〈V1〉/dFD vs FD for the same system.
(c) The corresponding fraction of sixfold coordinated disks P6 vs FD.
We find four phases: I (jammed), II (phase separated), III (disordered flow),
and IV (laning).
The transitions between the states appear as jumps or dips
in the various measures.
Fig. 2: The disk configurations from the system in Fig. 1.
The blue disks (species 1) are driven in the
+x direction and the red disks (species 2) are driven
in the −x direction. (a) The jammed phase I at FD = 0.15.
(b) The phase separated state II at FD = 0.75. (c) The disordered phase III
at FD = 3.0. (d) The laning phase IV at FD = 6.5.
We first consider samples in which N1=N2=0.5Nd.
In Fig. 1(a) we plot 〈V1〉 versus FD
for the disks driven in the +x direction
for a system with ϕ = 0.848, and in Fig. 1(b) we show
d〈V1〉/dFD versus FD.
We also measure the fraction P6 of sixfold coordinated disks for all disks,
P6=∑iNdδ(zi−6) where the coordination number zi of disk i is
obtained using a Voronoi construction, and plot P6 versus FD in
Fig. 1(c).
The corresponding 〈V2〉 versus FD
curve for disks driven in the −x direction
looks exactly the same as the curve in Fig. 1(a) but is negative.
We identify four distinct dynamic phases
based on transitions in the velocity-force curve.
The jammed phase (I)
appears for 0 < FD < 0.3 and has
no disk motion, 〈V1〉 = 0, and
strong sixfold disk ordering, P6 ≈ 0.95.
In phase I, the
disks form a dense cluster with triangular order, as illustrated in
the disk configuration image in Fig. 2(a)
for FD = 0.15.
Within the jammed phase the local disk density ϕloc
is close to ϕloc=0.9, and since this is lower than the total disk density,
there is a small region containing no particles (ϕloc=0).
We note that in phase I P6 < 1
since the disks on the edge of the jammed cluster do not have six neighbors.
At FD = 0.3, a jump in 〈V1〉 and
a peak in d〈V1〉/dFD indicate
the transition from phase I to phase II,
which is similar to the
peak in d〈V〉/dFD observed in systems with
quenched disorder at the pinned to
sliding transition [1].
Phase II, the phase separated state, extends over the range 0.3 < FD < 1.15,
and in this phase 〈V1〉 increases linearly with
increasing FD and
d〈V1〉/FD = 1.0,
indicating that the particles are in a free flow regime.
Additionally, P6 ≈ 0.92 and
both species exhibit triangular ordering as shown in Fig. 2(b) at FD = 0.75.
At FD = 1.15 we find a transition from phase II to phase III
accompanied by a drop in 〈V1〉
which produces a negative spike in d〈V1〉/dFD.
This is an example of negative differential mobility where the
disk velocity decreases with increasing drive.
The II-III transition is also associated with a drop in P6 when
the system enters the disordered flow phase.
In systems with
quenched disorder, negative differential mobility has also been
reported at transitions from ordered
to disordered or turbulent flow phases [11, 17, 18, 19].
Phase III appears for 1.15 < FD < 5.45,
and is characterized by strongly fluctuating structures of the type
shown in Fig. 2(c) for FD = 3.0.
The two particle species
are strongly mixed and the sixfold ordering is lost.
The disks continuously undergo collisions and show strong
velocity deviations in the y direction, transverse to the drive.
Within phase III, P6 gradually decreases to P6 ≈ 0.55 near
FD = 5.45.
The transition from phase III to phase IV appears
as an upward jump in both 〈V1〉
and P6 along with a positive peak in
d〈V1〉/dFD.
As shown in Fig. 2(d) at FD=6.5,
in phase IV
the disks form multiple oppositely moving lanes.
There is considerable triangular ordering of the disks
within each lane which produces the
increase in P6 at the III-IV transition.
For higher values of FD, the system
maintains phase IV flow
and d〈V1〉/dFD = 1.0,
indicating that the disks are in a free flow regime.
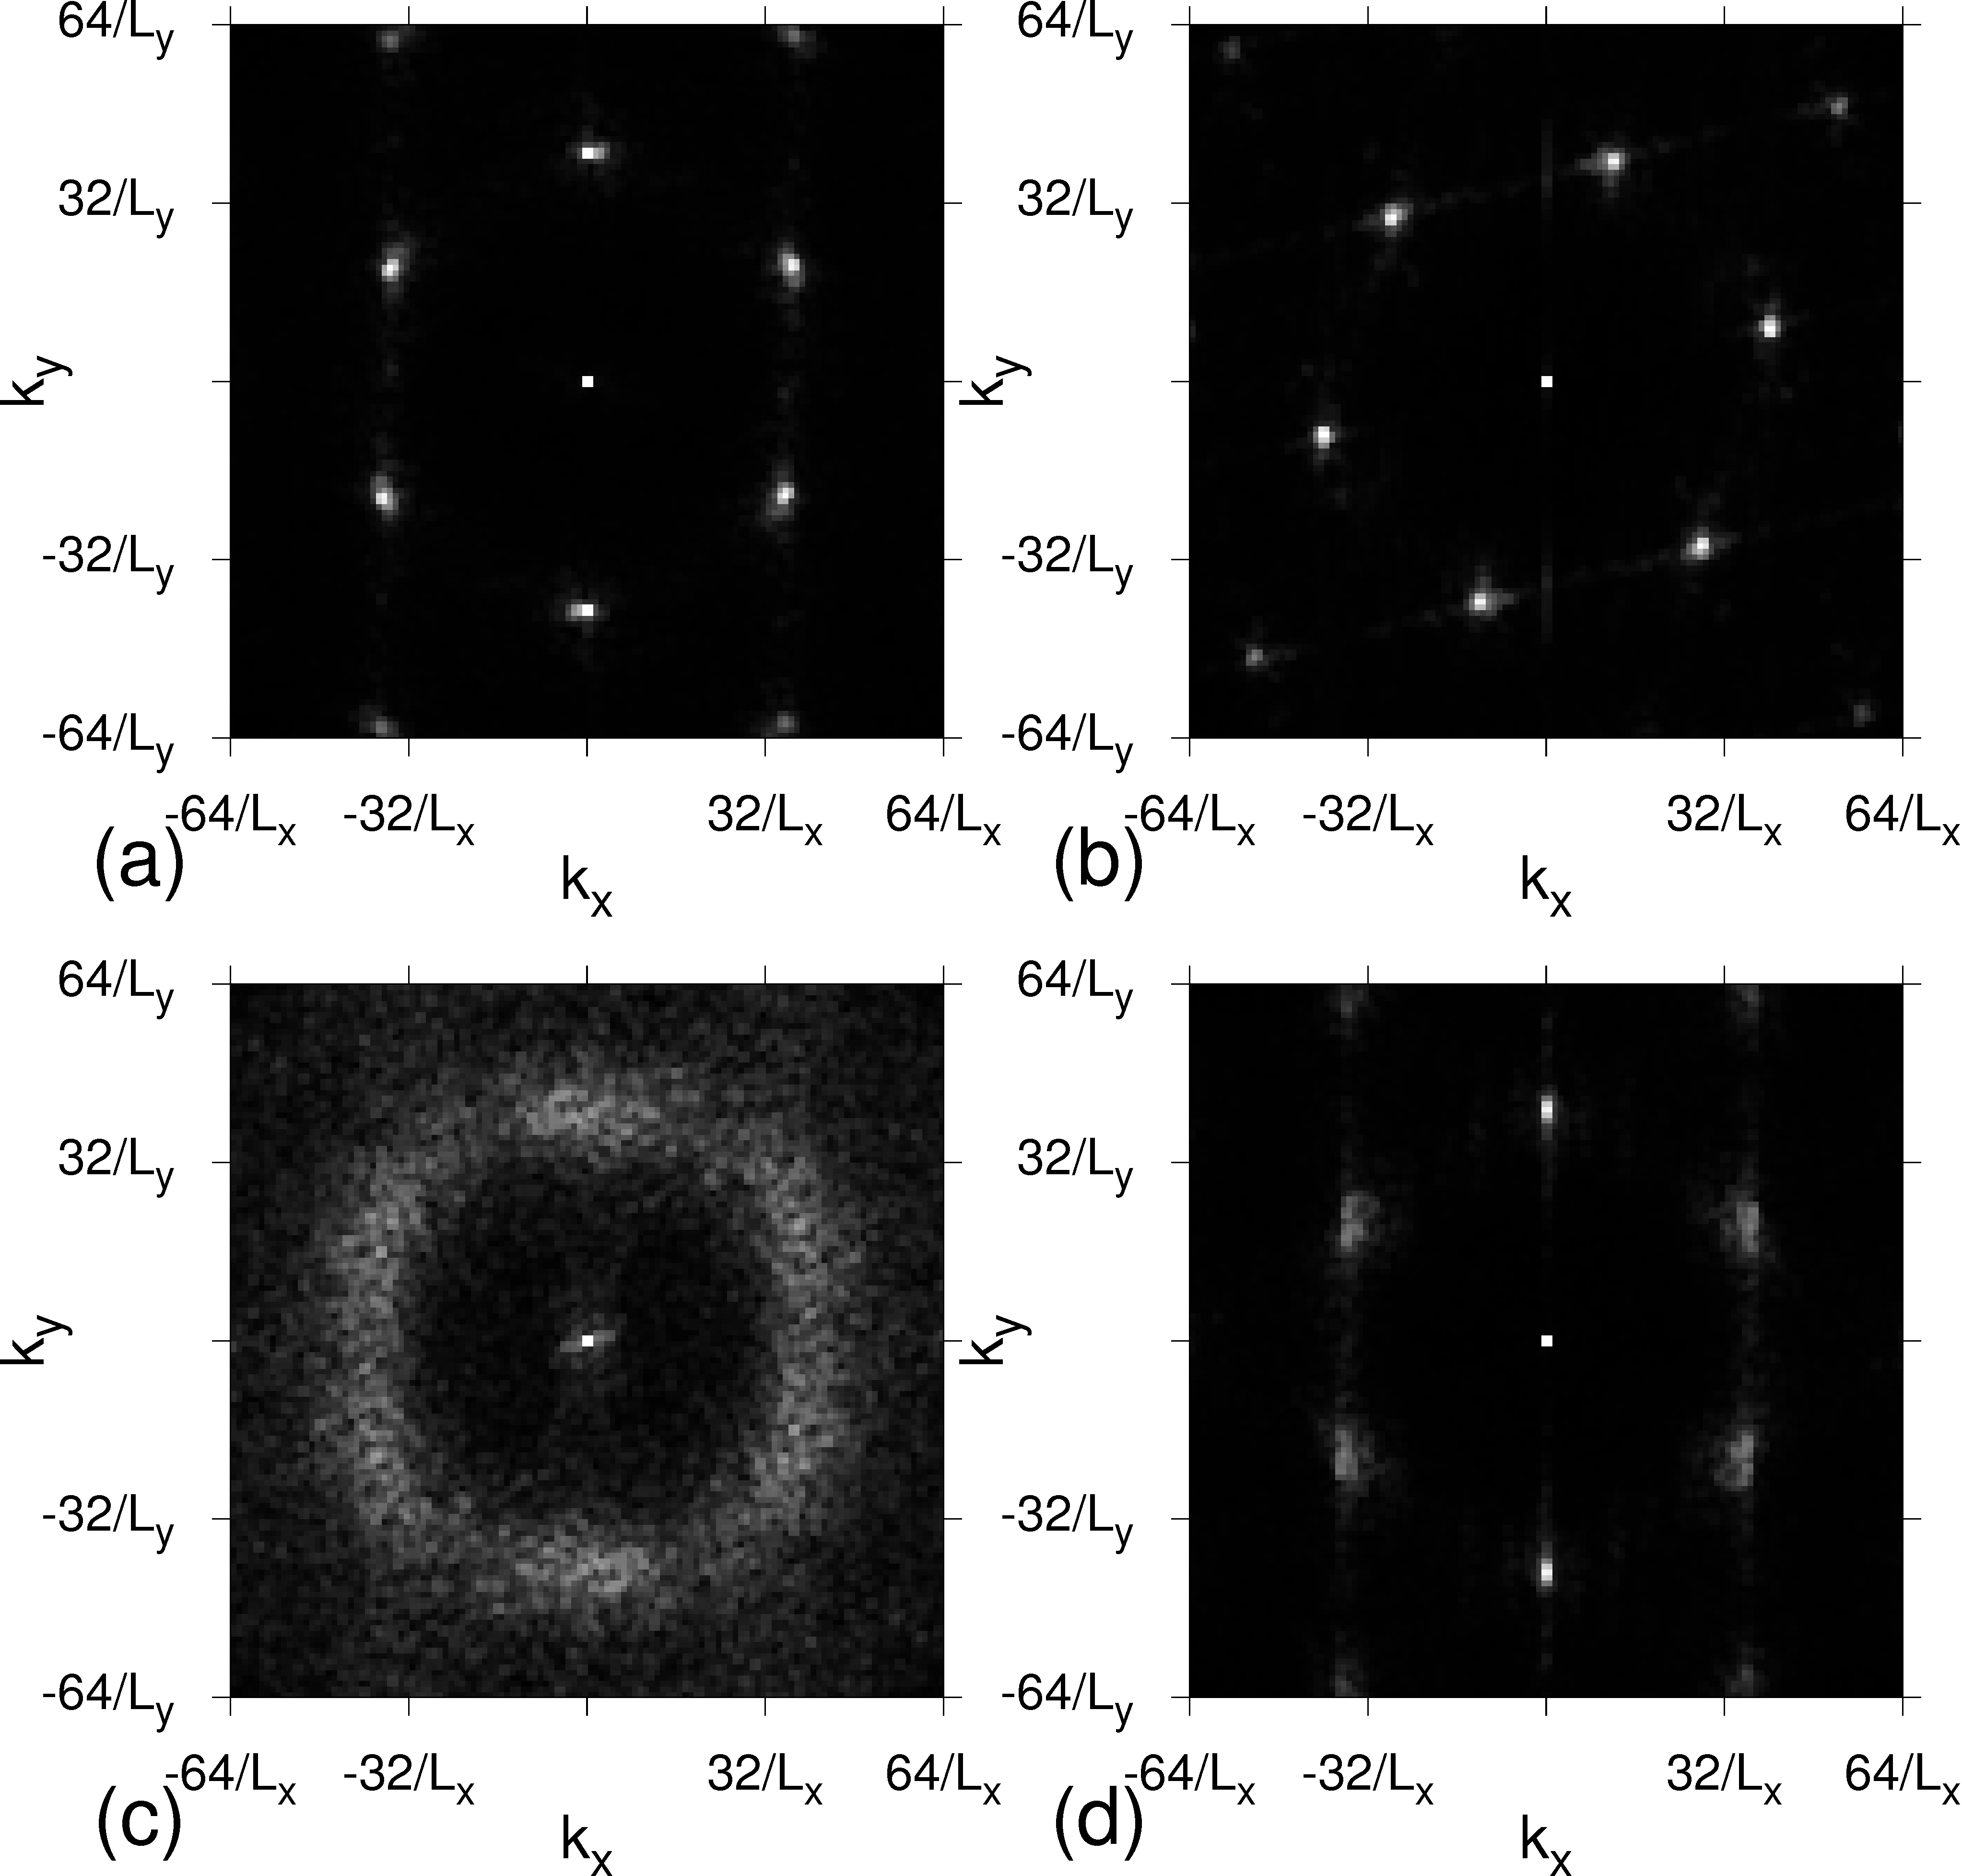
Fig. 3: The structure factor S(k) for the four phases in Fig. 2.
(a) The jammed phase I at FD=0.15 has triangular ordering.
(b) The phase separated state II at FD=0.75 has triangular ordering.
(c) The disordered flow phase III at FD=3.0
shows a ring shape indicating liquid ordering.
(d) The laning phase IV at FD=6.5
has a smectic character with weak triangular ordering.
We can characterize the structure of the disks in the different phases
using the
structure factor
S(k)=Nd−1|∑iNdexp(−ik ·ri)|2 .
In Fig. 3(a) we plot S(k) for
the system in Fig. 2(a) in phase I at FD = 0.75,
where we find six peaks indicative of triangular ordering.
In phase II, Fig. 3(b)
shows a sixfold pattern of peaks with
a small amount of smearing of the peaks.
The disordered flow phase III in
Fig. 3(c)
has a ring pattern indicative
of liquid ordering,
while in Fig. 3(d), the laning phase IV
has two strong peaks at kx = 0.0 and four weaker side peaks consistent with
a moving smectic structure containing some local triangular ordering.
The changes in P6 and S(k) from a liquid structure to a moving smectic
signature
as a function of increasing FD are similar to the transitions observed
for particles
moving over quenched disorder
such as vortices in type-II superconductors [2, 3, 15, 16].
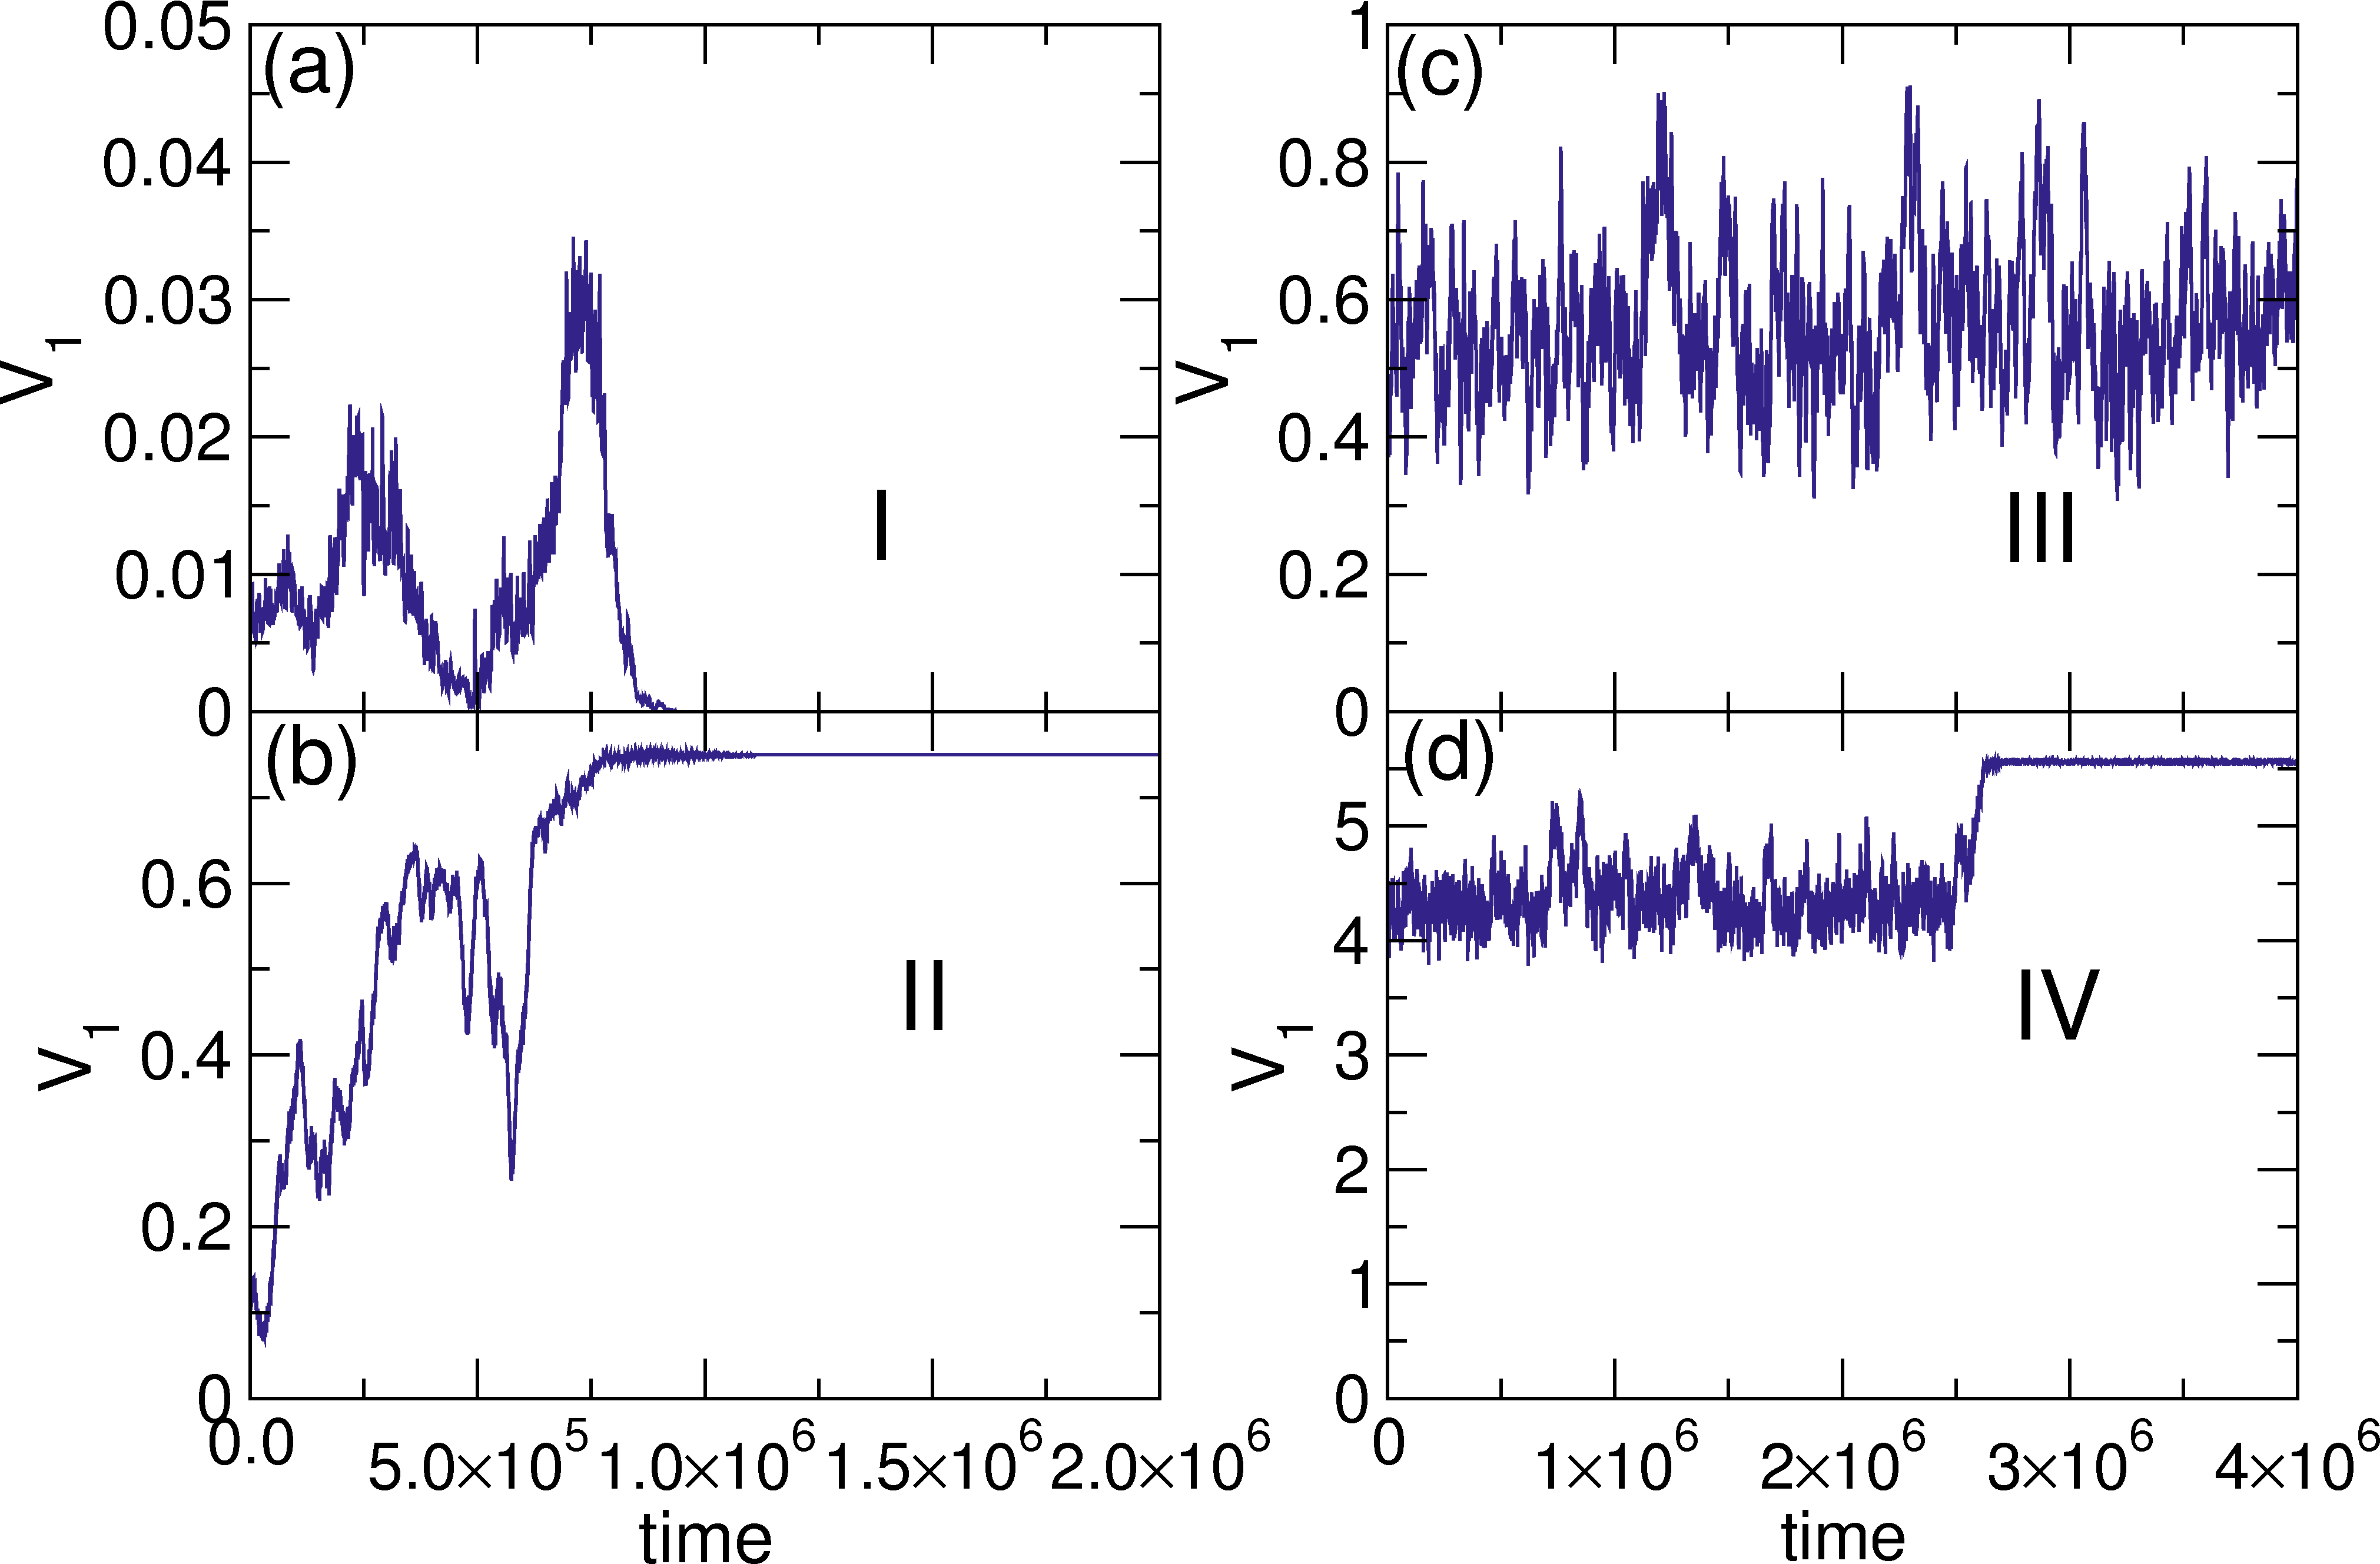
Fig. 4: The instantaneous velocity V1 per disk vs time
for species 1 for the system in Fig. 1 at ϕ = 0.848.
(a) Phase I at FD = 0.15, where V1 goes to zero.
(b) Phase II at FD = 0.75,
where V1 saturates to a fluctuation-free flowing state with V1 = 0.75.
(c) Phase III at FD = 1.5,
where the system remains in a strongly fluctuating state with
〈V1〉 = 0.56.
(d) Phase IV at FD = 5.57,
where the system is initially in a fluctuating state and organizes
at later times into a fluctuation-free flowing state
with V1 = 5.57.
To identify the dynamic fluctuations of the
different phases, we examine the time series of the
instantaneous velocity V1(t) of species 1 disks in the different phases.
In Fig. 4(a) we plot V1 versus
time in phase I at FD = 0.15.
Initially V1 is in
a fluctuating transient state indicating that the disks are moving,
but at later times
the system organizes into a jammed state with
V1 = 0.
In phase III at FD=0.75, Fig. 4(b) shows
that there are initially strong fluctuations in V1 but that at later times
the system settles into a fluctuation-free
flowing state with V1 = 0.75.
This corresponds to the formation of the
phase separated state, where V2=−0.75.
The absence of fluctuations in
V1 and the fact that V1=FD
indicate that the disks are in a completely free flow state
and that disk-disk collisions
no longer occur.
In Fig. 4(c) for
phase III at FD = 1.5,
V1 strongly fluctuates between
V1=0.4 and V1=0.9, and the
average velocity 〈V1〉 = 0.56 is almost three
times smaller than the free flow value of 〈V1〉 = 1.5.
In this phase, the velocity continues to fluctuate out to the longest simulation times
we consider, and the strong fluctuations indicate that there are continuous disk-disk
collisions that impede the flow of the disks in both directions.
Figure 4(d) shows phase IV flow at FD = 5.57,
where the system is initially in a fluctuating flow
phase similar to phase III, but organizes at later times
into a non-fluctuating free flow state
where all disk-disk collisions are lost.
Fig. 5: (a) 〈V1〉 vs FD for a system with
N1=N2=0.5Nd
at ϕ = 0.727. (b) The corresponding mobility
M1=〈V1〉/FD vs FD
shows that the I-II and III-IV transitions are shifted to lower values of FD
compared to the ϕ = 0.848 system.
(c) 〈V1〉 and (d) the mobility M1 vs FD
for a system with ϕ = 0.54, where the disks are always in phase IV,
the velocity-force curve is linear, and M1=1.
We investigate the evolution of the phases as a function of ϕ and
find that for decreasing ϕ the III-IV transition
drops to lower values of FD.
In Fig. 5(a) we plot 〈V1〉
versus FD for the system in Fig. 1
at ϕ = 0.727,
while Fig. 5(b) shows the corresponding mobility
M1=〈V1〉/FD versus FD.
The I-II transition has dropped to FD=0.1
and the mobility in phase I is M1=0.
The II-III transition occurs at roughly the same value
of FD as in the ϕ = 0.848 system, but
the III-IV transition drops to FD = 4.0.
When the system is in free flow in phases II and IV,
M1=1,
but the mobility is substantially reduced in the disordered flow phase III.
In Fig. 5(c,d) we plot
〈V1〉 and the mobility
M1 versus FD for a sample with ϕ = 0.54,
where the disks always organize into phase IV flow,
the velocity-force curve is linear,
and M1=1.
Fig. 6: Dynamic phase diagram
as a function of FD vs ϕ.
I: jammed phase; II: phase separated state; III: disordered flow phase;
IV: laning phase.
For ϕ < 0.55 the system
is always in phase IV, while phase III grows in extent with increasing ϕ
for ϕ > 0.55.
Inset:
Instantaneous velocity distributions P(V1)
at FD = 1.5 in phase III (blue curve)
at ϕ = 0.727, where the distribution is broad, and
in phase IV (green curve) at ϕ = 0.545,
where the velocities are sharply peaked at V1 = 1.5.
By conducting a series of simulations we map the evolution of the different phases
as a function of
FD vs ϕ, as shown in
the dynamic phase diagram in Fig. 6.
For ϕ > 0.55,
phases II, III, and IV all occur,
while for ϕ < 0.55 only phase IV is present.
For ϕ > 0.55, the extent of phase III grows
with increasing ϕ,
and we only observe phase I for ϕ > 0.7.
The II-III transition occurs at roughly the same value of FD as
ϕ varies.
The minimum value of ϕ = 0.55 at which
phases II and III first appear may
be related to a contact percolation transition.
In compressional simulations
of 2D monodisperse frictionless disks,
Shen et al. [48] found a contact percolation transition
at ϕp = 0.549 and argued that this transition is connected to the onset of
a non-trivial mechanical response or stress in the system.
We can also characterize the phases by examining the
instantaneous velocity distributions P(V1) and P(V2).
In phases I, II, and IV, P(V1) and P(V2)
are delta function distributed at the driving force FD or −FD, respectively.
In contrast, in phase III
the velocity distributions are broad but bounded
with a peak
falling well below FD.
In the inset of Fig. 6 we plot P(V1) at FD = 1.5 for
phase III at ϕ = 0.727 and phase IV at ϕ = 0.545.
In phase III,
P(V1) peaks
at v = 0.625 and has a full width at half maximum of 0.25.
In phase IV, P(V1) is sharply peaked
at V1 = 1.5, indicating that all of the species 1 disks are moving at the
drive velocity.
We note that for ϕ > 0.91, the system should form a jammed crystalline solid.
In this work we remain below the jamming limit so that there is always
some room for the disks to move and rearrange.
Fig. 7: 〈V1〉 vs FD for
ϕ = 0.727 in samples with finite thermal fluctuations of magnitude
FT = 0.0, 2.0, 4.0, 6.0, and 8.0, from top to bottom.
As temperature increases,
the III-IV transition shifts to higher FD
and phase II disappears.
Thermal fluctuations are relevant
in many real soft matter systems,
so to test the robustness of the phases we observe against such fluctuations,
we conduct a series of simulations in which
we add a Langevin
noise term FiT to the equation of motion,
where 〈FiT〉 = 0 and
〈FTi(t)FTj(t′)〉 = 2 kBTδijδ(t − t′).
In Fig. 7 we plot
〈V1〉 versus FD
at ϕ = 0.727
in samples with FT = 0.0, 2.0, 4.0, 6.0, and 8.0.
The four phases described above are present for FT=0,
while
for FT = 2.0, phases I and II vanish and
are replaced by phase III, which still has a sharp boundary at the transition
to phase IV.
For increasing FT, the III-IV transition remains sharp and
shifts to higher values of FD, while
〈V1〉 for
a given FD generally decreases.
Fig. 8: (a) 〈V1〉 vs FT for the
finite temperature system in Fig. 7
at FD = 5.0
showing a IV-III transition near FT = 5.0.
(b) The same at FD = 0.75
showing a II-III transition near FT = 1.5.
In Fig. 8(a) we plot 〈V1〉
versus FT for the system in Fig. 7 at a fixed FD = 5.0.
The zero temperature phase IV flow persists up to
FT = 5.0, above which we find disordered phase III flow accompanied
by a drop in velocity.
In Fig. 8(b),
the same system at
FD = 0.75 is in phase II up to
FT = 1.5,
above which there is a drop in velocity as the system enters phase III.
Phase IV is more robust against increasing temperature
since the disks are moving fast enough in the direction of drive
that the disk-disk collisions responsible for maintaining the lane structure
occur too rapidly to permit individual disks to diffuse transverse to the
direction of drive from one lane to another.
In contrast, in the phase II flow that occurs at lower drives, disk-disk collisions
are more infrequent so an individual disk can more readily diffuse across the border
separating the two disk species, destroying the lane structure and producing
disordered phase III flow.
We find that all four dynamic phases remain accessible for low but finite thermal
fluctuations, and that the multiple lanes of phase IV remain robust at higher
temperatures.
We have performed limited simulations with larger systems. The transient
times required for phases II and IV to form increase with system size, but the
disk densities at which the transitions between different phases occur remain
robust against changes in system size, suggesting
that the transitions
are strongly connected to the global packing density.
Fig. 9:
(a) 〈V1〉 vs FD for a system with
ϕ = 0.727. Solid line: forward sweep of FD.
Dashed line: Reverse sweep of FD starting from FD=6 when the system
is in phase IV, showing that phase IV flow persists all the way down to
FD=0.
(b) The transient time τ in phase IV
vs FD − FC where FC=3.95 is the drive at which
the III-IV transition occurs.
The dashed line is a power law fit with exponent ν = 1.35.
Several of the phase transitions we observe have similarities to
the irreversible-reversible transition observed
in periodically sheared disk suspensions, where the disks
transition from an irreversible fluctuating state in which disk-disk collisions occur
to a reversible state where collisions are lost [43, 49].
In our system, collisions disappear in phases II and IV, which behave like reversible states,
while phase III corresponds to an irreversible state.
If the reversible state is absorbing,
then once the system has entered the reversible state
it should remain trapped regardless of
any changes in the value of FD.
To test this, we initialize a zero temperature ϕ = 0.727 system in phase IV flow
at FD = 6.0
and gradually reduce FD to zero in a series of steps.
We find that the system remains in phase IV all the way down to
FD = 0, as indicated in Fig. 9(a)
by the dashed line.
If we start the system in phase III at FD = 2.0 and reduce the drive,
the system jumps into phase II near FD = 1.0 and remains
in phase II down to FD = 0.
Under finite temperature such hysteresis will depend strongly
on the rate at which we change FD,
which will be the subject of a future work.
In the periodically sheared colloidal system
of Ref. [43], the system always starts
in a fluctuating state and over time organizes into either a steady fluctuating state or
a nonfluctuating absorbing state.
The transient time τ required to reach either state diverges
as a power law at the transition point.
Our system always starts in phase III and
either remains in phase III or organizes into phase II or IV
depending on the value of FD.
Focusing on the III-IV transition at FC=3.95 in a system with
ϕ = 0.727,
we conduct
a series of simulations with FD > FC
and measure the transient times τ
required for phase IV flow to develop from the initial phase III state
as FD approaches FC.
In Fig. 9(b) we plot
τ averaged over different initial state realizations versus FD − FC.
The dashed line is a power law fit with ν = 1.35 ±0.15.
A similar transient time exponent
appears in the irreversible-reversible transition and depinning systems,
and our value of ν agrees with the exponent expected for an
absorbing phase transition [42, 43, 44, 45, 46, 47, 49].
In the colloidal shearing system, transient times could be measured on both
sides of the reversible-irreversible transition;
however, we are unable to identify a clear relaxation time
within phase III for FD < FC.
The idea that the disks have reached
an absorbing state
is only applicable for T = 0 or very low temperatures,
since once thermal fluctuations are introduced, it may become
possible for the system to escape from a state that was absorbing
at zero temperature.
Fig. 10: (a) 〈V1〉 vs FD for a sample with ϕ = 0.848
in which N1=0.2Nd and N2=0.8Nd.
(b) The corresponding mobility M1 vs FD.
Here M1=1.0 in phases II and IV, but
there is a portion of phase III for which the mobility is nearly zero.
Phase I is no longer a jammed phase with
〈V1〉 = 0. Instead, a rigid cluster
forms that drifts in the −x direction,
producing a negative mobility.
We have also considered different ratios of N1 to N2
and find that the same general phases appear.
In Fig. 10(a) we plot 〈V1〉
versus FD for a system with ϕ = 0.848, N1=0.2Nd, and N2=0.8Nd,
while Fig. 10(b) shows the corresponding mobility
M1 versus FD.
Here the same four phases arise and the overall shape
of the curves is similar to that of the N1=N2=0.5Nd system
shown in Fig. 1; however, in phase III the
average mobility drops nearly to zero since
the additional collisions suppress the flow of the disks in
the +x direction.
In phases II and IV, M1=1, indicating that the system
can still organize into a collisionless
state where the disks undergo free flow motion.
A notable difference is that for phase I in the N1=0.2Nd sample,
the mobility M1 is negative.
The jammed phase I for the N1=0.5Nd sample has 〈V1〉 = 0,
but in the N1=0.2Nd sample,
the jammed state consists of
a rigid solid that translates in the
−x direction since N2 > N1.
In general, for any ratio other than N1/N2=1,
the jammed phase I has a net drift in the
direction of the majority species.
As N1/N2 is decreased further,
in phases II and IV we always find M1=1,
while for phases I and III the mobility decreases or becomes more negative.
We can also change the ratio of the relative driving force on the two different species.
We consider a system with N1=N2=0.5Nd at ϕ = 0.848 and vary the
value of C controlling the amplitude of the driving force for species 1, while
keeping the drive on species 2 fixed at FDi=−Fd∧x.
Here C is chosen in the range
−1.0 ≤ C ≤ +1.0.
The exactly oppositely driven disks in Fig. 1 corresponds to the case
C=+1.0.
For C = 0, half of the disks do not couple to the external drive while the other half are
driven in the negative x direction,
and for −1.0 ≤ C < 0,
both species are driven in the −x direction
with different forces.
At C = −1.0, all the particles are driven in the −x direction with the
same force.
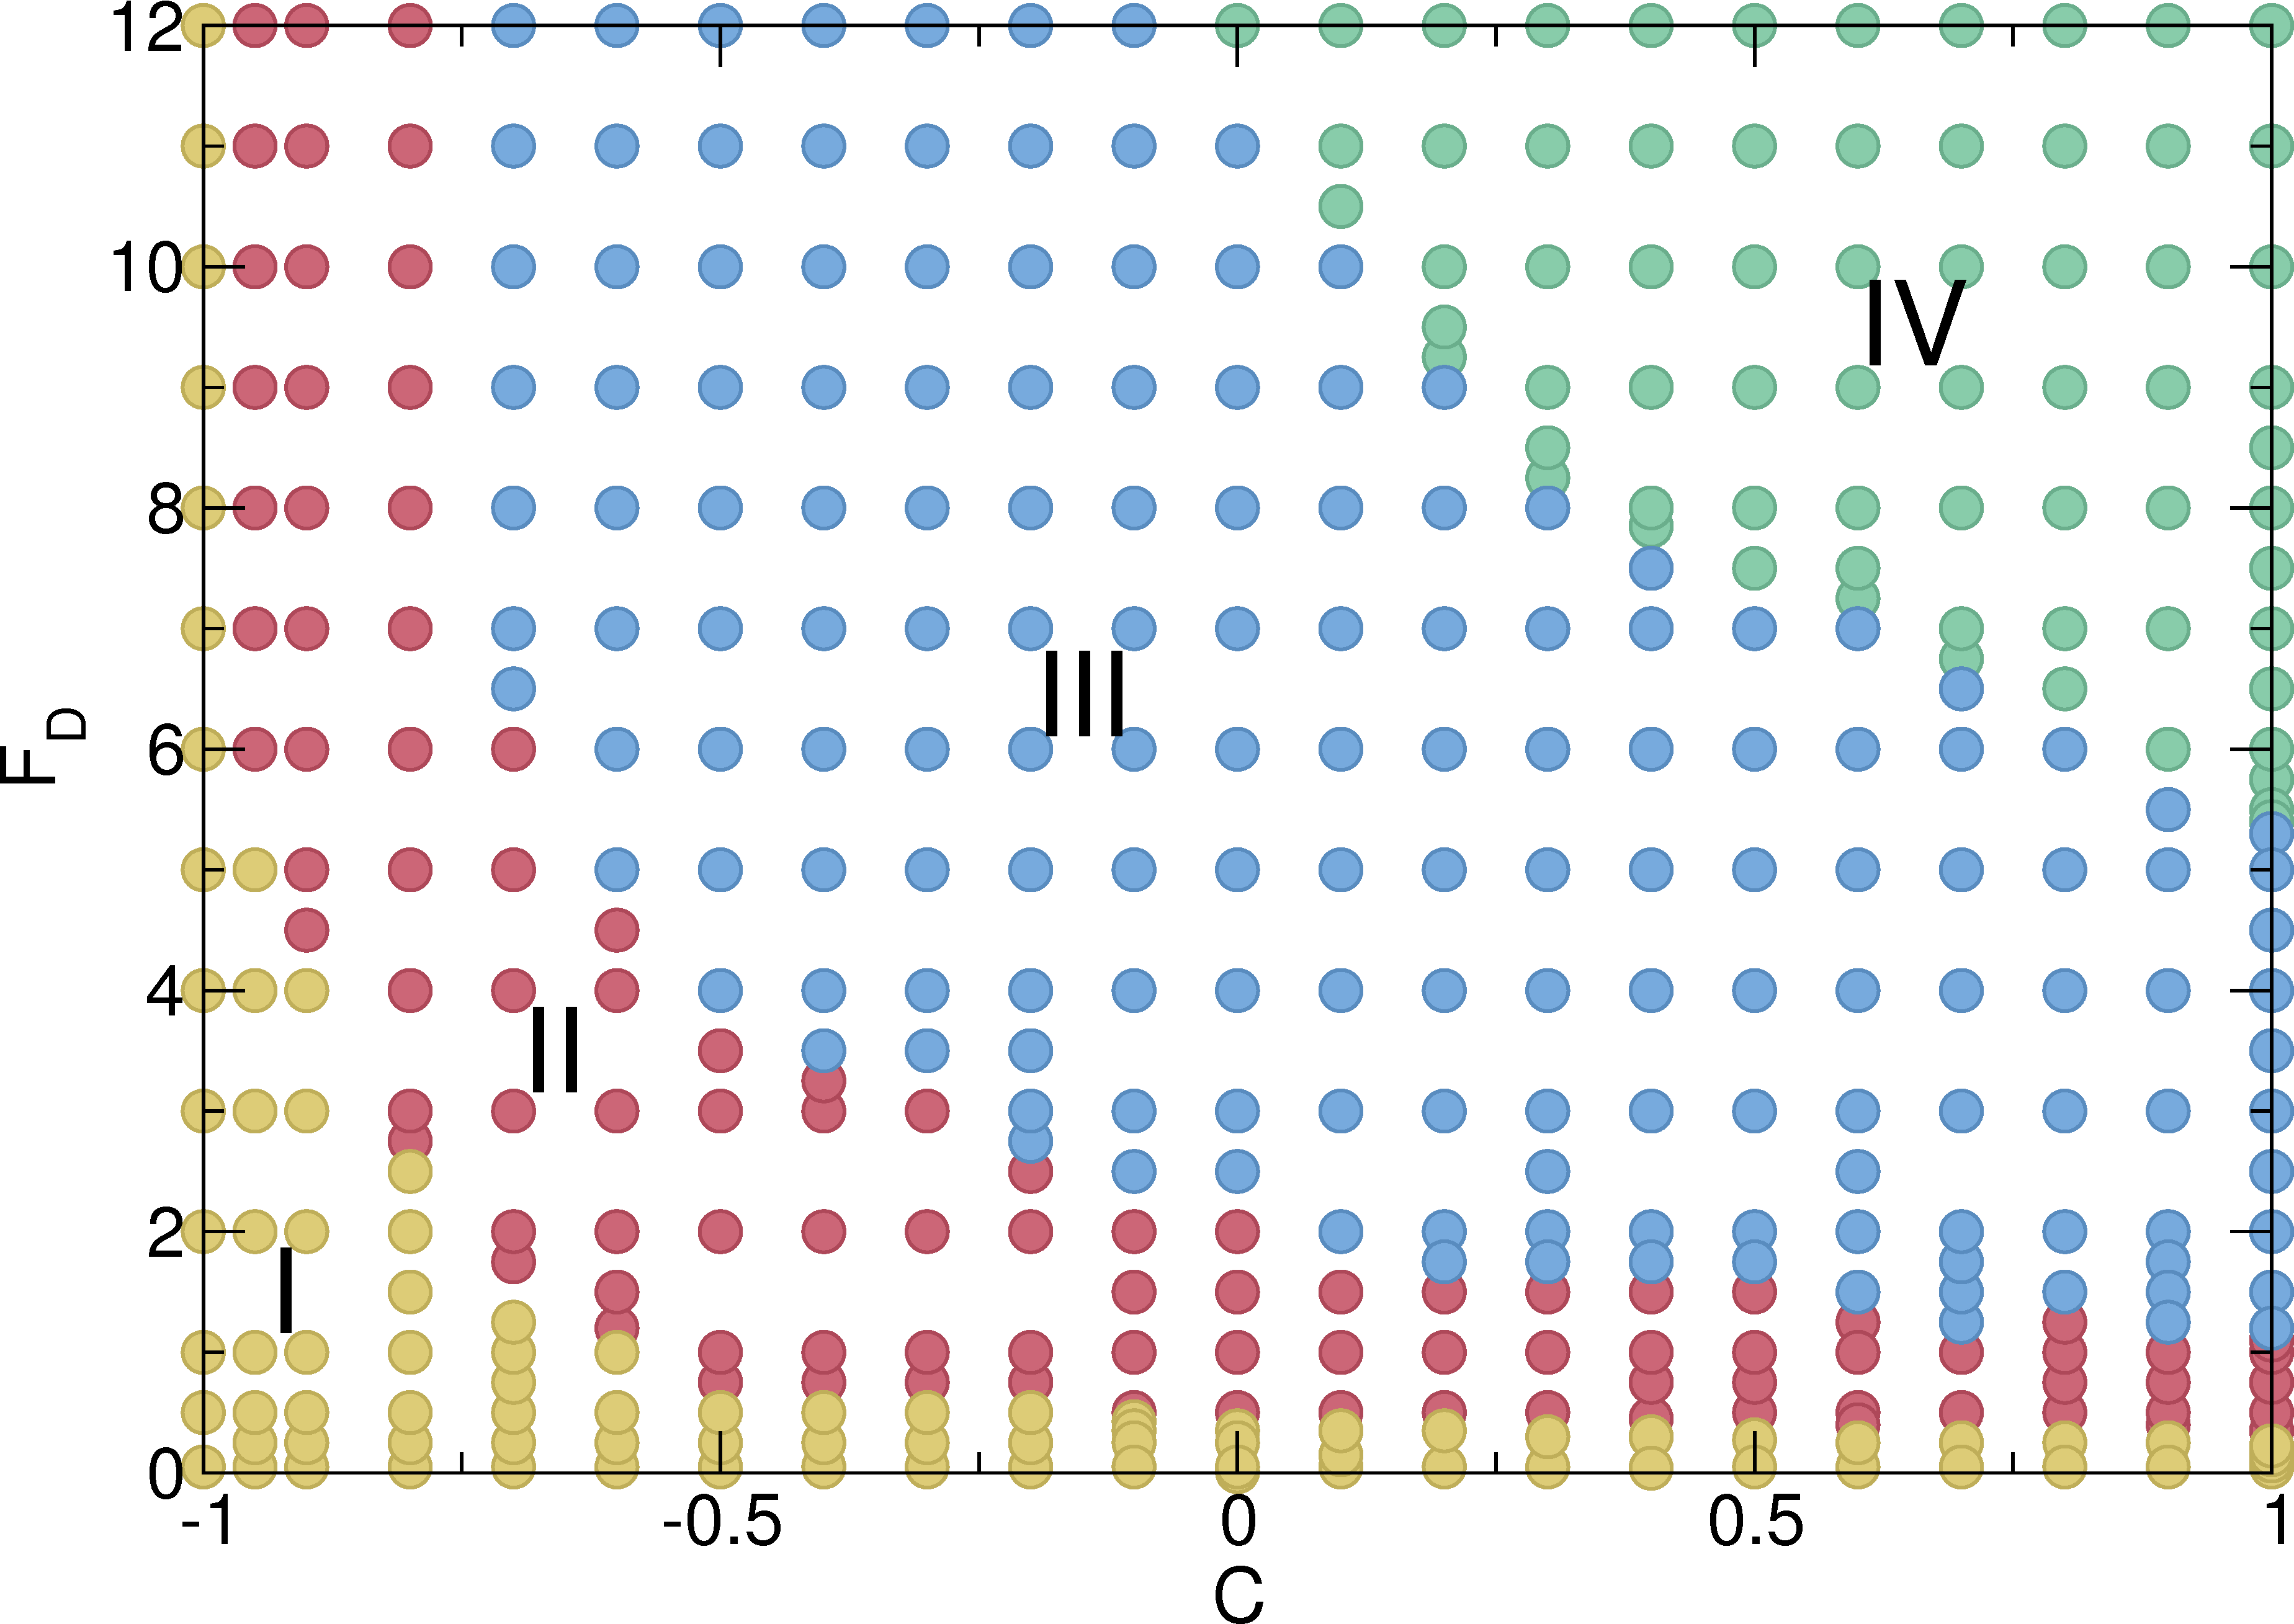
In Fig. 11 we show a dynamic phase diagram
as a function of FD versus C.
All of the phase transitions shift to higher values of FD as C decreases.
It is interesting to note that for C=0, where only species 2 is driven, all four
dynamic phases still occur.
Fig. 11: Dynamic phase diagram
as a function of FD vs C,
where C is the coefficient controlling the amplitude of the driving force
for species 1 disks, in a sample with N1=N2=0.5Nd and ϕ = 0.848.
The value C = 1.0 corresponds to the
case shown in Fig. 1 for exactly oppositely driven particles.
Yellow circles: jammed phase I; red circles: phase separated state II;
blue circles: disordered flow phase III; and green circles: laning phase IV.
At C = 0 where only species 2 couples to the drive, all four phases can still occur.
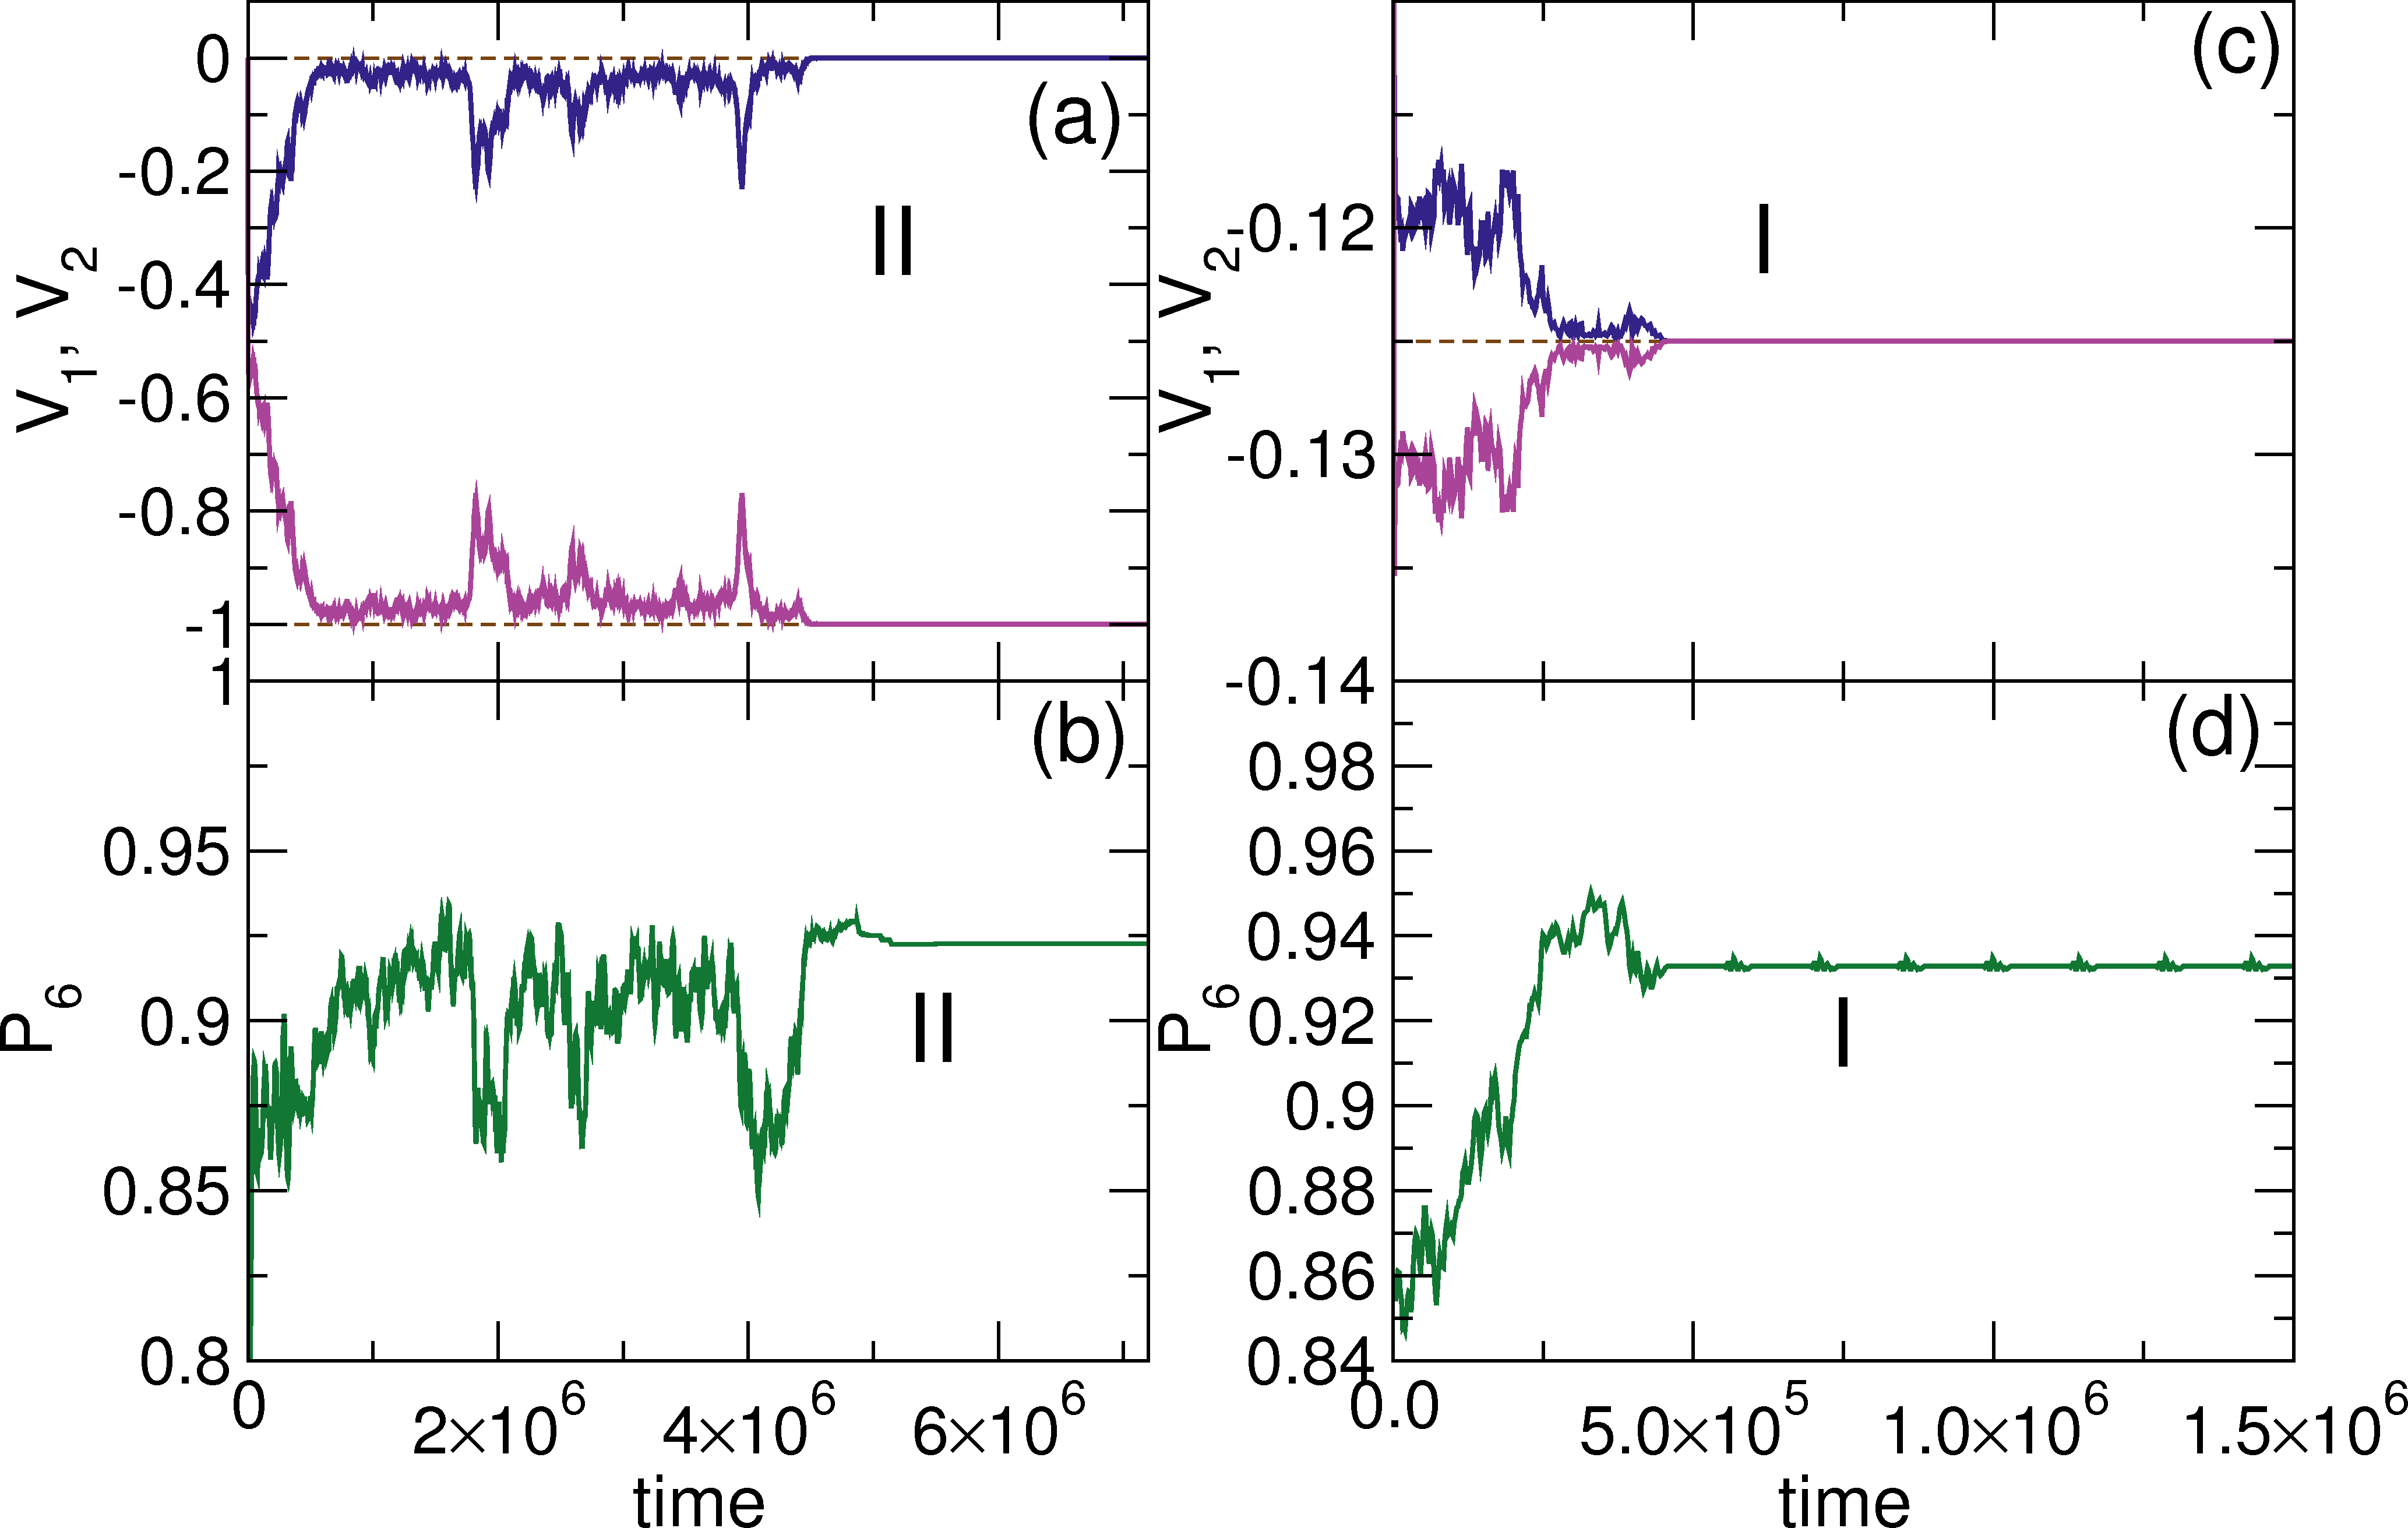
Fig. 12: A sample from Fig. 11 with C=0 and FD=1.0.
(a) The instantaneous velocity per disk V1 vs time in simulation time steps
(upper blue curve) for the non-driven disks and
the corresponding
V2 (lower pink curve) vs time for the disks driven in the −x direction.
Here the system organizes into
phase II flow with V1 = 0 and V2 = −FD=−1.0.
(b) P6 vs time for all the disks in the same system
showing the transition into phase II.
(c) V1 and V2 vs time for the same system at FD = 0.25 and C = 0.
The disks organize into phase I where both
species become locked together and move at V1=V2 = −0.125 = FD/2.
(d) The corresponding P6 vs time curve shows that
the system organizes into a mostly triangular state at
the transition to phase I.
In Fig. 12(a) we plot
the instantaneous disk velocities
V1 and V2 versus time for C = 0 and FD=1.0.
Here, species 1 is not driven.
The system organizes into phase II as indicated by the transition to
V1=0 and V2=−1.0.
The velocities rapidly approach the phase II values at short times,
but significant velocity fluctuations persist and appear as
jumps in both V1 and V2 in the transient fluctuating state.
In Fig. 12(b), the corresponding P6 versus FD
for all the disks shows that the large
fluctuations in V1,2 correlate with drops in P6,
and that when the system fully settles into
phase II flow, P6 saturates to P6=0.925, indicating mostly triangular ordering.
In Fig. 13(a) we show the disk configurations
and trajectories in the phase II flow for the C=0 system in Fig. 12(a).
The disks phase separate into
an immobile triangular packing surrounded by a moving triangular lattice.
At high drives for C=0, a laning phase IV appears where
half of the lanes are immobile and the other half
are moving.
Fig. 13: The disk configurations for the system in Fig. 12
with C=0. The
blue disks (species 1) are not driven and the red disks (species 2) are driven
in the −x direction.
(a) The phase separated state II for the system in
Fig. 12(a,b) at FD = 1.0.
The black lines are the disk trajectories
indicating that the system has phase separated into moving and
non-moving spatial regions.
(b) The jammed state I at FD = 0.25 from Fig. 12(c,d)
where the entire system is moving in the negative x-direction.
The jammed phase I at C=0
consists of a moving solid drifting in the negative x-direction,
as illustrated
in Fig. 12(c) where we plot
V1 and V2 versus time at FD = 0.25.
Here the velocities of both disk species
converge
to V1=V2 = −0.125 = −FD/2
in phase I since the non-driven disks reduce the velocity
of the driven disks to half of its free-flow value.
Figure 12(d) shows the corresponding
P6 versus time, where at the transition into phase I,
P6=0.93 indicating the formation of a triangular drifting solid.
In Fig. 13(b) we show the disk configurations in phase I
for the system in Fig. 12(c),
where the driven disks
drag the non-driven disks.
Phases I and II persist
for −1.0 < C < 0.0 in the range of FD that we have investigated,
and at C = −1 all the disks move in unison.
The fact that these phases can occur
over a range of relative drives indicates that
such phases may be general to
other systems in which the particles are not exactly oppositely driven
but have differences in their relative driving.
These differences could arise for particles
with different drag coefficients, different coupling to a substrate,
different amounts of charge,
different shapes, and so forth.
Such effects could also be realized for
active matter systems
where one species couples to an external
drift force or where only one species is active.
There are already examples of mixtures
of active and non-active particles that undergo
phase separation [50].
Another interesting feature of this system at C = 0 is that certain
regimes such as phase II flow exhibit a time dependent resistance.
When the drive is initially applied, the sample enters a high resistance
state in which many collisions occur,
but over time the disks approach a low resistance state
as the number of collisions are reduced.
This suggests that if finite temperature were included, then
when the drive is shut off there would be a finite time during which
the memory of the low-resistance organized state is
preserved.
Such a system would have features similar to those of a memristor [51].
We have numerically investigated a two-dimensional disk system in which two
disk species are driven in opposite directions.
We characterize the system by measuring the
average velocity of one disk species as a function of drive
to create a velocity-force curve analogous to what is observed in
driven systems with quenched disorder.
The density ϕ is the
total area coverage of the disks, and for ϕ > 0.55 we
identify four dynamical phases:
a crystalline jammed phase I,
a fully phase separated state II
where the particles are not in contact but exhibit six-fold ordering, a
strongly fluctuating liquid phase III where continuous collisions are
occurring, and a laning phase IV or smectic
state where collisions are absent.
The transitions between these
different phases are associated with
jumps or dips in the velocity-force curves and the differential mobility
along with global changes in the disk configurations.
At the transition into phase III we find
negative differential mobility.
The transitions
also correlate with jumps in the amount of six-fold ordering.
For ϕ < 0.55, the system always organizes
into the laning phase IV and the velocity-force curves are linear.
We vary the relative driving forces on the two species, and consider the case
where one species is driven while the other species
does not couple to the drive
as well as the case where both species are driven in the same
direction with different relative forces.
We find that the same four driven phases found for the oppositely driven case
still occur.
By measuring the instantaneous disk
velocities,
we find that in phases II and IV, the disks organize into a freely flowing state
in which disk-disk collisions no longer occur.
The phases are robust against the addition of finite temperature, but
phase II disappears at much lower temperatures than phase IV.
We discuss how the transitions into phases II and IV may be related to the
irreversible-reversible transitions recently observed
for periodically sheared colloidal or granular systems, which
organize to an absorbing state in which collisions between particles are lost.
If we start the system at a drive that
generates phase II or phase IV flow, which act as reversible
or absorbing states,
it will remain in that phase as the drive is decreased all the way to zero.
We also find that near the III-IV transition,
the transient times required to reach a steady state
grow as a power law with exponent ν = 1.35,
in agreement with the predictions for absorbing phase transitions.
Possible
physical realizations of our system include
noncharged flowing colloids where one species has
a larger damping constant than the other,
sedimenting colloids with different sedimentation speeds,
mixtures of magnetic and nonmagnetic colloids, and certain active matter systems.
Conflicts of interest
There are no conflicts to declare.
Acknowledgements
We thank N. Bain for useful discussions.
This work was carried out under the auspices of the
NNSA of the
U.S. DoE
at
LANL
under Contract No.
DE-AC52-06NA25396.
K. Sütterlin, A. Wysocki, A. Ivlev, C. Räth, H. Thomas, M. Rubin-Zuzic,
W. Goedheer, V. Fortov, A. Lipaev, V. Molotkov, O. Petrov, G. Morfill, and
H. Löwen,
Phys. Rev. Lett., 2009, 102, 085003.