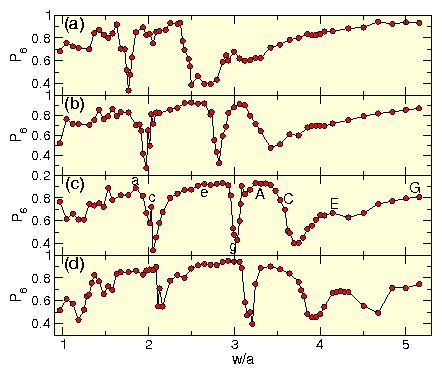
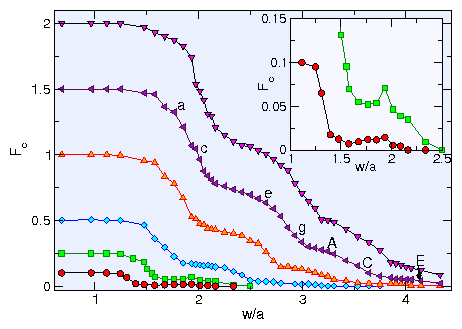
 Figure 4: The depinning force Fc vs w/a for
Fp = 0.1 (circles),
0.25 (squares), 0.5 (diamonds), 1.0 (up triangles), 1.5 (left triangles),
and 2.0 (down triangles)
showing that for Fp > 0.25 the buckling transitions
correspond to step features in Fc.
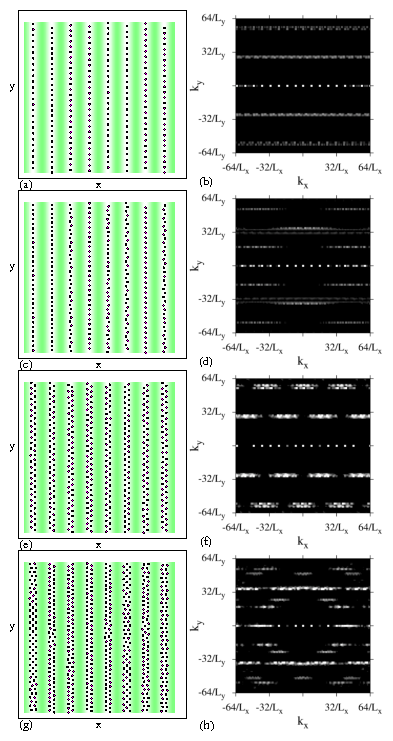
The labels a, c, e, g indicate the values of w/a at which the
images in Fig. 1 were obtained, while the labels
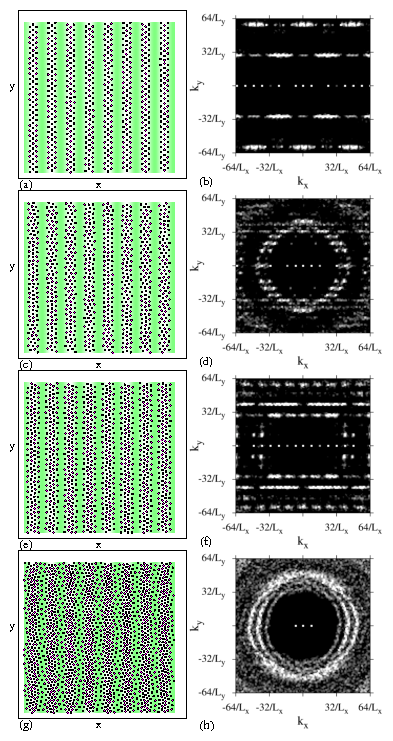
A, C, and E indicate the values of w/a at which the images in
Fig. 2 were obtained.
Inset: a highlight of the main panel illustrates that
for weaker pinning, peaks in Fc occur, as shown for
Fp=0.1 (circles) and 0.25 (squares).
The peak is associated with the
formation of an ordered zig-zag lattice similar to that
shown in Fig. 1(e).
|
