Physical Review B 54, 16108 (1996)

Spatiotemporal dynamics and plastic flow of vortices in superconductors with periodic arrays of pinning sites

C. Reichhardt, J. Groth, C. J. Olson, Stuart Field, and Franco Nori
Department of Physics, The University of Michigan, Ann Arbor, Michigan 48109-1120

(Received 30 May 1996)

We present simulations of flux-gradient-driven superconducting rigid vortices interacting with square and triangular arrays of columnar pinning sites in an increasing external magnetic field. These simulations allow us to quantitatively relate spatio-temporal microscopic information of the vortex lattice with typically measured macroscopic quantities, such as the magnetization M(H). The flux lattice does not become completely commensurate with the pinning sites throughout the sample at the magnetization matching peaks, but forms a commensurate lattice in a region close to the edge of the sample. Matching fields related to unstable vortex configurations do not produce peaks in M(H). We observe a variety of evolving complex flux profiles, including flat terraces or plateaus separated by winding current-carrying strings and, near the peaks in M(H), plateaus only in certain regions, which move through the sample as the field increases.

I. INTRODUCTION
II. SIMULATION
III. RELATION BETWEEN MACROSCOPIC AVERAGES AND THE MICROSCOPIC TOPOLOGICAL ORDER OF INDIVIDUAL FLUX LINES
IV. VORTEX DYNAMICS AND PLASTIC FLOW CLOSE TO A COMMENSURATE FIELD
V. COMPLEX PATTERNS OF MAGNETIC FLUX: ISLANDS AND STRIPED DOMAINS
VI. EFFECTS OF THE MICROSCOPIC PINNING PARAMETERS AND CONTROLLED DISORDER ON THE MAGNETIZATION
VII. SUMMARY AND DISCUSSION
References

I.  INTRODUCTION

Flux pinning in type II superconductors is of both technological and scientific interest. While most experiments focus on the effects of random pinning distributions, some investigations have been carried out on periodic arrays of pinning sites (PAPS) [1]. These find striking peaks in the magnetization [2,3,4,5] and critical current Jc . These peaks are believed to arise from the greatly enhanced pinning that occurs when parts of the vortex lattice (VL) become commensurate with (i.e., match) the underlying PAPS. Under such conditions, high-stability vortex configurations are produced which persist under an increasing current or external field. Other important vortex matching effects have also recently been observed in a variety of different superconducting systems [6,7,8,9,10,11,12], including Josephson junctions[8], superconducting networks[9,10], and the remarkable matching of the VL to the crystal structure of YBa2Cu3O7 due to intrinsic pinning[11].
Commensurability effects are also important in superconducting systems with random arrays of columnar pinning sites, where a Mott insulator phase is predicted [13] at the matching field, where the number of vortices equals the number of pinning sites. In this phase the vortex lattice locks into the pinning array preventing further vortices from entering the sample and creating a Meissner-like effect.
Non-superconducting systems also exhibit magnetic-field-tuned matching effects, notably in relation to electron motion in periodic structures where unusual behaviors arise due to the incommensurability of the magnetic length with the lattice spacing[14]. A recent example of such a system is provided by the anomalous Hall plateaus of "electron pinball"[15] orbits scattering from a regular array of antidots. Commensurate effects also play central roles in many other areas of physics, including plasmas, nonlinear dynamics[16], the growth of crystal surfaces, domain walls in incommensurate solids, quasicrystals, Wigner crystals, as well as spin and charge density waves[17].
To investigate the microscopic vortex dynamics in systems with a PAPS we have performed extensive molecular dynamics simulations using a wide variety of relevant parameters which are difficult to continuously tune experimentally, such as disorder in the pinning lattice geometry, sample size, vortex density nv, as well as pinning density np, radius ξp, and maximum pinning force (or strength) fp. We find a rich variety of behavior in which all these parameters play an important role.
Recent experiments and theories (see, e.g., Refs [1-8]) involving periodic and commensurate pinning effects in superconductors have raised questions that can be systematically explored by our computer simulations. One such question addressed in this work involves the topological ordering and dynamics of the vortices at commensurate and incommensurate fields and how this microscopic order relates to bulk macroscopic experimentally measurable quantities, such as the magnetization M(H). At the matching fields, the vortex lattice is expected to be topologically ordered; however, most experiments have not been able to directly image the vortex lattice to determine the precise vortex arrangements for varying external magnetic fields. In particular, at the matching field most experiments cannot directly discern whether several vortices sit at each pinning site or the vortices sit at the interstitials (regions between pinning sites). Interstitially pinned vortices are those which are trapped by other vortices, and not by defects. Interstitial pinning refers to "magnetic caging", in contrast to the standard, and stronger, "core pinning" by defects. Our direct knowledge of the vortex positions allows us to determine the degree of topological disorder in the vortex lattice at the incommensurate fields and compare it with the ordered phases at the matching fields.
Another important question that can be directly studied using computer simulations is the vortex lattice dynamics near and above the first matching field. Recent theories [18,19] and experiments [20,21,22,23] suggest that beyond the first matching field, weakly pinned interstitial vortices should be more mobile than vortices at the defect sites; thus, quantities such as critical currents and magnetization should drop considerably. Since these interstitial vortices should be flowing around the strongly pinned immobile vortices, plastic flow should occur in these systems. Plastic flow of vortices in superconductors has recently attracted considerable attention [24,25,26] and superconductors with a PAPS are an ideal system in which to study it. Our simulations allow us to explicitly show, in a quantitative manner, how dominant interstitial vortex motion is beyond the matching Bϕ. Direct imaging of the vortex lattice can also determine exactly how different periodicities in the underlying pinning geometry affect the ordering of the vortex lattice.
It is important to emphasize that our simulations take into account the critical state, [27,28], in which a gradient in the flux profile arises as flux penetrates a superconductor. Recently, Cooley and Grishin [12] presented a 1D static model of the Bean critical state with a PAPS, in which a terraced flux profile arises. In this work we will focus on a 2D dynamical model of flux-gradient-driven vortices; this 2D dynamical descripton produces a far more complex and richer behavior than that predicted by 1D static models [12].
Section II describes the numerical algorithm used here and compares our system to other superconducting structures with periodic pinning. In section III we present calculated values for the magnetization M(H(t)) for superconducting samples with either a square or a triangular array of pinning sites. This computed macroscopic average, M(H), is then related to microscopic quantities which describe the evolving topological order of the vortex lattice (e.g., the density of n-coordinated defects Pn(H) in the flux lattice). Section IV shows specific vortex configurations and describes their dynamics close to the first commensurate peak in M(H). Section V presents vortex lattices at high matching field values and compares them with the low matching field configurations. Section VI shows the effects on the magnetization of varying the pinning strength, density, and disorder in the pinning lattice. Section VII contains a summary of our results and a discussion of how they compare to recent theories and experiments.

II.  SIMULATION

We consider a 2D transverse slice (in the x-y plane) of an infinite 3D slab at zero temperature containing rigid vortices and columnar defects, all parallel to both the sample edge and the applied field H=Hz. Pinning is placed in the central 75% of the system (which is our actual sample) with the outer 25% free of pinning sites. We simulate the ramping of an external field as described in [29,30] by the slow addition of vortices to the unpinned region. These vortices attain a uniform density n allowing us to define the external field H = nΦ0, where Φ0 = hc/2e. As the external density of the flux lines builds, they will, through their own repulsion, force their way into the sample where they interact with the lattice of columnar defects. We correctly model the vortex-vortex force by a modified Bessel function K1(r/λ), where λ is the penetration depth. For the vortex-pin interactions, we assume the pinning potential well to be parabolic. For the simulations presented here, the pinning range (i.e., the radius of the parabolic well) is ξp = 0.25λ, far less than our vortex-vortex interaction cutoff of 6λ. The overdamped equation of motion is
fi = fivv + fivp = ηvi  ,
where the total force fi on vortex i (due to the other vortices fivv, and pinning sites fivp ) is given by
fi
=
  Nv

j=1 
 f0  K1
|rirj|

λ

 
^
r
 

ij 
+
Np

k = 1 
fp

ξp
 |rirkp|  Θ
ξp − | rirkp |

λ

 
^
r
 

ik 
 .
(1)
Here Θ is the Heaviside step function, ri (vi) is the location (velocity) of the ith vortex, rkp is the location of the kth pinning site, rij = (rirj )/|rirj| , rik = (rirkp)/|rirpk| , fp is the maximum pinning force (or strength), and we take η = 1. Unlike previous simulations which have investigated systems with random pinning arrays [29,30,31,32], here we place the pinning sites in square as well as triangular arrays.
We measure all forces in units of f0 = Φ02/8π2λ3, fields in units of Φ02, and lengths in units of λ. Our simulation correctly models the driving force as a result of local interactions; no artificial "uniform" external force is applied to the flux lines. As the vortices enter the sample (i.e., the pinned region) we can compute experimentally measurable quantities, including the density of flux lines B(x,y,H(t)), and the local Jc(x,y,H(t)) and global currents Jc(H(t)). Here, we will mainly focus on the most commonly measured macroscopic quantity, the global magnetization
M = (4πV)−1
(HB)   dV  ,
and relate it to the spatio-temporal dynamics of the vortices.
Our simulation procedure and the samples used here have several differences that distinguish them from recent experiments. First, our samples have a slab geometry, unlike the films used in [3,4,5], where demagnetization effects are important. Second, the size and strength of our pinning sites are much smaller than those considered in [3,4,5,6]. Thus at higher matching fields, interstitial pinning will be important rather than multiple vortices per pinning site, as in the experiments [3,4,5,6]. Moreover, the relatively small radius of our pinning sites, among other reasons, makes our system very different from wire networks, where interstitial vortices cannot exist. Finally, and most importantly, our simulations are dynamical. The vortices are driven by the flux gradient as the external magnetic field is increased, and we can observe how the vortices are moving at the various external field values. This is considerably different from the static experimental results where the vortex motion has not been imaged.

III.   RELATION BETWEEN MACROSCOPIC AVERAGES AND THE MICROSCOPIC TOPOLOGICAL ORDER OF INDIVIDUAL FLUX LINES

Figure1.png
Figure 1: Initial magnetization M(H(t)) for two samples with a pinned region of size 27λ×36 λ for a square (a) and triangular (f) periodic array of pinnings sites. These are embedded in a 36λ×36λ system in which the external field is brought from zero to a final value of H = 2.6 Φ02, corresponding to a total of Nv=3400 flux lines (2550 vortices in the pinned region) and nv ≈ 2.6 /λ2. All panels on the left (right) side refer to the square (triangular) periodic array of pinning sites. The pin densities are np = 0.86/λ2 (Np=834) for the square PAPS and np = 0.81/λ2 (Np=784) for the triangular PAPS. Np is the total number of pinning sites. For both of these samples fp = 0.3f0 , ξp = 0.25λ. For the square array, peaks in M(H) near the 1/2, 1, and 2 MFs can be observed in (a). For the triangular array, peaks in M(H) near the 1 and 3 MFs can be observed in (f). The fraction of n-fold coordinated vortices Pn(H) exhibit clear peaks in P4, and dips in the other Pn(H)'s, near the MFs for the square case. The fraction of n-fold coordinated vortices Pn(H) exhibit clear peaks in P6, and dips in the other Pn(H)s, near the MFs for the triangular case. For increasing field in both PAPS, P6 becomes close to one when H > 2.5  Φ02; meanwhile all the other Pn's decrease.
Color figure
Previous simulations of flux-gradient-driven vortices conducted in 1D [29] and 2D [30] with dense randomly placed pins produced a modified Bean-Kim model in which the flux profile had no terraces and the magnetization curves were very similar to those observed by standard experiments. However, with a PAPS, a very different behavior arises. Figure 1(a) presents the first quarter of the initial magnetization curve for a square PAPS. Although our simulations produce complete hysteresis loops [30,31], the ramp-up phase contains the relevant information. As the external field H is increased from zero, the flux fronts move towards the center of the sample and M(H) rises; when the two flux fronts meet at the center of the sample, M(H) peaks. This initial peak is thus unrelated to the PAPS, and is seen even in random arrays[30]. However, as the field is increased further, we find three cusps near the matching fields (MFs) given by nv/np ≈ 1/2, 1, and 2, with the peak at nv/np ≈ 3 missing since the VL cannot form a stable configuration commensurate with the underlying square geometry for nv/np ≈ 3 . The VL can form a stable configuration commensurate with the underlying square geometry for nv/np ≈ 2 . The peaks occur slightly after the exact matching due to the flux gradient in the sample. For the range of fields studied here ( nv/np <~4 ), we observe that the radius of the pinning wells ξp is too small to permit multiple vortices per well; thus, the higher MFs form lattices with vortices pinned at interstitial sites. In flux creep experiments with a square PAPS[3] it was suggested that multiple vortices were trapped in a single large well at the nv/np ≈ 3 MF. Indeed, our results indicate that for a square PAPS any experimentally observed [3] MFs near nv/np ≈ 3 must be due to multiple vortices per well.
In order to correlate the behavior of this macroscopic quantity M(H) with the actual microscopic dynamics of individual vortices, it is useful to monitor the field-dependent fraction (or probability) Pn(H) of vortices with coordination number n. This quantity is obtained from the Voronoi (or generalized Wigner-Seitz) construction for the individual vortices and is shown in Fig. 1(b-e, g-j). The lengths of each side of a given Voronoi cell are compared, and if any side is less than one-tenth of the lengths of the other sides, it is ignored. This permits us to examine square lattices, which can be difficult to deal with using standard Voronoi algorithms. In the absence of any pinning, the flux lines form a perfectly hexagonal lattice (P6(H) = 1); the presence of pinning sites introduces disorder into the flux lattice. The fraction of 4-fold-coordinated vortices P4(H), in Fig. 1(b), quantifies the degree of matching of the vortex lattice with the square pinning array at the commensurate fields nv/np ≈ 1/2, 1, and 2. At these fields where P4 peaks, all the other probabilities show a clear dip. Notice also the increase in P4(H) near the 1/4 and 1/8 rational matching fields; these are not obviously reflected in M(H), due to the usual large peak at HH*. Moreover, rational matching peaks higher than one (e.g., 3/2, 5/2) are not observed, due to the presence of a flux gradient. P6(H) greatly increases between the MFs, since there the vortex-vortex forces dominate over the vortex-pinning interactions. For very weak fields, the low numbers of vortices makes the Voronoi construction ill-defined.
Figure 1(f) shows M(H) for a triangular PAPS. Here the MFs at nv/np ≈ 1 and 3 produce peaks in M(H) . The nv/np ≈ 2 peak is missing for this weak pinning case (although we observe a small peak for strong pinning fp=2.0f0) because this vortex configuration is less stable than the triangular VL at the same nv. Figures 1(g-j) show the corresponding fraction of n-fold coordinated vortices. Here P6(H) increases at the MFs 1 and 3, and also has a smaller increase near 1/2. Notice that P4(H), P5(H), and P7(H) decrease at the MFs 1 and 3. P6(H) tends to increase with field for both square and triangular PAPS. Since here the 5-7 disclinations are paired, P5(H) and P7(H) follow each other closely.
Figure2.png
Figure 2: Snapshots of a small part of the sample showing the actual location of vortices (solid dots) and pinning sites (open circles) at the M(H) peaks nv/np ≈ 1, 2, in (a,b), [nv/np ≈ 1, 3, in (c,d)] for the square [triangular] PAPS indicated in Fig. 1(a) [1(f)]. Note the interstitially pinned vortices in (b) and (d).
Figure 2(a-b) [2(c-d)] presents the actual positions of the vortices and the square [triangular] PAPS for a small part of the sample used in Fig. 1(a) [1(f)] at the nv/np ≈ 1, 2  [1, 3] MFs. Due to the field gradient noticeable here, the VL is only commensurate over this small range. In Fig. 2(a) all the vortices are pinned at the defect sites; these vortices are said to experience "core pinning", instead of "magnetic pinning". The additional vortices that enter the sample when the external field is increased will not be trapped by the already-occupied pinning sites, but will still feel a magnetic "caging" effect due to the repulsion produced by other vortices. These are known as interstitially-pinned, or "magnetically-pinned", vortices. Here, we do not consider "magnetic pinning" due to magnetic impurities in the sample (e.g., iron dots); vortices are pinned either by defects or by other pinned vortices. In Fig. 2(b), half the vortices are interstitially pinned between the vortices located at the pinning sites, forming a square vortex lattice. In Fig. 2(c-d) the same cycle is observed only now there are two interstitially pinned vortices for every vortex trapped at a defect site.
A recent experiment [5] finds that the particular type of pinning geometry (i.e., square, triangular) produces little difference in the matching fields observed (i.e., peaks in M(H) appear at all integer matching fields). This is in strong contrast to our results where the particular kind of pinning geometry clearly affects where matching peaks occur. Our results can be understood in terms of interstitial vortices being constrained to form a lattice with the same symmetry as the underlying pinning lattice. For a triangular array of weak pinning sites, a triangular vortex lattice with two vortices per pin, in which one vortex is in a pinning site and the other is interstitially confined, is unstable as can be shown by a simple linear stability analysis. Thus at the second matching fields, we do not observe a peak in either the 6-fold coordination number or the magnetization. Similarly, at the third matching field of a square array of pinning sites, a square vortex lattice is unstable and a peak in the both the 4-fold coordination number and the magnetization is not observed there. For the large and strong pinning sites used in certain experiments, e.g., [5], however, the onset of multiple vortices per pinning site leads to reduced sensitivity to the underlying geometry of the pinning lattice.

IV.  VORTEX DYNAMICS AND PLASTIC FLOW CLOSE TO A COMMENSURATE FIELD

Figure3.png
Figure 3: (a-d) Voronoi (Wigner-Seitz) cell construction indicating the location of the vortices as they move through the first matching peak nv/np ≈ 1, for the square PAPS system described in Fig. 1(a). Larger (smaller) cells correspond to low (high) densities of flux lines and are indicated in dark (light) shading. The sample has periodic boundary conditions on the left and right sides, and the vortices penetrate at the top and bottom edges of the sample. (a-d) correspond to locations on M(H) indicated in Fig. 1(a) by the letters a-d. Before the matching peak nv/np ≈ 1 [frame (a)], and right at the matching peak [frame (b)], the PAPS and the VL are commensurate only near the edges of the sample, as indicated by the squares. (b) At the peak in M(H), 1D string-like defects which are perpendicular to the edges (or along 60° angles for the triangular case) originate from the boundaries. These gradually destroy the commensurability between the PAPS and the VL at the sample edges, shifting it towards the center of the sample [in (c)] when H is increased. In (c), just past the peak in M(H), the smallest (white) diamond-shaped cells (which look like squares rotated 45° from the horizontal) are mobile interstitial vortices whose plastic flow destroys the commensurability. These are also clearly present in (d), further down in M(H), where commensurability effects dissappear. This loss of commensurability can be quantified by observing in Fig. 1(c) the drastic drop in P4 right after the commensurate peak.
Color figure (using updated colormap, not 1996 version)
To investigate further the VL spatio-temporal dynamics as M(H) crosses the first commensurate ( nv/np ≈ 1 ) peak for the system in Fig. 1(a), we present snapshots in Fig. 3(a-d) of the real-space time evolution of the VL Voronoi cells. The locations of these snapshots on the magnetization curve are indicated in Fig. 1(a) by the letters a-d. Figure 3(a) shows the flux distribution just before the nv/np ≈ 1 peak in M(H). Commensurability, as indicated by the presence of mostly square Voronoi cells, starts at the edges of the sample as the magnetization begins to rise. Figure 3(b) shows the flux distribution precisely at the magnetization peak. The VL is strongly commensurate with the PAPS, but only in regions close to the sample edges. Beyond the peak, Fig. 3(c), the commensurability between the VL and the PAPS moves from the edges of the sample to the center, and the edges start to become disordered as vortices move (by flowing between the vortices trapped at the pins) into the interstitial sites, indicated by the smaller (lighter) polygons oriented 45° from the sample edge. This clearly shows that plastic flow of interstitial vortices dominates vortex transport when nv > np . Finally, Fig. 3(d) shows the vortex configuration near the minimum between the two commensurate peaks, where the flux distribution is disordered throughout the sample. As the external field is further increased, the vortex lattice remains disordered until the second MF, where the cycle is repeated; however, this time the VL also includes interstitially-pinned vortices.
Since the commensurate portions of the vortex lattice are uniform in density, a terrace in the flux gradient arises with large currents at its boundary, where the flux density abruptly changes. In larger systems, we observe a flux profile with several separate commensurate regions (plateaus or terraces) inside the sample. For increasing H, the commensurate portions or terraces gradually move towards the center of the sample, reaching the center, where they eventually disappear. We point out that we do not assume a priori any particular form of the profile; we compute it dynamically by ramping up the external field H from zero. This dynamically-generated 2D terraced profile is somewhat similar to the static 1D one obtained in [12]. However, while all integer MF's produced peaks in that 1D model, in our 2D model, for a given pinning geometry, only certain MFs actually produce peaks in M(H). We find, for instance, that a kagomé and honeycomb PAPS do not have a peak at nv/np ≈ 1 for weak pinning (fp ≈ 0.1 f0 ); a 1D analysis cannot distinguish these important geometrical effects. We have also found that the terraced ordered regions of the VL (corresponding to consecutive matching fields that produce commensurability peaks in M(H)) are separated by distinct domains where the flux lattice is disordered.

V.  COMPLEX PATTERNS OF MAGNETIC FLUX: ISLANDS AND STRIPED DOMAINS

Figure4.png
Figure 4: Vortex configurations for a square PAPS with a lower density of pins of higher strength: np = 0.49/λ2, fp = 1.4f0, ξp = 0.25λ, Np=475, at (a) H=2.1 Φ02 and (b) H=2.2 Φ0 / λ2 . Vortex arrangements of different orientations form complex domains of various shapes including (a) islands and (b) stripes, both surrounded by current-carrying winding strings of 5-7 disclination pairs. These unexpected and striking flux domain patterns continuously evolve as a function of the applied field. These results show that, in general, the current distribution is not terraced. This is in contrast to predictions by static 1D models. We also note that the islands and stripes of (approximately) constant B, surrounded by curved domain-boundaries carrying large currents, contain weak currents because in them ∇×B ≈ 0.
Color figure (using updated colormap, not 1996 version)
Figures 4(a,b) present the Voronoi cells for a system with a lower pin density np = 0.49/λ2 , but about four times higher pin strength fp = 1.4f0 , than the np and fp used for Fig. 1(a). The magnetization (not shown) is initially very high when nv < np , because the strong pinning forces create a very high Jc; however, after the first MF (i.e., when nv > np ), there is a very rapid drop off in M(H) and Jc(H) . This rapid drop occurs because the characteristic pinning mechanism changes from individual columnar defect pinning to much weaker interstitial pinning. This result, obtained via a dynamical simulation, is consistent with previous work using a time-independent formalism [18,19]. At high fields intricate vortex patterns appear with islands and stripes even though no noticeable change in the magnetization can be seen. The extremely weak interstitial pinning found at these high fields means that ordered regions of vortices with different orientations are close enough energetically that different local configurations can coexist in the sample. Notice that, in general, the field distribution is not 1D terraced as in [12]. For instance, contours of constant B = indicate that the "islands" and "stripes" in Figs. 4(a,b) have near-zero current (∇×B ≈ 0) and are surrounded by current-carrying winding strings composed mostly of small current loops.

VI.  EFFECTS OF THE MICROSCOPIC PINNING PARAMETERS AND CONTROLLED DISORDER ON THE MAGNETIZATION

Figure5.png
Figure 5: 
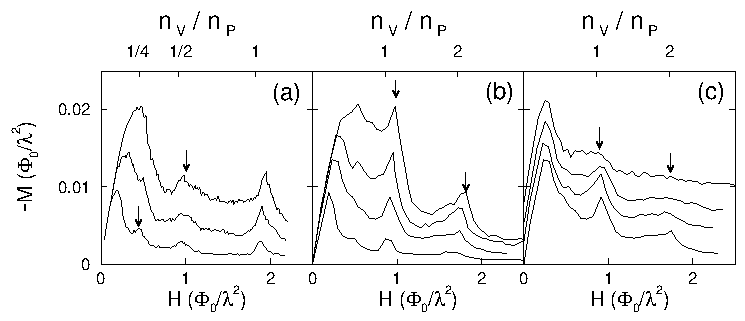
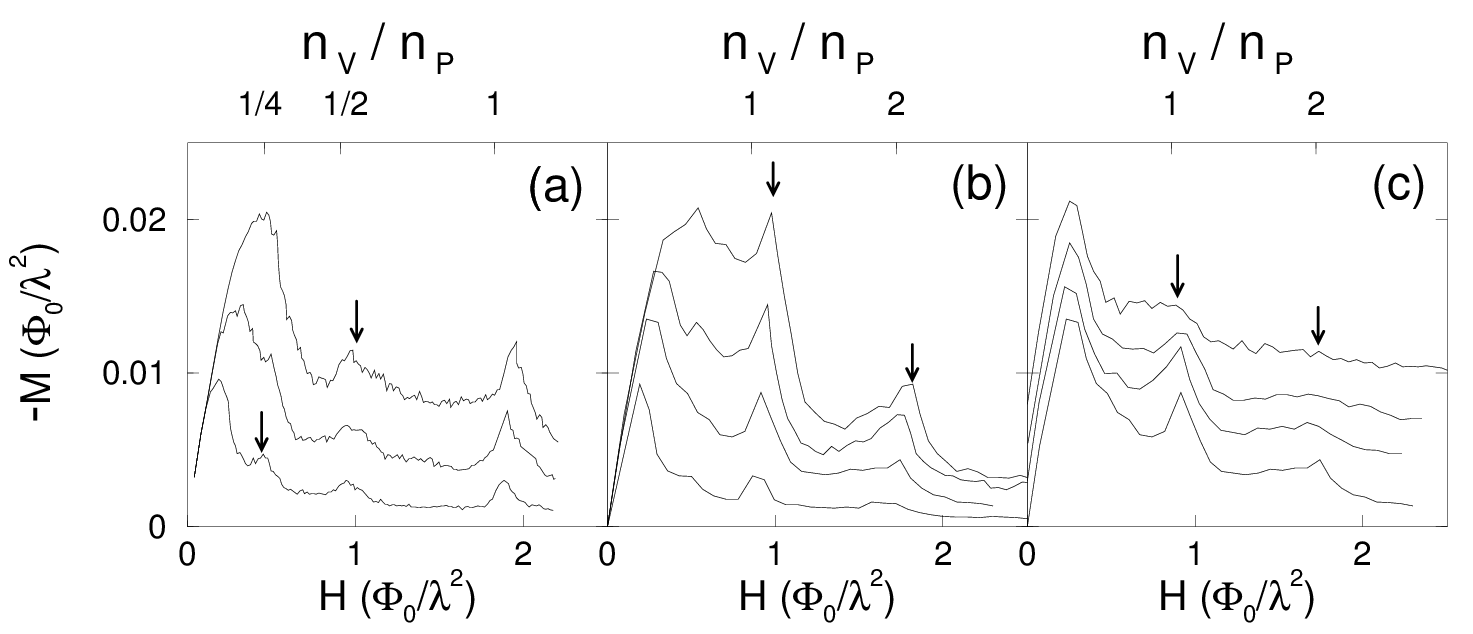
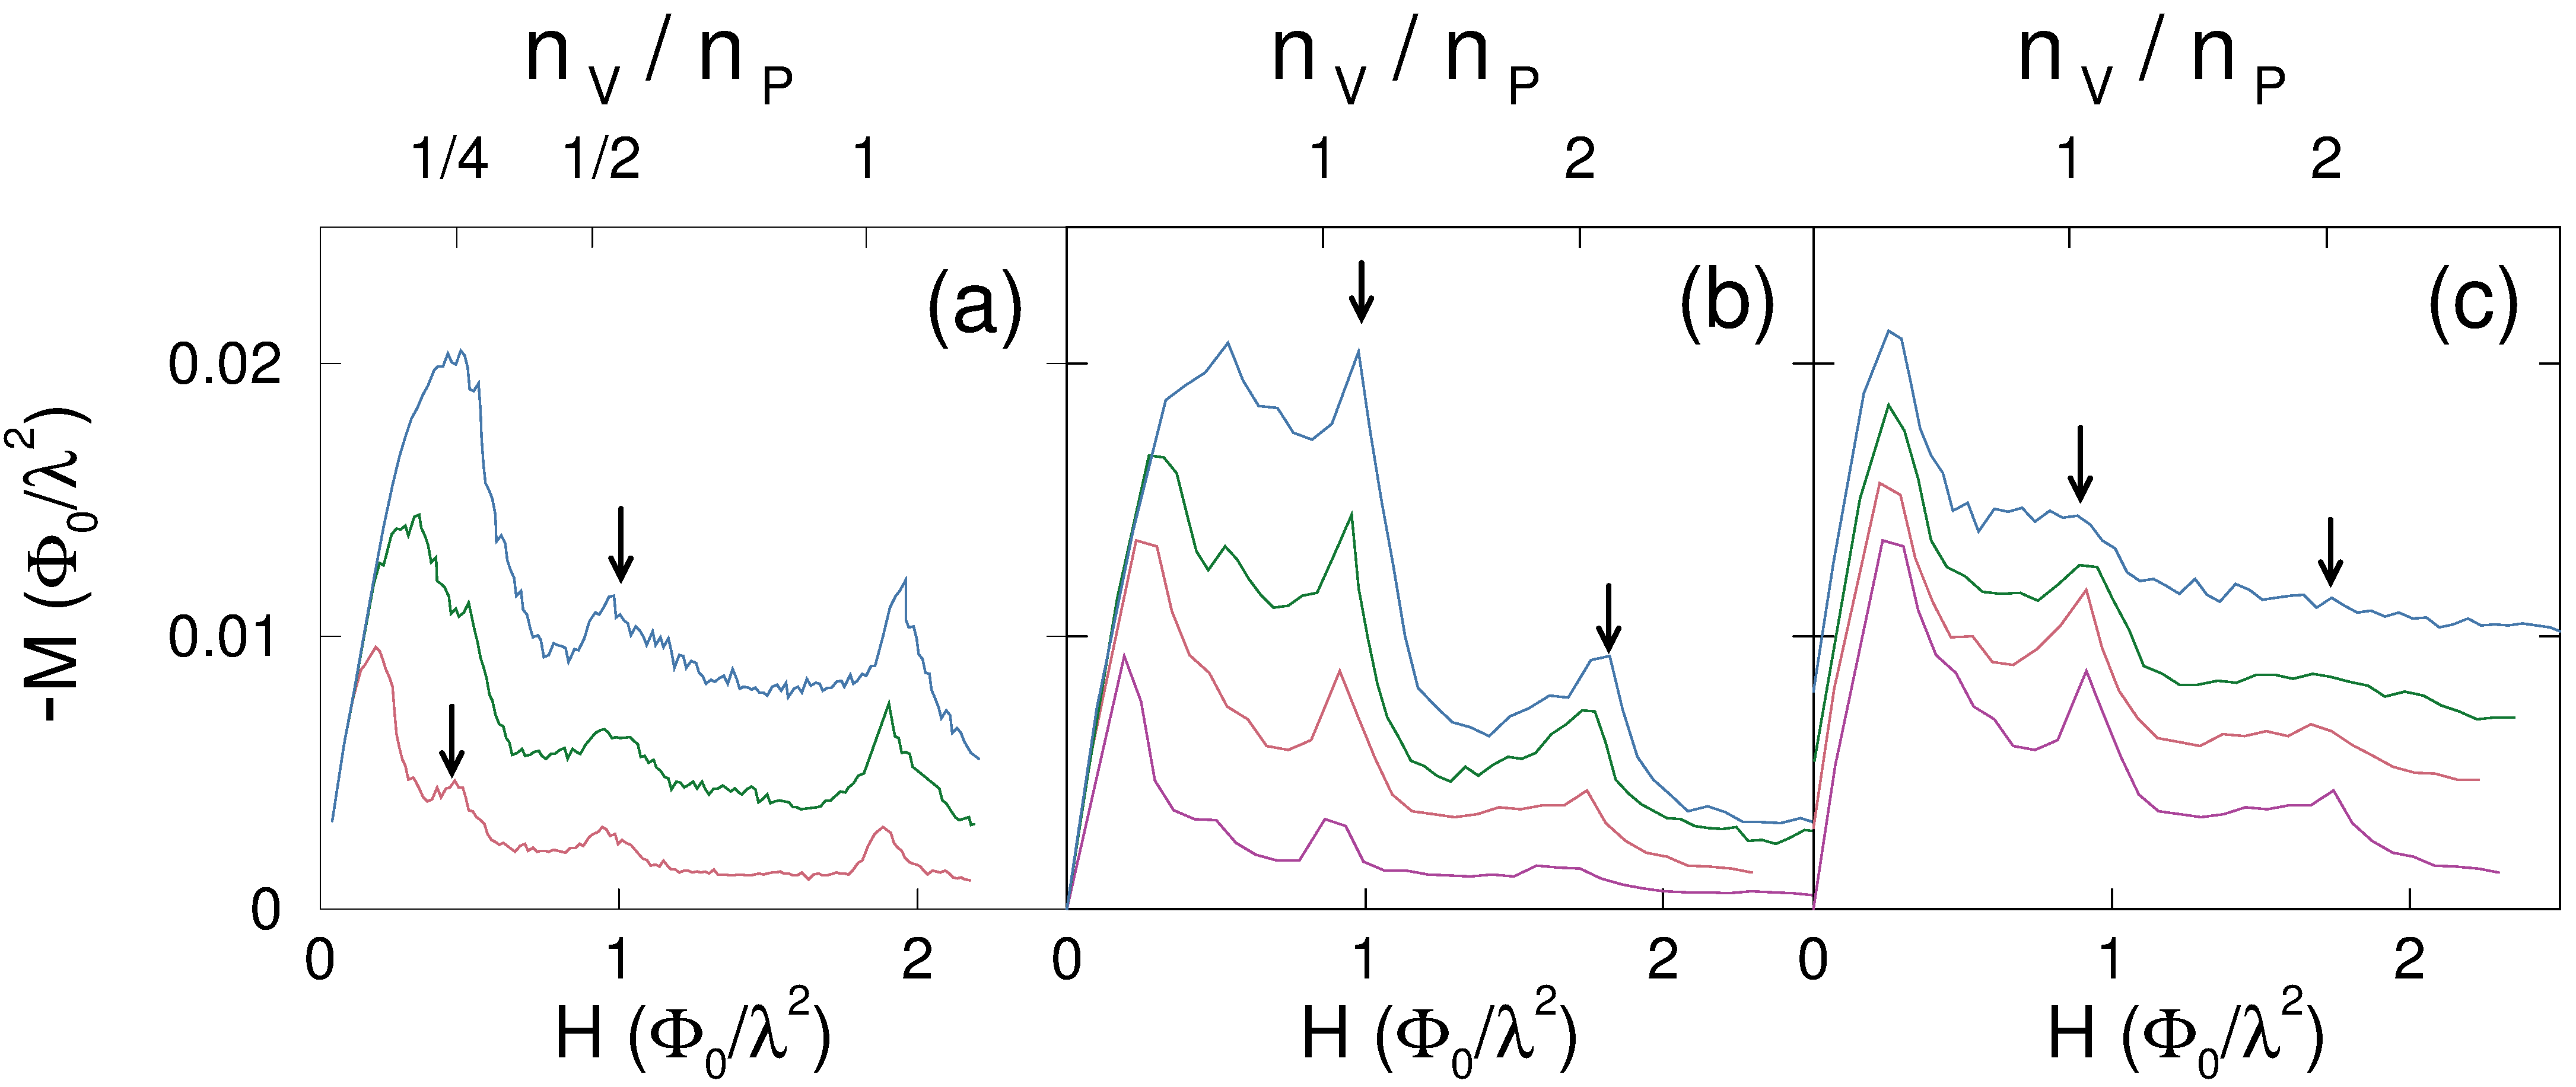
Magnetization versus field for samples with a square array of pinning sites. (a) M(H) with submatching peaks at 1/4 and 1/2 for samples with weak pinning [fp / f0 = 0.1 (bottom curve), 0.2, 0.3 (top)], and np about twice as large as in Fig. 1(a): np=1.83/λ2, Np=1776. (b) shows M(H) for increasing pinning strength and (c) shows M(H) for increasing disorder in the location of the pins. In (b) np=0.86/λ2 and the pin strengths are varied: fp/f0 = 0.1 (bottom), 0.2 , 0.3 , and 0.4 (top). In (c) fp is fixed at 0.2 f0 , with disorder introduced gradually by randomly moving (with uniform probability) the pins from the initial square positions by distances up to δr, for δr = 0 (bottom), λ/8, λ/6, and λ/4 (top). All other parameters are the same as those used in Fig. 1(a). For clarity, consecutive curves in (c) have been shifted vertically.
Color figure
Submatching peaks [indicated by arrows at nv/np ≈ 1/4 and 1/2 in Fig. 5(a)] in M(H) become evident for samples with a large density of weak pinning sites. At the half matching field a portion of the vortices in the sample are arranged in a checkerboard pattern similar to that seen in wire networks [10]; however, submatching configurations at nv/np = 1/3, 2/5, 2/3, and 3/4, which are found for wire networks, are not observed here. Our result for the submatching configurations are in agreement with the experiments in Ref. [3], which use a system resembling ours. As the pinning force is increased the width of M(H) increases, making it difficult to identify the submatching fields below 1/2. As the flux gradient increases, the submatching vortex configurations can only form on smaller regions of the sample. It is thus easier to observe submatching field configurations in a sample with a higher density (np=1.83/λ2) of weak pinning sites [e.g., Fig. 5(a)] than in a sample with a lower density (np=0.86/λ2) of pins [see Fig. 5(b)]. This is the reason why experiments (e.g., Ref. [3]) can distinguish these peaks in M(H) more clearly when the temperature is near Tc, where pinning is weak and submatching vortex configurations can occupy a larger portion of the sample.
Figure 5(b) shows M(H) for maximum pinning forces between fp = 0.1f0   and fp = 0.4f0, with all other parameters fixed and (np=0.86/λ2). The overall magnetization width increases and the peaks at nv/np ≈ 1 and 2 [indicated by the arrows in Figs. 5(b,c)] have sharper drop offs right after the MFs. The sharp drop off after the first matching peak can be understood as a crossover in the pinning mechanism from vortices strongly pinned at defect sites to much weaker interstitial pinning. Such a crossover has been considered theoretically [18,19,31] and observed experimentally [20,21,22,23] for random pinning arrays. Since Jc is directly related to the width of M, these results indicate that enhancements of Jc may be restricted to fields less than the first matching field in the case when only one vortex can be trapped by each pinning site.
To examine the effects of disorder we displaced the pins from their ordered positions in random directions up to a maximum distance δr . Figure 5(c) shows the effects on the first two peaks of M of gradually increasing the disorder in a square PAPS. As the disorder is increased from δr = 0 to δr = λ/8 (bottom two curves), the second peak at nv/np ≈ 2 is suppressed, while the first peak remains. This occurs because the second peak is caused by weaker interstitial pinning-thus more susceptible to disorder. As the disorder further increases to δr = λ/4 (top curve), the first peak disappears as well. Wire networks [9] in which disorder is gradually introduced show similar effects since, in both cases, commensurate peaks decrease with increasing disorder.

VII.  SUMMARY AND DISCUSSION

In summary, we have presented simulations of flux-gradient-driven superconducting vortices interacting with various PAPS, on systems of varying pinning strength, density, geometry, and disorder. The comparison between M(H) and the Pn(H)s, shown in Fig. 1, quantitatively correlates how the geometry of the pinning lattice affects the underlying microscopic dynamics of individual vortices and its relation to macroscopic measurable quantities like M(H) and Jc.
Our simulations explicitly show that at certain matching fields a subset of the vortex lattice becomes commensurate with the underlying array of pinning sites. Because of the gradient in the flux density due to the critical state, the commensurate portions of the vortex lattice first start at the edge of the sample and then gradually move to the center. These configurations persist for a finite range of increasing external field, creating a peak in M(H). By monitoring the vortex coordination number as a function of external field, Pn(H), we have shown that the vortex lattice goes through a series of ordered-disordered states with the higher matching (nv > np) vortex configurations having interstitially pinned vortices rather than multiple vortices per pinning site. For high matching fields, domains of different orientational order appear-including coexisting stripes and islands of approximately constant field (see Fig. 4). These novel striped and island-type domains are separated by current-carrying winding paths made of 5- 7-fold defect pairs. These unexpected and complex phases could be imaged by using, for instance, scanning Hall probes and Lorentz microscopy.
We have also shown in a quantitative manner that beyond the first matching field interstitially pinned vortices are much more mobile, leading to plastic flow of these weakly-pinned vortices around more strongly pinned ones trapped at defect sites. This result is consistent with recent experimental work with randomly placed columnar pinning [21,22], in which a sharp drop off in M(H) was observed; this drop was interpreted as a consequence of the weak pinning felt by interstitial vortices.
It is of interest to compare our results for commensurability at the first matching field to those predicted by the Bose glass theory [13]. Here, a Mott insulator-like state occurs in which the vortex lattice is locked into the pinning lattice for a certain field range, preventing further vortices from entering and creating a Meissner like rise in the magnetization. With a PAPS, we observe such a Mott insulator-like peak in the magnetization near the first matching field; however, this peak is gradually lost as the pinning array is distorted [see Fig. 5(c)]. Experiments with random columnar pinning also do not observe a peak in the magnetization at the first matching field [21,22]. This suggests that because of the symmetry of the periodic pinning array all the pinning sites are equally accessible so that the vortex lattice can easily lock into the pinning sites. Conversely, for a random distribution of defects, fluctuations in the locations of pinning sites can make some sites inaccessible due to screening of pins by repulsion from nearby occupied pinning sites [31].
For samples with a random distribution of pinning sites, fluctuations in the distribution can create regions of low pinning density which can give rise to easy-flow percolating paths for the vortices [31] and thus reduce Jc. With a PAPS such fluctuations in pin density are minimized, thus maximizing Jc. Since Jc is related to M(H), our results show that the enhancement of the critical current for certain field regions is greater for periodic arrays of pinning sites than for random arrays.

  ACKNOWLEDGEMENTS

We thank J. Siegel for a critical reading of the manuscript. SF was supported in part by the NSF under grant No. DMR-92-22541. We acknowledge the use of the UM Center for Parallel Computing, partially funded by NSF grant No. CDA-92-14296.

References

[1]
For reviews, and extensive lists of references, see: M.G. Blamire, J. Low Temp. Phys. 68, 335 (1987); A.N. Lykov, Adv. Phys. 42, 263 (1993).
[2]
L.D. Cooley et al., Appl. Phys. Lett. 64, 1298 (1994).
[3]
M. Baert et al., Europhys. Lett. 29 157 (1995);
[4]
M. Baert et al., Phys. Rev. Lett. 74, 3269 (1995);
[5]
V.V. Moshchalkov et al., Jpn. J. App. Phys. 34, 4559 (1995).
[6]
A. Bezryadin and B. Pannetier, J. Low Temp. Phys. 102, 73 (1996); A. Bezryadin, Yu. N. Ovchinnikov, and B. Pannetier, Phys. Rev. B 53, 8553 (1996).
[7]
C. Hünnekes et al., Phys. Rev. Lett. 72, 2271 (1994); S.H. Brongersma et al., ibid. 71, 2319 (1993). M. Ziese et al., Phys. Rev. B 53, 8658 (1996).
[8]
R. Fehrenbacher, V.B. Geshkenbein, and G. Blatter Phys. Rev. B 45, 5450 (1992); M.A. Itzler and M. Tinkham, ibid. 51, 435 (1995).
[9]
See, e.g., M.A. Iztler et al., Phys. Rev. B 42, 8319 (1990); Q. Niu and F. Nori, ibid. 39, 2134 (1989).
[10]
L.N. Vu, M.S. Wistrom, and D.J. Van Harlingen, Appl. Phys. Lett. 63, 1693 (1993); H.D. Hallen et al., Phys. Rev. Lett. 71, 3007 (1993); K. Runge and B. Pannetier, Europhys. Lett. 24, 737 (1993).
[11]
M. Oussena et al., Phys. Rev. Lett. 72, 3606 (1994).
[12]
L.D. Cooley and A.M. Grishin, Phys. Rev. Lett. 74, 2788 (1995).
[13]
D.R. Nelson and V.M. Vinokur, Phys. Rev. B 48, 13060 (1993).
[14]
See, e.g., M. Azbel, Zh. Eksp. Theor. Fiz. 46, 929 (1964); D.R. Hofstatder, Phys. Rev. B 14, 2239 (1976).
[15]
D. Weiss et al., Phys. Rev. Lett. 66, 2790 (1991).
[16]
E.A. Jackson, Nonlinear Dynamics (Cambridge, 1991).
[17]
See, e.g., Charge Density Waves in Solids, L.P. Gorkov and G. Grüner, eds. (Elsevier, New York, 1989).
[18]
I. Khalfin and B. Shapiro, Physica 207C, 359 (1993).
[19]
L. Radzihovsky, Phys. Rev. Lett 74, 4919, 4923 (1995).
[20]
M. Konczykowski et al., Physica C235-240, 2965 (1994).
[21]
K.M. Beauchamp et al., Phys. Rev. Lett. 75, 3942 (1995)
[22]
K.M. Beauchamp et al., Phys. Rev. B 52, 13052 (1995).
[23]
E. Rosseel et al., Phys. Rev. B 53, R2983 (1996).
[24]
F. Nori, Science 271, 1373 (1996).
[25]
T. Matsuda et al., Science 271, 1393 (1996).
[26]
U. Yaron et al., Nature 376, 753 (1995), and work cited therein.
[27]
C.P. Bean, Rev. Mod. Phys. 36, 31 (1964).
[28]
Y.B. Kim, C.F. Hempstead, and A.R. Strnad, Rev. Mod. Phys. 36, 43 (1964).
[29]
R.A. Richardson, O. Pla, and F. Nori, Phys. Rev. Lett. 72, 1268 (1994).
[30]
C. Reichhardt, C.J. Olson, J. Groth, S. Field, and F. Nori, Phys. Rev. B, 52, 10411 (1995).
[31]
C. Reichhardt, C.J. Olson, J. Groth, S. Field, and F. Nori, Phys. Rev. B, 53 R8898 (1996).
[32]
See, e.g., O. Pla and F. Nori, Phys. Rev. Lett. 67, 919 (1991); H.J. Jensen, A. Brass, A.-C. Shi, and A.J. Berlinsky, Phys. Rev. B 41, 6394 (1990); and references therein.


File translated from TEX by TTHgold, version 4.00.
Back to home