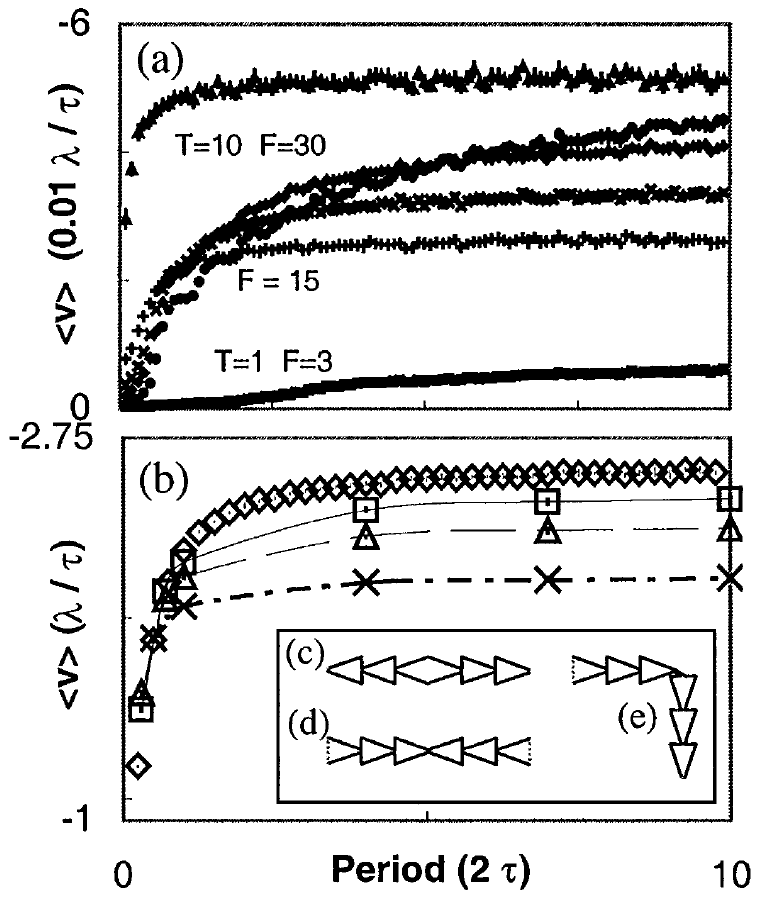
 Figure 2:
Average fluxon velocity 〈v 〉,
versus driving force period P for
(a) one fluxon and (b) many fluxons. For very low
periods little rectification occurs, and for higher
periods, 〈v 〉 slowly increases.
The four F=15 curves in the middle of (a)
show similar behavior and correspond to
(top to bottom at τ = 10):
T=1 (•),
T=2 (diamonds),
T=3 (×),
T=2 (+).
In (b), similar 〈v 〉 occur for
50 (diamonds),
100 (squares),
150 (triangles), and
250 (×) fluxons.
Inset:
Schematic diagram for concave (c) and convex (d)
fluxon lenses that disperse/focus fluxons
from/at their centers. (e) shows a corner unit.
|

