Physical Review Letters 80, 2197 (1998)

Fractal networks, braiding channels, and voltage noise in intermittently flowing rivers of quantized magnetic flux

C. J. Olson, C. Reichhardt, and Franco Nori
Department of Physics, The University of Michigan, Ann Arbor, Michigan 48109-1120

(Received 17 September 1997)

We analyze the microscopic dynamics of vortex motion through channels that form riverlike fractal networks in a variety of superconducting samples, and relate it to macroscopic measurable quantities such as the power spectrum. As a function of pinning strength, we calculate the fractal dimension, tortuosity, and the corresponding voltage noise spectrum. Above a certain pinning strength, a remarkable universal drop in both tortuosity and noise power occurs when the vortex motion changes from shifting braided channels to unbraided channels. We compare our results with experiments.
PACS numbers: 74.60.Ge, 62.20.Fe
Simulation
Channel network
Fractal dimension
Tortuosity and fluctuating braided channels
Voltage Noise
References

The complex dynamics of a moving superconducting vortex lattice interacting with material defects has attracted considerable experimental and theoretical attention, with the observation of intricate channels of vortex motion both in simulations [1,2,3], beginning with the seminal work in Ref. [4], and through Lorentz microscopy [5]. Similar channel structures have been observed in a large variety of systems, including fluid flow in a disordered landscape, Josephson junctions, Wigner crystals, magnetic bubbles, and stress networks in granular systems. These channels resemble the fractal basins created by natural rivers [6] and other fractal network systems (e.g., percolation).
A quantitative microscopic understanding of the characteristics of the channels and their effect on macroscopic measurements is particularly important for superconducting systems, in which the disorder can be controlled. Different strengths of disorder produce very different flow patterns, ranging from elastic flow to plastic flow [1], characterized by vortices that either remain pinned or move intermittently through a vortex river. Since these flows can be inferred experimentally via the voltage noise produced by the moving vortices [7,8,9,10], a deeper understanding of the relationship between the noise characteristics and the properties of the vortex channels would lend insight into the experimental systems.
The complex vortex channel network [11] observed in some regimes is difficult to treat analytically. Until now, the channel structure has been studied qualitatively in simulations [1,2,3,4], and only transitions caused by changes in driving force have been considered (e.g., Refs. [3]). Transitions in driven vortex lattices caused by different disorder strength (e.g., Ref. [2]) are more difficult to study since a separate simulation is required for each disorder strength. We use a large-scale parallel simulation to probe 21 samples spanning an order of magnitude of pinning strengths, and present a systematic study of the transition from one plastic flow phase to another. We quantify the fractal nature and the tortuosity of the vortex channels in the plastic flow for the first time, and show how both evolve with disorder strength. We observe remarkable correlations between microscopic quantities such as the tortuosity and macroscopic measures such as voltage noise power, corresponding to changes in the microscopic nature of the channel flow.
Simulation- We model a transverse two-dimensional slice (in the x-y plane) of a T=0 zero-field-cooled superconducting infinite slab containing rigid vortices that are parallel to the sample edge (H=Hz). Vortices nucleate along one edge of the sample at regular time intervals, enter the superconducting slab under the force of their mutual repulsion, pass through a pinned region 36λ×36λ in size (where λ is the penetration depth) where a flux gradient naturally forms [12], and are removed at the other sample edge. Up to 1000 vortices are simultaneously inside the sample, which is periodic only in the y direction transverse to the gradient.
The vortex-vortex repulsion is correctly represented by a modified Bessel function, K1(r/λ). The vortices also interact with 1943 non-overlapping attractive parabolic wells of radius ξp=0.15λ, representing a density of pinning sites np = 1.0/λ2. The maximum pinning force, fp, of wells in a given sample has a Gaussian distribution. We consider 21 samples (a much larger number of parameters than in typical simulations [4]) with mean values of fp ranging from fp = 0.06 f0 to fp = 1.0 f0, where f0 = Φ02/8π2λ3.
The overdamped equation of vortex motion is fi=fivv + fivpvi, where the total force fi on vortex i (due to other vortices fivv, and pinning sites fivp) is given by fi =  ∑j=1Nv f0   K1 (|rirj |/λ) rij + ∑k=1Np fpp|rirk(p)|   Θ[(ξp − |rirk(p) |)/λ]rik. Here, Θ is the Heaviside step function, ri (vi) is the location (velocity) of the ith vortex, rk(p) is the location of the kth pinning site, ξp is the pinning site radius, Np (Nv) is the number of pinning sites (vortices), rij=(rirj )/|rirj|, rik=(rirk(p))/|rir(p)k|, and we take η = 1. We measure all forces in units of f002/8π2λ3 and lengths in units of the penetration depth λ. We run a highly optimized parallel code on IBM SP parallel computers to carefully characterize a wide range of parameters, and we equilibrate each sample for at least 106 MD steps before taking high resolution data. Due to the open boundary conditions in the x direction, the ratio of vortices to pins, nv/np, is not directly controlled. Instead, it emerges naturally as the system equilibrates. Further simulation details appear in Ref. [2].
Fig1.png
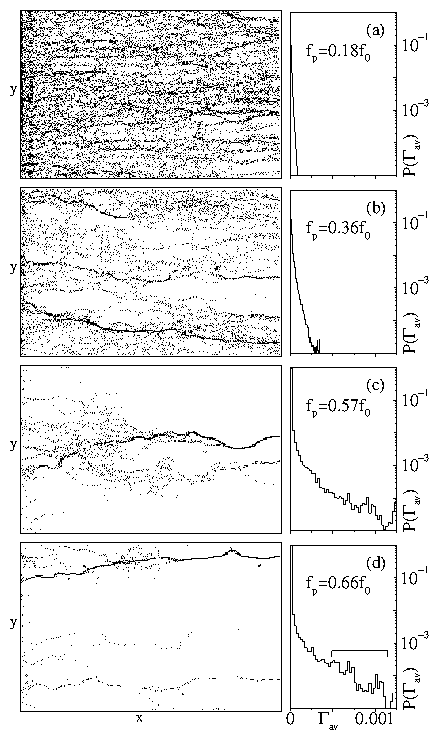
Figure 1: Left panels: top view of samples with four different pinning strengths: (a) fp = 0.18 f0, (b) fp = 0.36 f0, (c) fp = 0.57 f0, (d) fp = 0.66 f0. The channels most often followed by vortices are darker. The number of channels decreases as the pinning strength fp increases. Right panels: distribution of the average rate Γav at which vortices pass through individual grid points in the river. For strong pinning, the few remaining channels are frequently traveled [see brace in (d)].
Channel network- We divide the sample into a 300 ×300 grid to identify the vortex channels. When a vortex enters a grid element, the counter associated with that grid element is incremented, defining a "channel transit" field. All grid elements that are visited at least once are considered part of the channel network. We calculate the average rate Γav at which vortices move through each grid site, and construct a distribution of Γav over all the grid sites to indicate how frequently individual channels were traversed. Figure 1 shows channels and distributions Pav) from four samples with different pinning strengths fp. For weak pinning, fp <~0.2 f0 [Fig. 1(a)], the channels cover the entire sample area relatively uniformly. Many grid sites are visited by vortices at a low rate, so Pav) peaks at small Γav. As fp increases, islands of pinned vortices (shown in white in Fig. 1) form and grow. At the same time, favored channels for vortex flow appear. Grid elements inside channel sites are frequently traversed by vortices, so Pav) extends to higher rates Γav. At higher pinning forces when there are only a small number of channels, the grid elements inside channels produce a distinguishable increase in Pav) for Γav >~5 ×10⁻⁴. The average separation between channels dperp increases roughly linearly with increasing pinning strength fp as the ratio nv/np increases [Fig. 1(b-d) and inset of Fig. 2], until for fp  ∼ 0.66f0, the channels are no longer connected in the transverse y-direction, as is clearly visible in Fig. 1(d). This breakup represents a transition in the nature of the plastic flow, as we shall show below.
Fractal dimension.- To quantify the effect of pinning strength fp on the fractal dimension Df of the vortex channel network, we use a box-counting algorithm [13] to find Df, and plot the results in Fig. 2. Here, Df = −limϵ→ 0 logN(ϵ)/logϵ, where N(ϵ) is the number of boxes of side ϵ required to cover all grid sites belonging to the channels. The dimension Df ≈ 2 for low pinning strengths, fp <~0.2 f0, when vortices are flowing throughout the entire sample [Fig. 1(a)]. As fp is increased and the channel structure becomes more sparse [Fig. 1(b-c)], the fractal dimension Df decreases.
Our samples with strong disorder have fractal dimensions close to those predicted recently for channel networks in systems where elastic interactions are unimportant [14,16], For example, our sample with fp=0.75f0 has a fractal dimension of Df = 1.37, close to the mean-field prediction of 4/3 found in Ref. [14] and the value 1.38 observed in Ref. [15]. At the strong pinning case of fp = 0.83f0, where there are a few isolated channels in the sample, we find Df = 1.27. This is in reasonable agreement with simulations of non-interacting particles [14], Df = 1.21, and with other theories [16], Df = 1.22. At the very highest pinning strength, fp=0.9f0, only a single river passes through the sample, giving an extremely low fractal dimension Df = 1.15, in agreement with the fractal dimension of the main channel of physical rivers [6], Df = 1.14 − 1.20.
Fig2.png
Figure 2: Fractal dimension Df (filled diamonds; solid line is guide for eye) versus pinning strength fp, and the fraction Na/Nv (open triangles; dotted line is guide for eye) of vortices moving inside the sample versus fp. Both show a slope change near fp ≈ 0.6f0. Lower left inset: Average distance between channels dperp versus fp. Upper right inset: Variation with time of the tortuosity, στ, versus fp. Note that στ drastically increases near the region where the power S0 [Fig. 3] peaks.
The fractal dimension gives a static picture of the vortex channels. We probe the dynamics of the channels by considering the fraction Na/Nv of vortices that move a distance greater than the pinning diameter 2ξp. We find that changes in Na/Nv closely follow changes in the fractal dimension Df. At low pinning strengths, fp < 0.2f0, all of the vortices move, as seen in Figs. 1(a) and 2, indicating mostly elastic motion. The moving fraction Na/Nv decreases with increasing pinning strength as the motion becomes plastic and some vortices remain permanently trapped in pinning sites. Fits to Na(fp) [dashed line in Fig. 2] and Df(fp) [solid line] indicate that there is a small but noticeable change of slope in both quantities near fp/f0  ∼ 0.6f0. As we shall see later, this occurs when the vortex channels change behavior from braiding (fp/f0 <~0.6) to non-braiding (fp/f0 >~0.6).
Tortuosity and fluctuating braided channels.- To examine the motion of individual vortices, we compute the tortuosity of the path followed by each vortex. The tortuosity τ measures the amount a path winds [6]: τ = x/L, where x is the actual distance traveled by the vortex as it crosses the sample, and L is the width of the sample. Thus, τ ≥ 1, and for a straight path, τ = 1.
Fig3.png
Figure 3: Tortuosity τ (filled diamonds) of vortex paths and power S0 in the second octave of the spectra (open circles), both versus pinning force fp. The same results hold for the third and fourth octaves. A peak in the noise power was also observed in spectra obtained from the voltage transverse to the driving direction. Left inset: Spectra S(ν) for fp = 0.18f0. Right inset: Spectra S(ν) for fp = 0.66f0. The narrow band peaks in both spectra are caused by the regular rate at which vortices are added to the sample, while the peak at ν ∼ 10−3 in the right inset is due to the typical time of flight for motion through the isolated channels.
The plot of the average tortuosity τ shown in Fig. 3 reveals a very interesting behavior that is not reflected in the fractal dimension Df. For low pinning strengths fp < 0.05f0, τ ∼ 1.1, indicating that the vortex paths wind very little. The tortuosity increases with pinning force as the pins become more effective and cause individual vortex paths to wind around islands of pinned flux, as in Fig. 1(b). A vortex can follow a very tortuous trajectory by crossing between what would have been distinct paths at lower pinning strengths. The heavy crossing or braiding of channels leads to a peak value of τ ≈ 1.5 for fp ≈ 0.5f0. As seen in the inset of Fig. 2, the variation in time of the tortuosity, στ, also peaks near fp ≈ 0.5f0. For fp <~0.5 f0, the vortices follow a network of heavily braided flow channels. A remarkable drop in τ between fp  ∼ 0.5f0 and fp  ∼ 0.7 f0 to a saturated low value of τ ∼ 1.15 is clearly visible in Fig. 3. It is important to emphasize that the drop coincides with a transition from channels that are braided across the entire length of the sample at intermediate pinning strengths, 0.2f0 < fp < 0.5f0 [Fig. 1(a-b)], to isolated, unbraided channels at higher pinning strengths, fp > 0.6f0 [Fig. 1(d)], that are too far apart to significantly interact. This change is not merely a finite size effect, since it is occurring over length scales significantly smaller than the sample width.
The crossover from increasing to decreasing tortuosity results from the combined effects of simultaneously increasing the vortex-pin interactions and the flux gradient. Vortex-pin interactions are less important at low pinning forces, and the vortices follow relatively straight paths. As the pin strength increases, some vortices become trapped, the vortex paths begin to wind, and the tortuosity increases. The flux gradient is also increasing, however, and at the crossover point, the flux gradient begins to dominate. The vortices then flow directly down the steeper gradient, decreasing the tortuosity. We have observed the transition in samples of different x direction lengths: 18λ×36λ, 36λ×36λ, and 48λ×36λ. The pinning force at which the transition occurs shifts downwards slightly as sample length increases. In very long samples it is thus possible for the channel flow phase to dominate for a fixed current and to be detected by local Hall probes. A more detailed account of the effects of sample size will appear elsewhere.
Voltage Noise.- We next link the transitions in the vortex channel structure with experimentally accessible voltage noise signals. We sum the forces in the x-direction along a strip of the sample 5 λ in width to obtain our voltage signal. We find the spectrum of the resulting signal, Vx = (1/Nv)∑i fx(i), for each sample configuration, and indicate the spectral power by plotting the integrated noise power in one frequency octave S0 = ∫ν0ν1 dνS(ν) versus pinning strength fp in Fig. 3. Here, ν0 = 1.2 ×10⁻⁴ and ν1 = 2.4 ×10⁻⁴. Remarkably, the form of S0 closely follows the tortuosity τ. This is because both measures are sensitive to the number of metastable states accessible to the system. When τ is high, the vortices wander significantly in the transverse direction, sampling many metastable states and thus producing a high noise power. The overall drop in noise power for fp >~0.5f0 occurs as the amount of braiding in the channels decreases. We can compare our results to experiments [9,10], in which a peak in the noise power occurs near the depinning transition when plastic flow occurs and high τ is expected. At higher currents, the pinning effectively becomes weaker, the vortices flow more elastically, τ is expected to be lower, and a drop in noise power is observed. This agrees with the results shown Fig. 3: for the most plastic flow, the highest τ occurs and the noise power is highest, while for weaker pinning, the vortices flow in straighter paths, τ is lower, and the noise power drops. Noise measurements can thus be used to probe the tortuosity τ.
The shape of the noise curve changes significantly at fp  ∼ 0.5f0 [insets of Fig. 3]. For fp <~0.5f0, the spectrum for ν >~10−3 is of the form S(ν)  ∼ ν−α [left inset of Fig. 3], where α decreases for higher pinning strengths. For fp < 0.1f0, α ≈ 2, while for 0.2f0 < fp < 0.5f0, α ≈ 1.7, consistent with the experimental measurements of D'Anna et al. [8] and Marley et al. [9], respectively. During and after the drop in S0, for fp >~0.5f0, the spectrum S(ν) is no longer of a form that can be characterized by a unique slope. Instead, the relatively straight, isolated channels produce a time of flight signal in the spectrum similar to experimentally observed signals [8]. No unique time of flight signal appears in our simulation at lower pinning forces, fp < 0.5f0, since the many braided channels present lead to a spread in the tortuosities and a spread in the time spent crossing the sample.
In summary, using novel measures of vortex channel structures, including the fractal dimension of the channel network and the tortuosity of individual vortex paths, we have provided strong evidence for a transition between two distinct vortex plastic flow phases as a function of disorder strength. We have shown that, as disorder increases, the weak-pinning straight paths continuously evolve to a braided winding-channel pattern that is characterized by high noise power and a high tortuosity with large fluctuations in time. A sharp drop in the tortuosity and noise power for intermediate pinning signals a transition to flow in non-braiding, isolated individual channels. The drop in noise power is consistent with experimental measurements [9,10]. The transition is a universal property of the average pinning strength and not a sample-dependent phenomenon, since the disorder configuration was different in every one of the 21 sample used. This crossover among different dynamical flow regimes as a function of pinning strength may also be important to other slowly driven disordered systems such as Wigner crystals, colloids, Josephson junctions, and magnetic bubbles. Our observation that the tortuosity and noise power follow each other closely is a novel result indicating that a macroscopic noise power measurement gives direct insight into the microscopic tortuosity, a link that may be useful for systems with driven channels. Our predictions can be tested through experiments such as Lorentz microscopy or noise measurements in superconductors, and direct imaging of colloids.
Computer services were provided by: the Maui High Performance Computing Center, sponsored in part by grant F29601-93-2-0001; and by the University of Michigan Center for Parallel Computing, partially funded by NSF Grant No. CDA-92-14296. CO was supported by the NASA Graduate Researchers Program.

References

[1]
F. Nori, Science 271, 1373 (1996).
[2]
C. Reichhardt, C.J. Olson, J. Groth, S. Field, and F. Nori, Phys. Rev. B 52, 10441 (1995); ibid. , 53, R8898 (1996); ibid. , 54, 16108 (1996); C.J. Olson, C. Reichhardt, and F. Nori, ibid. 56, 6175 (1997); C.J. Olson, C. Reichhardt, J. Groth, S. Field, and F. Nori, Physica C 290, 89 (1997).
[3]
C. Reichhardt, C.J. Olson, and F. Nori, Phys. Rev. Lett. 78, 2648 (1997); N. Gronbech-Jensen, A.R. Bishop, and D. Dominguez, ibid. , Phys. Rev. Lett. 76, 2985 (1996); A.E. Koshelev and V.M. Vinokur, ibid., 73, 3580 (1994); M.C. Faleski, M.C. Marchetti, and A.A. Middleton, Phys.  Rev. B 54, 12427 (1996).
[4]
H.J. Jensen, A. Brass, and A.J. Berlinsky, Phys. Rev. Lett. 60, 1676 (1988); A. Brass, H.J. Jensen, and A.J. Berlinsky, Phys. Rev. B 39, 102 (1989).
[5]
T. Matsuda, K. Harada, H. Kasai, O. Kamimura, and A. Tonomura, Science 271, 1393 (1996).
[6]
I. Rodriguez-Iturbe, Fractal river basins: chance and self-organization (Cambridge, New York, 1997); G. Korvin, Fractal Models in the Earth Sciences (Elsevier, Amsterdam, 1992); S. Kramer and M. Marder, Phys. Rev. Lett. 68, 205 (1992); E. Somfai and L.M. Sander, Phys.  Rev. E 56, R5 (1997).
[7]
J.R. Clem, Phys. Rep. 75, 1 (1981).
[8]
G. D'Anna, P.L. Gammel, H. Safar, G.B. Alers, D.J. Bishop, J. Giapintzakis, and D.M. Ginsberg, Phys. Rev. Lett. 75, 3521 (1995).
[9]
A.C. Marley, M.C. Higgins, and S. Bhattacharya, Phys. Rev. Lett. 74, 3029 (1995).
[10]
R.D. Merithew, M.W. Rabin, M.B. Weissman, M.J. Higgins, and S. Bhattacharya, Phys. Rev. Lett. 77, 3197 (1996).
[11]
Brief videos of vortex motion through channels are available at http://www-personal.engin.umich.edu/~nori
[12]
Our vortices are flux-gradient driven, and thus no artificial uniform force is applied to them. Refs. [3,4] consider uniform force cases.
[13]
L.S. Liebovitch and T. Toth, Phys. Lett. A 141, 386 (1989).
[14]
O. Narayan and D.S. Fisher, Phys. Rev. B 49, 9469 (1994).
[15]
M.S. Tomassone and J. Krim, Phys. Rev. E 54, 6511 (1996).
[16]
J. Watson and D.S. Fisher, Phys. Rev. B 54, 938 (1997).


File translated from TEX by TTHgold, version 4.00.
Back to Home