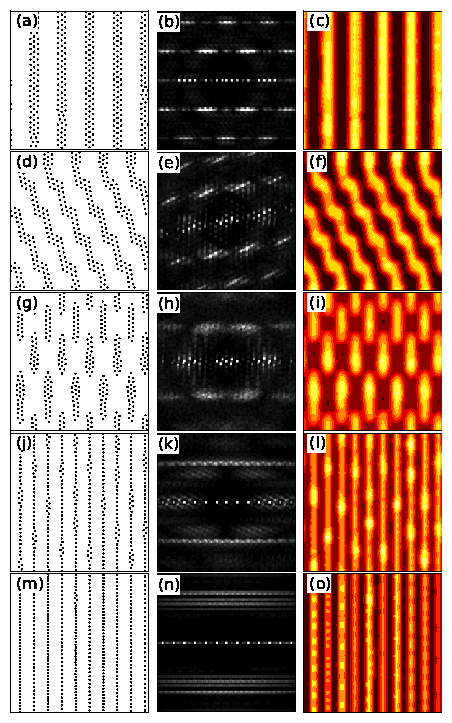
Soft Matter 10, 6332 (2014)

Stripe Systems with Competing Interactions on Quasi-One Dimensional Periodic Substrates

Danielle McDermott,ab Cynthia J. Olson Reichhardt*a and Charles Reichhardta

aTheoretical Division, Los Alamos National Laboratory, Los Alamos, New Mexico 87545, USA. E-mail: cjrx@lanl.gov; Fax: +1 505 606 0917; Tel: +1 505 665 1134
bDepartment of Physics, University of Notre Dame, Notre Dame, Indiana 46556, USA

Received 20th June 2014
Accepted 3rd July 2014
DOI: 10.1039/c4sm01341g
www.rsc.org/softmatter
We numerically examine the two-dimensional ordering of a stripe forming system of particles with competing long-range repulsion and short-range attraction in the presence of a quasi-one-dimensional corrugated substrate. As a function of increasing substrate strength or period we show that a remarkable variety of distinct orderings can be realized, including modulated stripes, prolate clump phases, two dimensional ordered kink structures, crystalline void phases, and smectic phases. Additionally in some cases the stripes align perpendicular to the substrate troughs. Our results suggest that a new route to self assembly for systems with competing interactions can be achieved through the addition of a simple periodic modulated substrate.
1 Introduction
2 Simulation
3 Results
4 Summary
References

1  Introduction

There are a wide variety of systems that exhibit pattern formation in the form of ordered stripes, which can often be attributed to the existence of competing interactions [1,2,3,4,5,6,7,8]. Such stripe morphologies appear in soft matter systems such as colloids [3,4,8,9,10,11,12,13] and lipid monolayers near critical points [14]; in magnetic systems [15]; in certain superconducting vortex systems such as low-κ materials [16], multi-layered [17,18] superconductors, or multi-band superconductors [19]; in charge-ordered states observed in quantum Hall systems [20] or cuprate superconductors [21]; and in ordered states of dense nuclear matter [22]. Numerous studies have been devoted to understanding what types of particle-particle interactions can give rise to such patterns [3,4,5,6,23,24,25,26]. Having a clear methodology to control the patterns would be very useful for self-assembly and tailoring specified morphologies for applications.
One aspect of these stripe-forming systems that has received little attention is the effect on the pattern formation of adding a periodic substrate. There are many examples of systems in which the addition of a periodic substrate can induce different types of ordering. The substrate may occur naturally at the atomic scale due to molecular ordering at a surface, or a substrate can be imposed using an external field or by nanostructuring or etching the surface. A system of repulsively interacting colloids forms a triangular lattice in the absence of a substrate, but when the colloids are placed on an optically created quasi-one-dimensional (q1D) periodic substrate, a number of distinct crystalline and smectic orderings appear as a function of substrate strength or commensurability [27,28,29,30,31,32,33,34,35,36]. Similarly, magnetic colloids interacting with a fabricated q1D corrugated surface [37,38] also exhibit crystalline disordered and smectic phases as a function of particle density [37]. In a superconducting vortex system, when a q1D modulated substrate is created by etching the surface of the superconductor, different types of commensurability effects appear that are correlated with ordered and disordered vortex structures [39,40,41].
In this work we examine the two-dimensional ordering of particles with long range repulsion and short range attraction interacting with a periodic q1D substrate. The particular model we examine combines Coulomb repulsion with a short-range exponential attraction between particles. In the absence of a substrate, this system is known to exhibit bubble, stripe, void, and uniform phases which have been well characterized as a function of particle density and the ratio of attraction to repulsion [6,10,16,23,42,43]. We specifically focus on parameter regimes in which the system forms stripes in the absence of a substrate [6]. It might be expected that the addition of a q1D periodic substrate to a stripe system would produce only a limited range of phases since the stripes could simply align with the substrate; however, we find that this system exhibits a remarkably rich variety of distinct phases as a function of substrate strength and the ratio of the particle spacing to the substrate minima spacing. These phases include 2D modulated structures, prolate clump crystals, void crystals, and ordered kink arrays. Additionally the stripes can be aligned perpendicular to the substrate troughs. Our results show that the addition of q1D substrates can be a new route to controlling pattern formation in systems with competing interactions.
Fig1.png
Fig.  1: The stripe system in the absence of a substrate at a density of ρ = 0.3. (a) Radial distribution function g(r) showing a peak at r = 1.2a0. (b) Real space image of the stripes. (c) Density plot in which high densities correspond to brighter spots. (d) S(k).

2  Simulation

We consider a two-dimensional system with periodic boundary conditions of size L ×L containing N particles that have pairwise interactions including both repulsive and attractive components. The particle configurations are obtained by annealing the system from a high temperature molten state in small increments to zero temperature. The particle dynamics are governed by the following overdamped equation:
η d Ri

dt
= − N

ji 
V(Rij) + Fsi +FTi .
(1)
Here η is the damping term which we set to unity and Ri (j) is the location of particle i (j). The particle-particle interaction potential has the form V(Rij) = 1/RijBexp(−κRij), where Rij=|RiRj| and Rij=(RiRj)/Rij. The Coulomb term 1/Rij produces a repulsive interaction at long range, while the exponential term gives an attraction at shorter range. At very short range the repulsive Coulomb interaction becomes dominant again. For computational efficiency, we employ a Lekner summation method to treat the long-range Coulomb term [44]. The particle density is ρ = N/L2, and unless otherwise noted we take ρ = 0.3. In the absence of a substrate, previous studies of this model found that for fixed B = 2.0 and κ = 1.0, the system initially forms clumps at low density that grow in size up to ρ = 0.27. For 0.27 < ρ ≤ 0.46 the system forms stripes, for 0.46 < ρ ≤ 0.58 void crystals form, and a uniform triangular lattice appears for ρ > 0.58 [6]. Here we fix B=2.0 and κ = 1.0 and focus on the stripe regime near the density of ρ = 0.3 illustrated in Fig. 1(b), where an array of stripes forms with three rows of particles in each stripe. The stripe ordering is also apparent in the corresponding density plot of Fig. 1(c). in the absence of a substrate, the stripes have a maximum width ws determined by the short-range attractive term in the potential. For stripe widths w up to and including ws, the particles on one edge of the stripe experience both an attraction and a repulsion from the particles on the opposite edge of the stripe, but if w becomes wider than ws, the attractive contribution goes out of range and is lost, leaving only the long-range repulsive interaction which tends to push the particles out of the stripe. Figure 1(a) shows the radial density function g(r) which has a first neighbor peak at 1.2a0, the value of the intra-stripe particle distance aintra. We find that aintra remains nearly constant throughout the stripe phase even as the density ρ is varied. The structure factor S(k) in Fig. 1(d) has six maxima regions at large k produced by the tendency of the particles to form hexagonal structures within each stripe. The two bright peaks at small k indicate the stripe ordering. For the parameters we consider, the interparticle potential has a minimum at Rij = 1.47a0. We focus on systems of size L = 36.5a0.
Fig2.png
Fig.  2: An example of a q1D periodic pinning substrate used in this work. The potential is modulated in the x direction and the substrate troughs are parallel with the y axis. The total depth of each well is 2Fp and the spacing between substrate minima is given by ap.
The force from the q1D pinning periodic substrate Fs is given by F_s = F_p (2 x/a_p) x where ap = L/Np, Np is the number of substrate minima, and ap is the spacing between minima. Such a substrate is illustrated in Fig. 2. The pinning force amplitude is Fp and we consider values in the range 0.01 ≤ Fp ≤ 6.0. Our primary interest is in the regime Fp < 2.0 since the transition from particle interaction-dominated to substrate interaction-dominated behavior typically occurs within this limit. The thermal force FT applied during the annealing phase is modeled as Langevin kicks with the properties 〈FTi(t)〉 = 0 and 〈FTi(t)FTj(t)〉 = 2ηkBTδijδ(tt). We start from a high temperature liquid state and decrease the temperature in small increments until T = 0, as in previous studies [6].
Fig3.png
Fig.  3: Real space particle positions (left column), S(k) (central column), and density plots (right column) for stripes ordering on a periodic q1D substrate with troughs aligned in the y direction for a system with ap = 3.65a0 and ρ = 0.3. (a,b,c) Aligned stripe phase at Fp = 0.05. (d,e,f) Modulated stripes at Fp = 0.08. (g,h,i) Prolate clump phase at Fp = 0.2. (j,k,l) 1D kink phase at Fp = 0.8. (m,n,o) Smectic phase at Fp = 2.0.

3  Results

We first consider the case where the distance ap between the substrate minima is significantly larger than the nearest-neighbor particle distance aintra=1.2a0 within a stripe. In Fig. 3 we show the particle positions, S(k), and density plots for a system with ap = 3.65a0 and ρ = 0.3, giving ap/aintra = 3.0. At Fp=0.05, Fig. 3(a,b,c) indicates that the substrate aligns the stripes along the y-direction, parallel to the substrate troughs. For Fp < 0.06 the stripes remain aligned in the y direction and half of the substrate minima contain no particles, since the substrate-free system forms five stripes and there are ten substrate minima. At Fp=0.08 in Fig. 3(d,e,f), the stripes have tilted and develop an additional modulated structure in the form of steps. These modulations have a tilted square ordering which can be more clearly seen in the density plot of Fig. 3(f). At Fp = 0.2 in Fig. 3(g,h,i), the stripes break up and the system forms an array of prolate clumps that have a 2D periodic ordering. This ordering produces additional features in S(k) at small k values as shown in Fig. 3(h). The breaking apart of the original stripes permits each of the ten substrate minima to capture an approximately equal number of particles. The clumps exhibit some asymmetry, with the clump width varying from three rows of particles at the center of Fig. 3(g) to two rows of particles elsewhere. This produces a smearing of the sixfold ordering at larger values of k in Fig. 3(h). At Fp = 0.8 in Fig. 3(j,k,l), stripe ordering returns when the particles form nearly 1D chains stretching along the length of each potential minima. These 1D chains are interspersed with kinks of smaller zig-zag patterns. The kinks have an effective repulsive interaction and tend to form a triangular lattice, as shown in Fig. 3(l). As Fp increases further, the size and number of kinks gradually deceases until the system forms a smectic state of 1D chains as shown in Fig. 3(m,n,o) at Fp = 2.0. For further increases in Fp, we find no changes in the smectic structure.
We term the structures in Fig. 3(m,n,o) "smectic" in order to distinguish them from the stripe phase shown in Fig. 3(a,b,c), even though both phases can be characterized as having stripe ordering. The smectic state in Fig. 3(m) is not as ordered as the stripe state in Fig. 3(a), as the number of particles from one column to the next is different in Fig. 3(m), while in the stripe state in Fig. 3(a) the number of particles in each stripe is almost identical and there is triangular ordering within the stripe. In principle, in the true equilibrium ground state at large Fp, each substrate minimum would capture an equal number of particles; however, the difference in energy between this ground state and the state shown in Fig. 3(m) is very small since the dominant contribution to the energy comes from particle-substrate interactions rather than particle-particle interactions. In our simulated annealing procedure, although we sweep the temperature slowly, once particles become trapped in a substrate minimum in the strong substrate limit it is difficult for them to escape again, so very long annealing times would be needed for the system to reach a true global ground state. Another feature in Fig. 3(m), shown more clearly in Fig. 3(o), is an additional modulation in the 1D structure caused by an incipient buckling in the most densely occupied potential minima. A small fully buckled region appears in the upper center portion of the panel, but this full buckling remains confined and does not spread into the entire sample.
Fig4.png
Fig.  4: (a) Nearest neighbor distance 〈dmin〉, (b) horizontal distance to closet substrate minima 〈dpin〉, and (c) total energy of the system ET/N vs Fp for the system in Fig. 3 with ap=3.65a0 and ρ = 0.3, highlighting the changes in the patterns.
Fig5.png
Fig.  5: Real space particle positions (left column), S(k) (central column), and density plots (right column) for a periodic q1D substrate with ap = 3.65a0 and ρ = 0.363. (a,b,c) Modulated stripe phase at Fp = 0.2. (d,e,f) Ordered kink phase at Fp = 0.3. (g,h,i) Ordered kink phase at Fp = 0.5. (j,k,l) Ordered kink phase at Fp = 1.0.
We characterize the onset of the different orderings by measuring the average nearest-neighbor particle distance 〈dmin〉 = N−1Ni=0dni, where dni is the distance to the nearest neighbor of particle i as obtained from a Delaunay construction. We also measure 〈dpin〉 which is the average horizontal distance from a particle to the closest substrate minimum, 〈dpin〉 = N−1Ni=0(xixp), where xi is the location in the x direction of particle i and xp is the location of the nearest substrate minimum. If all the particles reside at the substrate minima, 〈dpin〉 = 0. We also measure the total normalized energy of the system ET/N. In Fig. 4 we plot 〈dmin〉, 〈dpin〉, and ET/N vs Fp for the system in Fig. 3 with ap=3.65a0 and ρ = 0.3. There is a feature near Fp = 0.08 at the point where the straight stripes shown in Fig. 3(a,b,c) transition to the modulated stripe phase shown in Fig. 3(d,e,f). As Fp further increases, the modulated stripes gradually transform into the clump phase shown in Fig. 3(g,h,i). Near Fp=0.28 we find a signature of the transition from the clumps to the 1D kinked stripe state shown in Fig. 3(j,k,l) in the form of a peak in 〈dmin〉, a dip in 〈dpin〉, and a cusp in ET/N. For Fp > 0.28 the curves are smooth as the number of kinks gradually decreases and the particles move closer to the substrate minima. This is indicated by the steady decrease of 〈dpin〉 which approaches zero as the system forms the fully smectic state shown in Fig. 3(m,n,o).
Fig6.png
Fig.  6: Real space particle positions (left column), S(k) (central column), and density plots (right column) for a periodic q1D substrate with ap = 1.82a0 and ρ = 0.3. (a,b,c) Modulated stripe phase with a 2D periodic array of bubbles at Fp = 0.14. (d,e,f) Void phase at Fp = 0.2. (g,h,f) A better-defined void phase at Fp = 2.0.
For the same set of parameters but larger ap we observe the same set of patterns. If we increase the particle density ρ but hold the substrate period fixed, new patterns appear. At higher ρ the prolate clump phase is lost but new types of modulated kink phases occur. Fig. 5 shows the real space, S(k), and density plots for a system with ap = 3.65a0 at a particle density of ρ = 0.363 where the substrate-free system still forms stripes. The increase in particle density makes it more difficult to compress the particles into the 1D patterns observed at ρ = 0.3 in Fig. 3. At low Fp we observe a modulated stripe structure similar to that shown in Fig. 3(a). As Fp increases, the effects of the higher particle density become apparent. Figure 5(a,b,c) shows the ordering for Fp = 0.2, where a labyrinth phase containing a semiperiodic array of spokes appears. At Fp=0.3 in Fig. 5(d,e,f), an ordered array of kinks forms where each substrate minimum contains regions of two rows of particles interspersed with regions that are only a single row wide. The density plot in Fig. 5(f) indicates that the kinks order into a periodic structure. As Fp increases the number of kinks changes, as shown in Fig. 5(g,h,i) for Fp = 0.5. As Fp is further increased the system gradually develops more 1D behavior as illustrated in Fig. 5(j,k,l) at Fp = 1.0. For Fp ≥ 4.0, all of the kinks vanish.
Fig7.png
Fig.  7: (a) 〈dmin〉, (b) 〈dpin〉, and ET/N vs Fp for the system in Fig. 6 with ap=1.82a0 and ρ = 0.3, showing the onset of the different phases.
We next consider the limit in which the spacing ap between substrate minima becomes comparable to or smaller than the average nearest-neighbor particle spacing aintra=1.2a0. In Fig. 6 we plot the real space particle positions, S(k), and the local density for samples with ap = 1.82a0, ρ = 0.3, and ap/aintra = 1.5 for varied Fp. We find that when the pinning density is high, the original stripe structure remains intact up to relatively large values of Fp since the smaller substrate spacing permits all of the particles to take advantage of substrate minimum locations while still remaining in the original stripe pattern. Above this point, as Fp is increased we observe a modulated stripe phase with square ordering as shown in Fig. 6(a,b,c) for Fp = 0.14. At higher Fp there is a transition to a void crystal of the type shown in Fig. 6(d,e,f) for Fp=0.2. This void crystal becomes more stable and persists as Fp is further increased, as illustrated in Fig. 6(g,h,i) for Fp = 2.0. In Fig. 7(a,b,c) we plot the corresponding values of 〈dmin〉, 〈dpin〉, and ET/N versus Fp for the system in Fig. 6. At Fp = 0.1, there is an inflection in 〈dmin〉 at the transition from the stripe to the modulated stripe phase. The onset of the void phase near Fp=0.2 is marked by features in 〈dmin〉. Once the voids have formed, they remain stable for increasing Fp since all the particles can fit in a potential minimum. We observe similar void formation when we fix ap=1.82 but vary the particle density ρ.
Fig8.png
Fig.  8: Real space particle positions (left column), S(k) (central column), and density plots (right column) for periodic q1D substrates with ρ = 0.3. (a,b,c) A perpendicular stripe at ap = 1.2a0 and Fp = 2.0. (d,e,f) A clump phase at ap = 0.9125a0 and Fp = 0.8.
Fig9.png
Fig.  9: Phase diagram as a function of substrate spacing ap vs Fp for a system with fixed particle density ρ = 0.3 and aintra=1.2a0. The parallel stripes are illustrated in Fig. 3(a). The modulated stripes are stripes with some type of additional features, and include steplike structures of the type shown in Fig. 3(d) as well as prolate clumps such as in Fig. 3(g). The 1D smectic phase is illustrated in Fig. 3(m) where the particles form 1D rows in the pinning sites. An example of a void crystal appears in Fig. 6(g), while a clump crystal is shown in Fig. 8(d).
When the pinning density is increased, the stripe state persists to higher values of Fp. The stripe alignment changes, however, and we find that the stripes generally run perpendicular to the direction of the substrate troughs when ap is small, as shown in Fig. 8(a,b,c) for Fp = 2.0, ap = 1.2a0, ρ = 0.3, and ap/aintra = 1.0. The reason the perpendicular stripes occur is that when a substrate potential is added, it introduces a new length scale ap. If ap > w, where w is the natural stripe width, the stripes readily align along the y-direction and each stripe sits entirely within a potential minimum. If w > ap, the stripe would have to compress in order to remain inside the potential minimum, and if the substrate is not strong enough to overcome the energy barrier to this compression, a portion of the particles must sit at potential maxima. When ap is considerably smaller than w, the stripe structure can reduce its energy by orienting perpendicular to the y axis and maintaining its original value of w while still placing most of the particles inside potential minima. These energy balance effects cause the particles inside each stripe in Fig. 8(a) to form columns aligned with the y direction, while the stripes themselves are oriented along the x direction. This results in the peak structures at small k values in Fig. 8(b).
When ap < aintra we observe a transition from the stripe phase to a clump phase as illustrated in Fig. 8(d,e,f) at Fp = 0.8 for a system with ap=0.9125a0, ρ = 0.3, and ap/aintra = 0.76. In general, for ap/aintra < 1.0, clump phases form at large Fp when the substrate is strong enough to trap every particle at a potential minimum. This breaks apart the stripes that would otherwise align along the x direction as in Fig. 8(a) and replaces them with clumps that have a radius of ws. Due to the long-range repulsive interaction between particles, the clumps repel each other and form a generally crystalline arrangement as shown more clearly by S(k) in Fig. 8(e).
In Fig. 9 we plot a phase diagram as a function of substrate spacing ap and strength Fp based on our simulation results for a system with particle density ρ = 0.3. For large ap, modulated stripe structures such as elongated clumps or 1D stripes with kinks can easily remain aligned in the y direction, so they persist up to high values of Fp. At large enough Fp their structure becomes compressed and a 1D smectic state emerges. The onset of this smectic phase drops to lower Fp as ap decreases. At lower ap, the distance between substrate minima becomes small enough that a full stripe of width w that forms for Fp=0 can no longer fit into a single substrate minimum. When this occurs, the 1D stripe structure is lost and is replaced by the formation of a void crystal. For even smaller ap, the density of substrate minima becomes so high that the system can simultaneously maintain its preferred stripe ordering while still keeping most particles at substrate minima by forming stripes that run perpendicular to the substrate troughs. Just below ap=1.2a0, a mismatch effect occurs in which each particle is trapped in a potential minimum but the spacing between particles becomes ap rather than aintra. This unnaturally close spacing of the particles increases the relative magnitude of the Coulomb repulsive term and destabilizes the stripe structure, causing it to break apart into a clump crystal. The mismatch effect occurs only near ap/aintra=1; for the smallest values of ap shown in Fig. 9, the particles are able to redistribute themselves in the dense pinning sites with their preferred stripe spacing aintra and we find a reentrant stripe regime with labyrinth structure. For extremely small values of ap the substrate would cease to have an effect on the stripe ordering since all particles could find potential minima at nearly any location, and the system would return to its substrate-free configuration. We note that within the modulated stripe phase found for large ap, there are several other types of subphases such as kink lattices; however, Fig. 9 highlights the major regions of the different phases. Finite size effects may mask certain of the higher order modulated stripe phases having long wave length periodicities that are larger than our system size, so it is possible that an even larger number of distinct phases could appear in systems of very large size.

4  Summary

We examine a stripe forming system interacting with a periodic quasi-one dimensional substrate. We show that as a function of substrate strength and density, a remarkably rich variety of distinct orderings can be realized. These phases include stripes containing modulations that themselves form a 2D ordered structure, prolate clump phases, various types of 2D ordered kink arrays, and smectic structures. For denser substrate arrays we observe transitions from a modulated stripe phase to a void crystal or a clump phase. Our results show that corrugated substrates could provide a possible new route to controlling pattern forming systems.

  Acknowledgements

This work was carried out under the auspices of the NNSA of the U.S. DoE at LANL under Contract No. DE-AC52-06NA25396.

References

[1]
M. Seul and D. Andelman, Science, 1995, 267, 476.
[2]
A.D. Stoycheva and S.J. Singer, Phys. Rev. Lett., 2000, 84, 4657.
[3]
G. Malescio and G. Pellicane, Nature Mater., 2003, 2; Phys. Rev. E, 2004, 70, 021202.
[4]
M.A. Glaser, G.M. Grason, R.D. Kamien, A. Kosmrlj, C.D. Santangelo, and P. Ziherl, EPL, 2007, 78, 46004.
[5]
E. Edlund and M.N. Jacobi, Phys. Rev. Lett., 2010, 105, 137203.
[6]
C.J. Olson Reichhardt, C. Reichhardt, and A.R. Bishop, Phys. Rev. E, 2010, 82, 041502.
[7]
A. Giuliani, J.L. Lebowitz, and E.H. Lieb, Phys. Rev. B, 2011, 84, 064205.
[8]
N.G. Almarza, J. Pekalski, and A. Ciach, J. Chem. Phys., 2014, 140, 164708.
[9]
A. Imperio, L. Reatto, and S. Zapperi, Phys. Rev. E, 2008, 78, 021402.
[10]
Y.H. Liu, L.Y. Chew, and M.Y. Yu, Phys. Rev. E, 2008, 78, 066405.
[11]
J.-X. Chen, J.-W. Mao, S. Thakur, J.-R. Xu, and F.-Y. Liu, J. Chem. Phys., 2011, 135, 094504.
[12]
H.J. Zhao, V.R. Misko, and F.M. Peeters, New J. Phys., 2012, 14, 063032.
[13]
L.Q. Costa Campos, S.W.S. Apolinario, and H. Löwen, Phys. Rev. E, 2013, 88, 042313.
[14]
S.L. Keller and H.M. McConnell, Phys. Rev. Lett., 1999, 82, 1602.
[15]
M. Seul and R. Wolfe, Phys. Rev. A, 1992, 46, 7519.
[16]
X.B. Xu, H. Fangohr, S.Y. Ding, F. Zhou, X.N. Xu, Z.H. Wang, M. Gu, D.Q. Shi, and S.X. Dou, Phys. Rev. B, 2011, 83, 014501.
[17]
E. Babaev and M. Speight, Phys. Rev. B, 2005, 72, 180502(R).
[18]
C.N. Varney, K.A.H. Sellin, Q.-Z. Wang, H. Fangohr, and E. Babaev, J. Phys.: Condens. Matter, 2013, 25, 415702; L. Komendova, M.V. Milosevic, and F.M. Peeters, Phys. Rev. B, 2013, 88, 094515.
[19]
J. Gutierrez, B. Raes, A.V. Silhanek, L.J. Li, N.D. Zhigadlo, J. Karpinski, J. Tempere, and V.V. Moshchalkov, Phys. Rev. B, 2012, 85, 094511; J.A. Drocco, C.J. Olson Reichhardt, C. Reichhardt, and A.R. Bishop, J. Phys.: Condens. Matter, 2013, 25, 345703.
[20]
M.M. Fogler, A.A. Koulakov, and B.I. Shklovskii, Phys. Rev. B, 1996, 54, 1853; R. Moessner and J.T. Chalker, ibid., 1996, 54, 5006; E. Fradkin and S.A. Kivelson, ibid., 1999, 59, 8065; J. Gores, G. Gamez, J.H. Smet, L. Pfeiffer, K. West, A. Yacoby, V. Umansky, and K. von Klitzing, Phys. Rev. Lett., 2007, 99, 246402.
[21]
J. Zaanen and O. Gunnarsson, Phys. Rev. B, 1989, 40, 7391; V. Emery S. Kivelson, and J. Tranquada, Proc. Natl. Acad. Sci. U.S.A., 1999, 96, 8814.
[22]
G. Watanabe, T. Maruyama, K. Sato, K. Yasuoka, and T. Ebisuzaki, Phys. Rev. Lett, 2005, 94, 031101.
[23]
C. Reichhardt, C.J. Olson, I. Martin, and A.R. Bishop, Europhys. Lett., 2003, 61, 221. C.J. Olson Reichhardt, C. Reichhardt, I. Martin, and A.R. Bishop, Physica D, 2004, 193, 303.
[24]
E. Edlund, O. Lindgren, and M.N. Jacobi, Phys. Rev. Lett., 2011, 107, 085501.
[25]
K.A.H. Sellin and E. Babaev, Phys. Rev. E, 2013, 88, 042305.
[26]
G. Zhang, F.H. Stillinger, and S. Torquato, Phys. Rev. E, 2013, 88, 042309.
[27]
A. Chowdhury, B.J. Ackerson, and N.A. Clark, Phys. Rev. Lett., 1985, 55, 833.
[28]
J. Chakrabarti, H.R. Krishnamurthy, A.K. Sood, and S. Sengupta, Phys. Rev. Lett., 1995, 75, 2232.
[29]
Q.-H. Wei, C. Bechinger, D. Rudhardt, and P. Leiderer, Phys. Rev. Lett., 1998, 81, 2606.
[30]
L. Radzihovsky, E. Frey, and D.R. Nelson, Phys. Rev. E, 2001, 63, 031503.
[31]
C. Reichhardt and C.J. Olson Reichhardt, Phys. Rev. E, 2005, 72, 032401.
[32]
P. Chaudhuri, C. Das, C. Dasgupta, H.R. Krishnamurthy, and A.K. Sood, Phys. Rev. E, 2005, 72, 061404; M. Schmiedeberg, J. Roth, and H. Stark, Phys. Rev. Lett., 2006, 97, 158304.
[33]
W. Strepp, S. Sengupta, and P. Nielaba, Phys. Rev. E, 2002, 66, 056109; F. Burzle and P. Nielaba, Phys. Rev. E, 2007, 76, 051112.
[34]
J. Baumgartl, M. Brunner, and C. Bechinger, Phys. Rev. Lett., 2004, 93, 168301.
[35]
C. Dalle-Ferrier, M. Kruger, R.D.L. Hanes, S. Walta, M.C. Jenkins, and S.U. Egelhaaf, Soft Matter, 2011, 7, 2064.
[36]
L. Zaidouny, T. Bohlein, R. Roth and C. Bechinger, Soft Matter, 2013, 9, 9230.
[37]
J. Hu and R.M. Westervelt, Phys. Rev. B, 1996, 55, 771.
[38]
P. Tierno, Phys. Rev. Lett., 2012, 109, 198304.
[39]
O. Daldini, P. Martinoli, J.L. Olsen and G. Berner, Phys. Rev. Lett., 1974, 32, 218; P. Martinoli, H. Beck, M. Nsabimana and G.-A. Racine, Physica B, 1981, 107, 455.
[40]
L.S. Levitov, Phys. Rev. Lett., 1991, 66, 224.
[41]
Q. Lu, C.J. Olson Reichhardt, and C. Reichhardt, Phys. Rev. B, 2007, 75, 054502.
[42]
F.F. Munarin, K. Nelissen, W.P. Ferreira, G.A. Farias, and F.M. Peeters, Phys. Rev. E, 2008, 77, 031608.
[43]
C. Reichhardt, C.J. Olson Reichhardt, I. Martin, and A.R. Bishop, Phys. Rev. Lett., 2003, 90, 026401; C.J. Olson Reichhardt, C. Reichhardt, and A.R. Bishop, Phys. Rev. E, 2011, 83, 041501.
[44]
J. Lekner, Physica A, 1991, 176, 485; N. Grønbech-Jensen, G. Hummer, and K.M. Beardmore, Mol. Phys., 1997, 92, 941; M. Mazars, J. Chem. Phys., 2001, 115, 2955.


File translated from TEX by TTHgold, version 4.00.
Back to Home