 Figure 2:
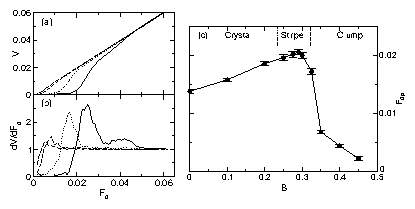
(a) Velocity V vs applied drive Fd in a sample with fp=0.2 for
B = 0.29 (solid line) stripe phase, B=0.0 (doted line) Wigner crystal,
B=0.35 (dashed) clump phase, and B=0.4 (long-dashed) clump phase.
(b) The corresponding dV/dF curves. (c) Depinning force vs B.
Labels indicate where the Wigner crystal, stripes, and clumps form
in the absence of quenched disorder.
|


