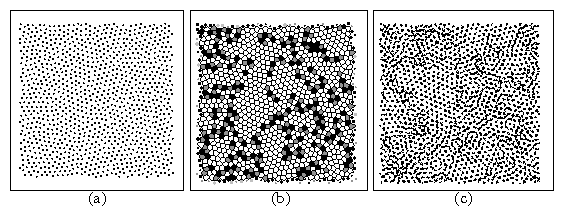
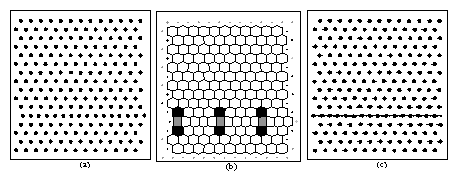
 Figure 3:
(a) Black dots: Colloids in the two-dimensional melting
sample at T/Tm=1.04, just above the melting transition. (b)
Voronoi construction indicating sixfold (white), sevenfold (black), and
fivefold (dark gray) coordinated particles.
(c) Lines indicate colloid motion over a fixed time interval.
|

