 Figure 4:
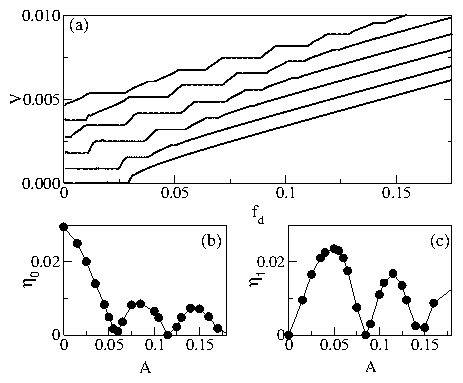
(a) Velocity V vs applied dc drive fd for
T/Tm = 0.0 with an additional applied ac drive.
The curves have been shifted up for presentation. Different
ac amplitudes from bottom to top are A = 0.0. 0.02, 0.04, 0.06, 0.1, and
0.12. (b) The width of the critical depinning force η0 vs
A. (c) The width of the first step η1 vs A.
|
