Physical Review E 98, 022603 (2018)

Laning and Clustering Transitions in Driven Binary Active Matter Systems

C. Reichhardt1, J. Thibault1,2, S. Papanikolaou2,3, and C.J.O. Reichhardt1

1Theoretical Division and Center for Nonlinear Studies, Los Alamos National Laboratory, Los Alamos, New Mexico 87545, USA
2Department of Mechanical and Aerospace Engineering, Western Virginia University, Morgantown, West Virginia 26506, USA
3Department of Physics, Western Virginia University, Morgantown, West Virginia 26506, USA

(Received 17 May 2018; published 7 August 2018)

It is well known that a binary system of non-active disks that experience driving in opposite directions exhibits jammed, phase separated, disordered, and laning states. In active matter systems, such as a crowd of pedestrians, driving in opposite directions is common and relevant, especially in conditions which are characterized by high pedestrian density and emergency. In such cases, the transition from laning to disordered states may be associated with the onset of a panic state. We simulate a laning system containing active disks that obey run-and-tumble dynamics, and we measure the drift mobility and structure as a function of run length, disk density, and drift force. The activity of each disk can be quantified based on the correlation timescale of the velocity vector. We find that in some cases, increasing the activity can increase the system mobility by breaking up jammed configurations; however, an activity level that is too high can reduce the mobility by increasing the probability of disk-disk collisions. In the laning state, the increase of activity induces a sharp transition to a disordered strongly fluctuating state with reduced mobility. We identify a novel drive-induced clustered laning state that remains stable even at densities below the activity-induced clustering transition of the undriven system. We map out the dynamic phase diagrams highlighting transitions between the different phases as a function of activity, drive, and density.
I. INTRODUCTION
II. SIMULATION AND SYSTEM
III. LANING AND CLUSTERING AT LOW DENSITIES
IV. DRIVE-INDUCED ACTIVE PHASE SEPARATION
V. DENSE PHASE
VI. SUMMARY
REFERENCES

I.  INTRODUCTION

A binary assembly of interacting particles that couple with opposite sign to an external drive such that the two particle species move in opposite directions has been shown to exhibit a rich variety of dynamical behaviors [1,2,3], the most striking of which is a transition to a laning state in which high mobility is achieved through organization of the particles into noncolliding chains [3,4,5,6,7,8]. Such systems have been experimentally realized using certain types of colloidal particles [9,10,11] or dusty plasmas [12,13], and have been used as a model for motion in social systems ranging from pedestrian flow [2,14] to insect movement [15]. A variety of non-laning states can appear in these systems, including jammed states where the particles block each other's motion [16,17,18,19], pattern forming states [19,20,21,22,23,24,25], and fully phase separated states [17,18,19]. The laning transition has many similarities to the phase separating patterns observed in related driven binary systems, indicating that formation of such patterns is a general phenomenon occurring in many nonequilibrium systems [26,27,28,29]. In a recent study of nonactive binary disks driven in opposite directions, a comparison of the velocity force curves with those found in systems that exhibit depinning behavior revealed four dynamic phases: a jammed state, a fully phase separated high mobility state, a lower mobility disordered fluctuating state, and a laning state [19]. The transitions between these phases as a function of increasing drift force appear as jumps or features in the velocity force curves coinciding with changes in the structural order of the system [19].
Active matter, consisting of particles that can propel themselves independently of externally applied forces, is an inherently nonequilibrium system commonly modeled using either driven diffusive or run-and-tumble dynamics [30,31]. For large enough activity, such systems are known to undergo a transition from a uniform fluid state to a phase separated or clustered state [32,33,34,35,36,37,38]. The onset of clustering or swarming can strongly affect the overall mobility of the particles when obstacles or pinning are present [39,40,41,42,43,44]. In studies of active matter moving under a drift force through obstacles, the mobility is maximized at an optimal run length since small levels of activity can break apart the clogging or jamming induced by the quenched disorder, but high levels of activity generate self-induced clustering that reduces the mobility [44,45].
In this work we examine a binary system of oppositely driven active run-and-tumble particles. In the absence of activity such a system is known to exhibit lane formation, but we find that when activity is included, several new dynamic phases appear. Adding activity to the non-active jammed state can break apart the jammed structures and restore the mobility to finite values, while when the non-active phase separated state is made active, the system becomes susceptible to undergoing jamming or clogging through a freezing-by-heating effect [46]. High levels of activity generally decrease the mobility by producing a disordered partially clustered fluctuating state. The mobility of the non-active disordered state decreases when activity is added, while the non-active laning states undergo a sharp transition as the activity is increased from low-collision, high mobility lanes to a low mobility disordered state with frequent particle collisions. At high drives and large activity, we find a new phase that we term a laning cluster phase in which dense clusters appear that are phase separated into the two different oppositely driven species. The laning cluster phase is stable down to particle densities well below the onset of activity-induced clustering in an undriven system. Transitions among these different phases can be identified through changes in mobility, changes in the particle structure, or changes in the frequency of particle-particle collisions, and we use these changes to map the dynamic phases as a function of external drift force, density, and activity. We draw analogies between the sharp transition we observe from the high mobility laning state to the low mobility disordered fluctuating state and panic transitions in which a high mobility state of pedestrian flow can change into a low mobility panic state in which continuous collisions between pedestrians occur.
We note that previous work on oppositely driven active matter particles by Bain and Bartolo [47] focused on the nature of the critical behavior at the transition between a fully phase separated state and a disordered mixed phase, rather than the mobility that we consider. Reference [47] also uses a flocking or Vicsek model, which is distinct from the run-and-tumble or driven diffusive active matter systems that are the focus of our work.

II.  SIMULATION AND SYSTEM

We consider a two-dimensional system of size L ×L with periodic boundary conditions in the x and y directions containing N particles of radius Rd. We take L=36 and Rd=0.5. The interaction between particles i and j has the repulsive harmonic form Fijpp = k(rij −2Rd)Θ(rij −2Rd)rij, where rij = |rirj|, rij = (rirj)/rij, and Θ is the Heaviside step function. We set the spring stiffness k = 50 large enough that there is less than a one percent overlap between the particles, placing us in the hard disk limit as confirmed in previous works [11,12,37]. The area coverage of the particles is ϕ = N πR2d/L2, and a triangular solid forms for ϕ = 0.9 [37]. The particles are initialized in non-overlapping randomly chosen locations and are coupled to an external dc drift force Fdi Fd x, where σi=+1 for half of the particles, chosen at random, and σi=−1 for the remaining half of the particles. The dynamics of particle i are determined by the following overdamped equation of motion:
η dri

dt
= N

ji 
Fppij + Fd + Fmi
(1)
Each particle experiences a motor force Fmi=Fmξ which propels the particle in a randomly chosen direction ξ for a fixed run time τ. At the end of each run time, the particle tumbles instantaneously by selecting a new randomly chosen direction for the next run time. The amplitude of the motor force is Fm = 1.0 and the simulation time step is δt = 0.002, so in the absence of other forces a particle moves a distance called the run length lr = Fmδt τ during each run time. To increase the activity of the particles, we increase τ while holding Fm fixed, so that the correlation time of the self-driven motion becomes larger. After applying the dc drive, we measure the time average of the velocity per particle for only the σi=+1 particles in the +x dc drift direction, 〈V〉 = (2/N)∑Ni = 1δ(σi−1)(vi·x), where vi is the velocity of particle i. The corresponding average velocity in the drift direction curve for the σi=−1 particles is identical to 〈V〉 due to symmetry. We wait a minimum of 107 simulation time steps before taking the measurement to ensure that the system has reached a steady state. We select this particular form of particle-particle interaction since the dynamics of the laning transition for this effectively hard disk model in the non-active limit has already been established [19]. This interaction model has been used extensively to study active matter clustering and phase separation [37,38,41,44]. We expect that similar results would arise under other forms of short-range interactions that are close to the hard sphere limit. It would be interesting in future studies to consider the effects of longer range repulsion such as Yukawa interactions, or to introduce anisotropic interactions.

III.  LANING AND CLUSTERING AT LOW DENSITIES

Fig1.png
Figure 1: (a) The average velocity per particle 〈V〉 in the dc drift direction for the σi=+1 particles vs FD in a sample with particle density ϕ = 0.424. The run-and-tumble particles have run time τ = 10 (teal), 30 (orange), 150 (periwinkle), 500 (pink), 2000 (green), 2 ×10⁴ (gold) and 3.2 ×10⁵ (brown). (b) The corresponding dV〉/dFD vs FD curves showing a peak that shifts to higher values of FD as τ increases. (c) The corresponding fraction of sixfold-coordinated particles P6 vs FD. The τ = 2 ×10⁴ and τ = 3.2 ×10⁵ curves show a transition to a state with high triangular ordering, indicative of clustering. The letters a, b, c, and d mark the values of FD at which the images in Fig. 2 were obtained.
Previous work on non-active laning particles revealed that there are four dynamic phases: a jammed state (phase I), a fully phase separated state (phase II), a mixed or disordered state (phase III), and a laning state (phase IV) [19]. For particle densities ϕ < 0.55, the system is always in a laning state, while for ϕ ≥ 0.55, the other three phases appear as well. For the active particles, we adopt the same nomenclature for phases I to IV, and define the low density regime as ϕ < 0.55. In Fig. 1(a) we plot 〈V〉 versus FD for a sample with ϕ = 0.424 for run lengths ranging from τ = 10 to τ = 3.2 ×10⁵. All of the velocity-force curves have nonlinear behavior at low drives that transitions to a linear response at higher drives, as indicated by the peak in the dV〉/dFD versus FD curves in Fig. 1(b). The nonlinear behavior extends up to higher values of FD as τ increases. For τ < 1.5 ×10⁴, the peak in dV〉/dFD coincides with the transition from disordered phase III flow to laning phase IV flow. Thus, as the activity is increased by raising τ, higher drift forces FD must be applied in order to induce lane formation. In Fig. 2(a) we illustrate the particle positions at τ = 500 and FD = 0.5 in the phase III disordered or mixed liquid state, while in Fig. 2(b) we show the same system in phase IV at FD = 12.5 where the particles form stable lanes.
Fig2.png
Figure 2: Instantaneous positions of the σi=+1 (blue) and σi=−1 (red) run-and-tumble particles subjected to a drift force FD. (a) A phase III mixed liquid state at τ = 500 and FD = 0.5. (b) A phase IV laning state at τ = 500 and FD = 12.5. (c) A phase III mixed state with local clustering at τ = 3.2 ×10⁵ and FD = 3.0. (d) A laning cluster phase V at τ = 3.2 ×10⁵ and FD = 12.5. The particles in the clusters have a significant amount of triangular ordering, producing an increase in P6 in phase V in Fig. 1(c).
In Fig. 1(c) we plot the fraction of sixfold-coordinated particles P6 versus FD. Here, P6=N−1i=1Nδ(zi−6) where the coordination number zi of particle i is obtained from a Voronoi construction. For τ < 1 ×10⁴, there is no clear jump in P6 at the transition from phase III to phase IV since, as shown in Fig. 2(b), the flowing lanes have no crystalline ordering. For τ > 1.5 ×10⁴, phase IV is replaced by a new phase V, as indicated by the increase in P6 at large FD for the τ = 2 ×10⁴ and τ = 3.2 ×10⁵ curves. Phase V is what we term a clustered laning state, as illustrated in Fig. 2(d) at τ = 3.2 ×10⁵ and FD = 12.5. Here the particles form clusters similar to the activity-induced clusters that appear in an undriven active matter system [32,33,34,35,36,37,38], but within each cluster, phase segregation into the two oppositely moving particle species occurs in order to eliminate particle-particle collisions. Triangular ordering of the particles emerges within the denser clusters, leading to the increase in P6 at the onset of phase V. For the same large τ = 3.2 ×10⁵ at a lower drive of FD=3.0, a phase III disordered mixed phase occurs as illustrated in Fig. 2(c), where a small amount of clustering is visible due to the high activity level.
Fig3.png
Figure 3: (a) Mobility M vs τ for a system with ϕ = 0.424 and FD = 2.0. (b) The corresponding P6 vs τ. (c) The corresponding average largest cluster size Cl vs τ. The IV-III transition that occurs with increasing τ is associated with a drop in M, a decrease in P6, and an increase in Cl.
We define the mobility M=〈V〉/V0 as the average particle velocity divided by the expected free flow velocity V0=FD/η of an individual particle in the absence of particle-particle interactions. In Fig. 3(a) we plot M versus τ for a system with ϕ = 0.424 at FD = 2.0, where V0 = 2.0. For τ < 100 the system forms a phase IV laning state similar to that illustrated in Fig. 2(b), and as τ increases, a transition to phase III occurs that is accompanied by a sharp decrease in the mobility from M=1.0 to M=0.62. The corresponding P6 versus FD curve appears in Fig. 3(b), showing that P6 decreases with increasing τ but has no sharp feature at the IV-III transition. In Fig. 3(c) we plot Cl, the average largest cluster size, versus τ for the same system. To measure Cl, we group the particles into clusters by identifying all particles that are in direct contact with each other, determine the number of particles Ncj in a given cluster j, and obtain Cl=〈max{Ncj}i=1N〉 where the average is taken over a series of simulation time steps. Larger values of Cl indicate that particle-particle collisions are more frequent. In steady state phase IV flow, the particles only experience brief pairwise collisions, so Cl < 3; additionally, the mobility is close to M=1 since the particles are undergoing nearly free flow. At the IV-III transition, the particle collision frequency increases, lowering the mobility, while the cluster size increases, with Cl reaching values of 30 or more. The IV-III transition that occurs when τ increases can be regarded as analogous to a transition in a social system from orderly laning flows of noncolliding pedestrians to a panic state in which pedestrians collide and impede each other's flow. Here, the run time would correspond to an agitation level which, above a certain threshold, destroys the orderly flow and produces a low mobility collisional flow. There is a small decrease in Cl near τ = 102 that is correlated with the minimum in P6. In this regime τ is just large enough for a cluster state to form. When τ increases slightly, the clusters become sufficiently long-lived to generate collisions that reduce the flow velocity, but these collisions cause the cluster size to decrease. At larger τ, the clusters are more robust and Cl increases again.
Fig4.png
Figure 4: (a) Mobility M vs τ for a system with ϕ = 0.424 at FD = 12.5. (b) The corresponding P6 vs τ. (c) The corresponding average largest cluster size Cl vs τ. At the IV-V transition, both P6 and Cl increase, but there is little change in M.
In Fig. 4(a-c) we plot M, P6, and Cl versus τ for the ϕ = 0.424 system from Fig. 3 at a higher drive of FD = 12.5, where very different behavior appears. At low τ the system is initially in the phase IV laning state due to the large drive, and as τ increases, a transition occurs into the clustered laning phase V illustrated in Fig. 2(d), rather than the disordered phase III flow that appears at lower FD. In phase IV, Cl is low since particle collisions are rare, and P6 ≈ 0.5 due to the one-dimensional liquid structure of the flow. At the transition to phase V, both Cl and P6 increase to Cl ≈ 500 and P6 ≈ 0.8, while there is very little change in the mobility M. Unlike the mixed flow found in phase III, phase V is is mostly phase separated as shown in Fig. 2(d), so the mobility is high even though Cl is large, since the particle-particle interactions are dominated by static contacts within the moving clusters rather than by collisional contacts between clusters moving in opposite directions.
Fig5.png
Figure 5: Dynamic phase diagram as a function of FD vs τ at ϕ = 0.424. Phase III: disordered mixing flow state; phase IV: laning state; phase V: clustered laning state.
In Fig. 5 we construct a dynamic phase diagram as a function of FD versus τ for a system with ϕ = 0.424 highlighting the regimes of phase III, IV, and V flow. The transitions between the phases are identified based on changes in M, P6 and Cl. For FD < 8.0, the system is in phase IV at small τ and phase III at large τ, as illustrated in Fig. 3. For 0 < τ < 1.5 ×10⁴, the IV-III transition line shifts to larger FD with increasing τ. For τ > 1.5 ×10⁵ and FD > 8.0, the system is still in phase IV at small τ but is in phase V at large τ, as shown in Fig. 4. We note that at this particle density of ϕ = 0.424, when FD = 0 there is no activity-induced clustered state, since as shown in previous studies of this model in a similar regime, such a state arises only for ϕ > 0.45 [19]. The results in Fig. 5 indicate that driving can induce the formation of a clustered state at large activity even at particle densities for which activity alone cannot produce a clustered state. This suggests that active non-clustering fluid states could transition to a clustered state under application of a shear or other external driving. We note that shearing could have a different effect from the driving applied in this work, since it is possible that the shear could break apart the clusters more effectively.

IV.  DRIVE-INDUCED ACTIVE PHASE SEPARATION

Fig6.png
Figure 6: P6 vs FD at τ = 3.2 ×10⁵ for ϕ = 0.06, 0.182, 0.303, 0.48, 0.6, and 0.848, from bottom to top. The letters a to f indicate the points at which the images in Fig. 7 were obtained.
Fig7.png
Figure 7: Instantaneous positions of the σi=+1 (blue) and σi=−1 (red) run-and-tumble particles from the system in Fig. 6 at τ = 3.2 ×10⁵. (a) Phase III at ϕ = 0.182 and FD = 0.01. (b) At ϕ = 0.6 and FD = 0.01, a cluster state forms with no separation of the different species. We call this phase CL. (c) Phase III at ϕ = 0.182 and FD = 3.0. (d) Phase III with weak clustering at ϕ = 0.6 and FD = 3.0. (e) Phase V, the laning cluster state, at ϕ = 0.182 and FD = 12.5. (f) Phase V at ϕ = 0.6 at FD = 12.5.
We next study the evolution of phases IV and V in greater detail over a range of particle densities and external drives. In Fig. 6 we plot P6 versus FD at τ = 3.2 ×10⁵ for particle densities ranging from ϕ = 0.06 to ϕ = 0.848. At the lowest values of FD, when ϕ < 0.475, P6 < 0.45 and the system is always in a disordered state as illustrated in Fig. 7(a) at ϕ = 0.182 and FD = 0.01. When ϕ > 0.4, there is a transition to a cluster state in the absence of drive, and this cluster state, which we term phase CL, persists at low drives, as shown in Fig. 7(b) for ϕ = 0.6 and Fd = 0.01. Here a dense solid-like region with a significant amount of triangular ordering is surrounded by a low-density liquid. The cluster state has a density phase separation into high and low density regions; however, there is no segregation of the two particle species, which distinguishes phase CL from the laning cluster phase V. At intermediate values of FD, the disordered flow phase III appears as shown in Fig. 7(c) for ϕ = 0.182 and FD = 3.0. The larger FD value tears apart the cluster state for ϕ > 0.4, producing in its place a disordered phase III flow with some residual clustering, as illustrated in Fig. 7(d) at ϕ = 0.6 and FD = 3.0. In Fig. 7(e,f) we show the FD=12.5 states at ϕ = 0.182 and ϕ = 0.6, respectively. In both cases a laning cluster phase V appears, producing the higher values of P6 found in Fig. 6. Phase V persists all the way down to ϕ = 0.06 for this high drive; however, at the smaller values of ϕ the phase separated regions become more one-dimensional in nature, so P6 remains low due to the smaller coordination number of the particles in these chain-like structures. Based on the features in Fig. 7 along with additional simulation data, we construct a dynamic phase diagram as a function of ϕ versus FD for τ = 3.2 ×10⁵ as shown in Fig. 8. This result suggests that the introduction of driving can break up the clusters that form due to activity-induced density segregation; however, for large enough driving, a new type of clustering instability can arise. Application of a shear instead of a dc drive could produce effects different than what we find here.
Fig8.png
Figure 8: Dynamic phase diagram as a function of ϕ vs FD for the system in Figs. 6 and 7 at τ = 3.2 ×10⁵. At small FD, there is a transition from phase III to a cluster state CL with increasing ϕ, while large drives can produce phase V.
Fig9.png
Figure 9: Dynamic phase diagram as a function of ϕ vs FD at τ = 500 showing phases III and IV.
Fig10.png
Figure 10: A comparison of the instantaneous particle configurations of the σi=+1 (blue) and σi=−1 (red) run-and-tumble particles for the systems in Figs. 8 and 9 at FD=12.5. (a,b) ϕ = 0.848: (a) The laning phase IV for the system in Fig. 9 with τ = 500. (b) The laning clustered phase V for the system in Fig. 8 with τ = 3.2 ×10⁵. (c,d) ϕ = 0.303: (c) A laning phase IV without triangular ordering for the system in Fig. 9 with τ = 500. (d) The laning clustered phase V for the system in Fig. 8 with τ = 3.2 ×10⁵.
In Fig. 9 we plot a dynamic phase diagram as a function of FD vs ϕ for a small run time of τ = 500. In this case, neither phase CL nor phase V appear. In Fig. 10(a) we illustrate the instantaneous particle configuration in the laning phase IV for the system in Fig. 9 at FD = 12.5, ϕ = 0.848, and τ = 500, At the same values of FD and ϕ but at τ = 3.2 ×10⁵ as in Fig. 8, Fig. 10(b) shows that the system forms a laning clustered state containing low density regions. At FD=12.5 and ϕ = 0.303, Fig. 10(c) indicates that the τ = 500 system from Fig. 9 enters a phase IV flow with no triangular ordering, while in Fig. 10(d), the τ = 3.2 ×10⁵ system from Fig. 8 forms the laning clustered phase V.
This system could also serve as a soft matter realization of certain types of social dynamics such as pedestrian flows, and could be used to study the transition from orderly laning flow to disordered or panic motion. In this context, if Phase III is identified as disorderly pedestrian flow and Phase IV as orderly flow, then our main conclusion would be that the activity timescale strongly influences the force required to approach the transition, as in Fig. 5, while further increasing an already large pedestrian density may not be such a significant factor, as in Fig. 9.
We note that the clustering transition which we observe has both similarities and differences from the motility-induced phase separation found in active matter systems without external driving. In each case, clustering occurs only when the activity is high enough; however, the clustering transition disappears at lower densities in the non-driven system [33,37], whereas in the driven system, the clustering can persist to very low densities.

V.  DENSE PHASE

Fig11.png
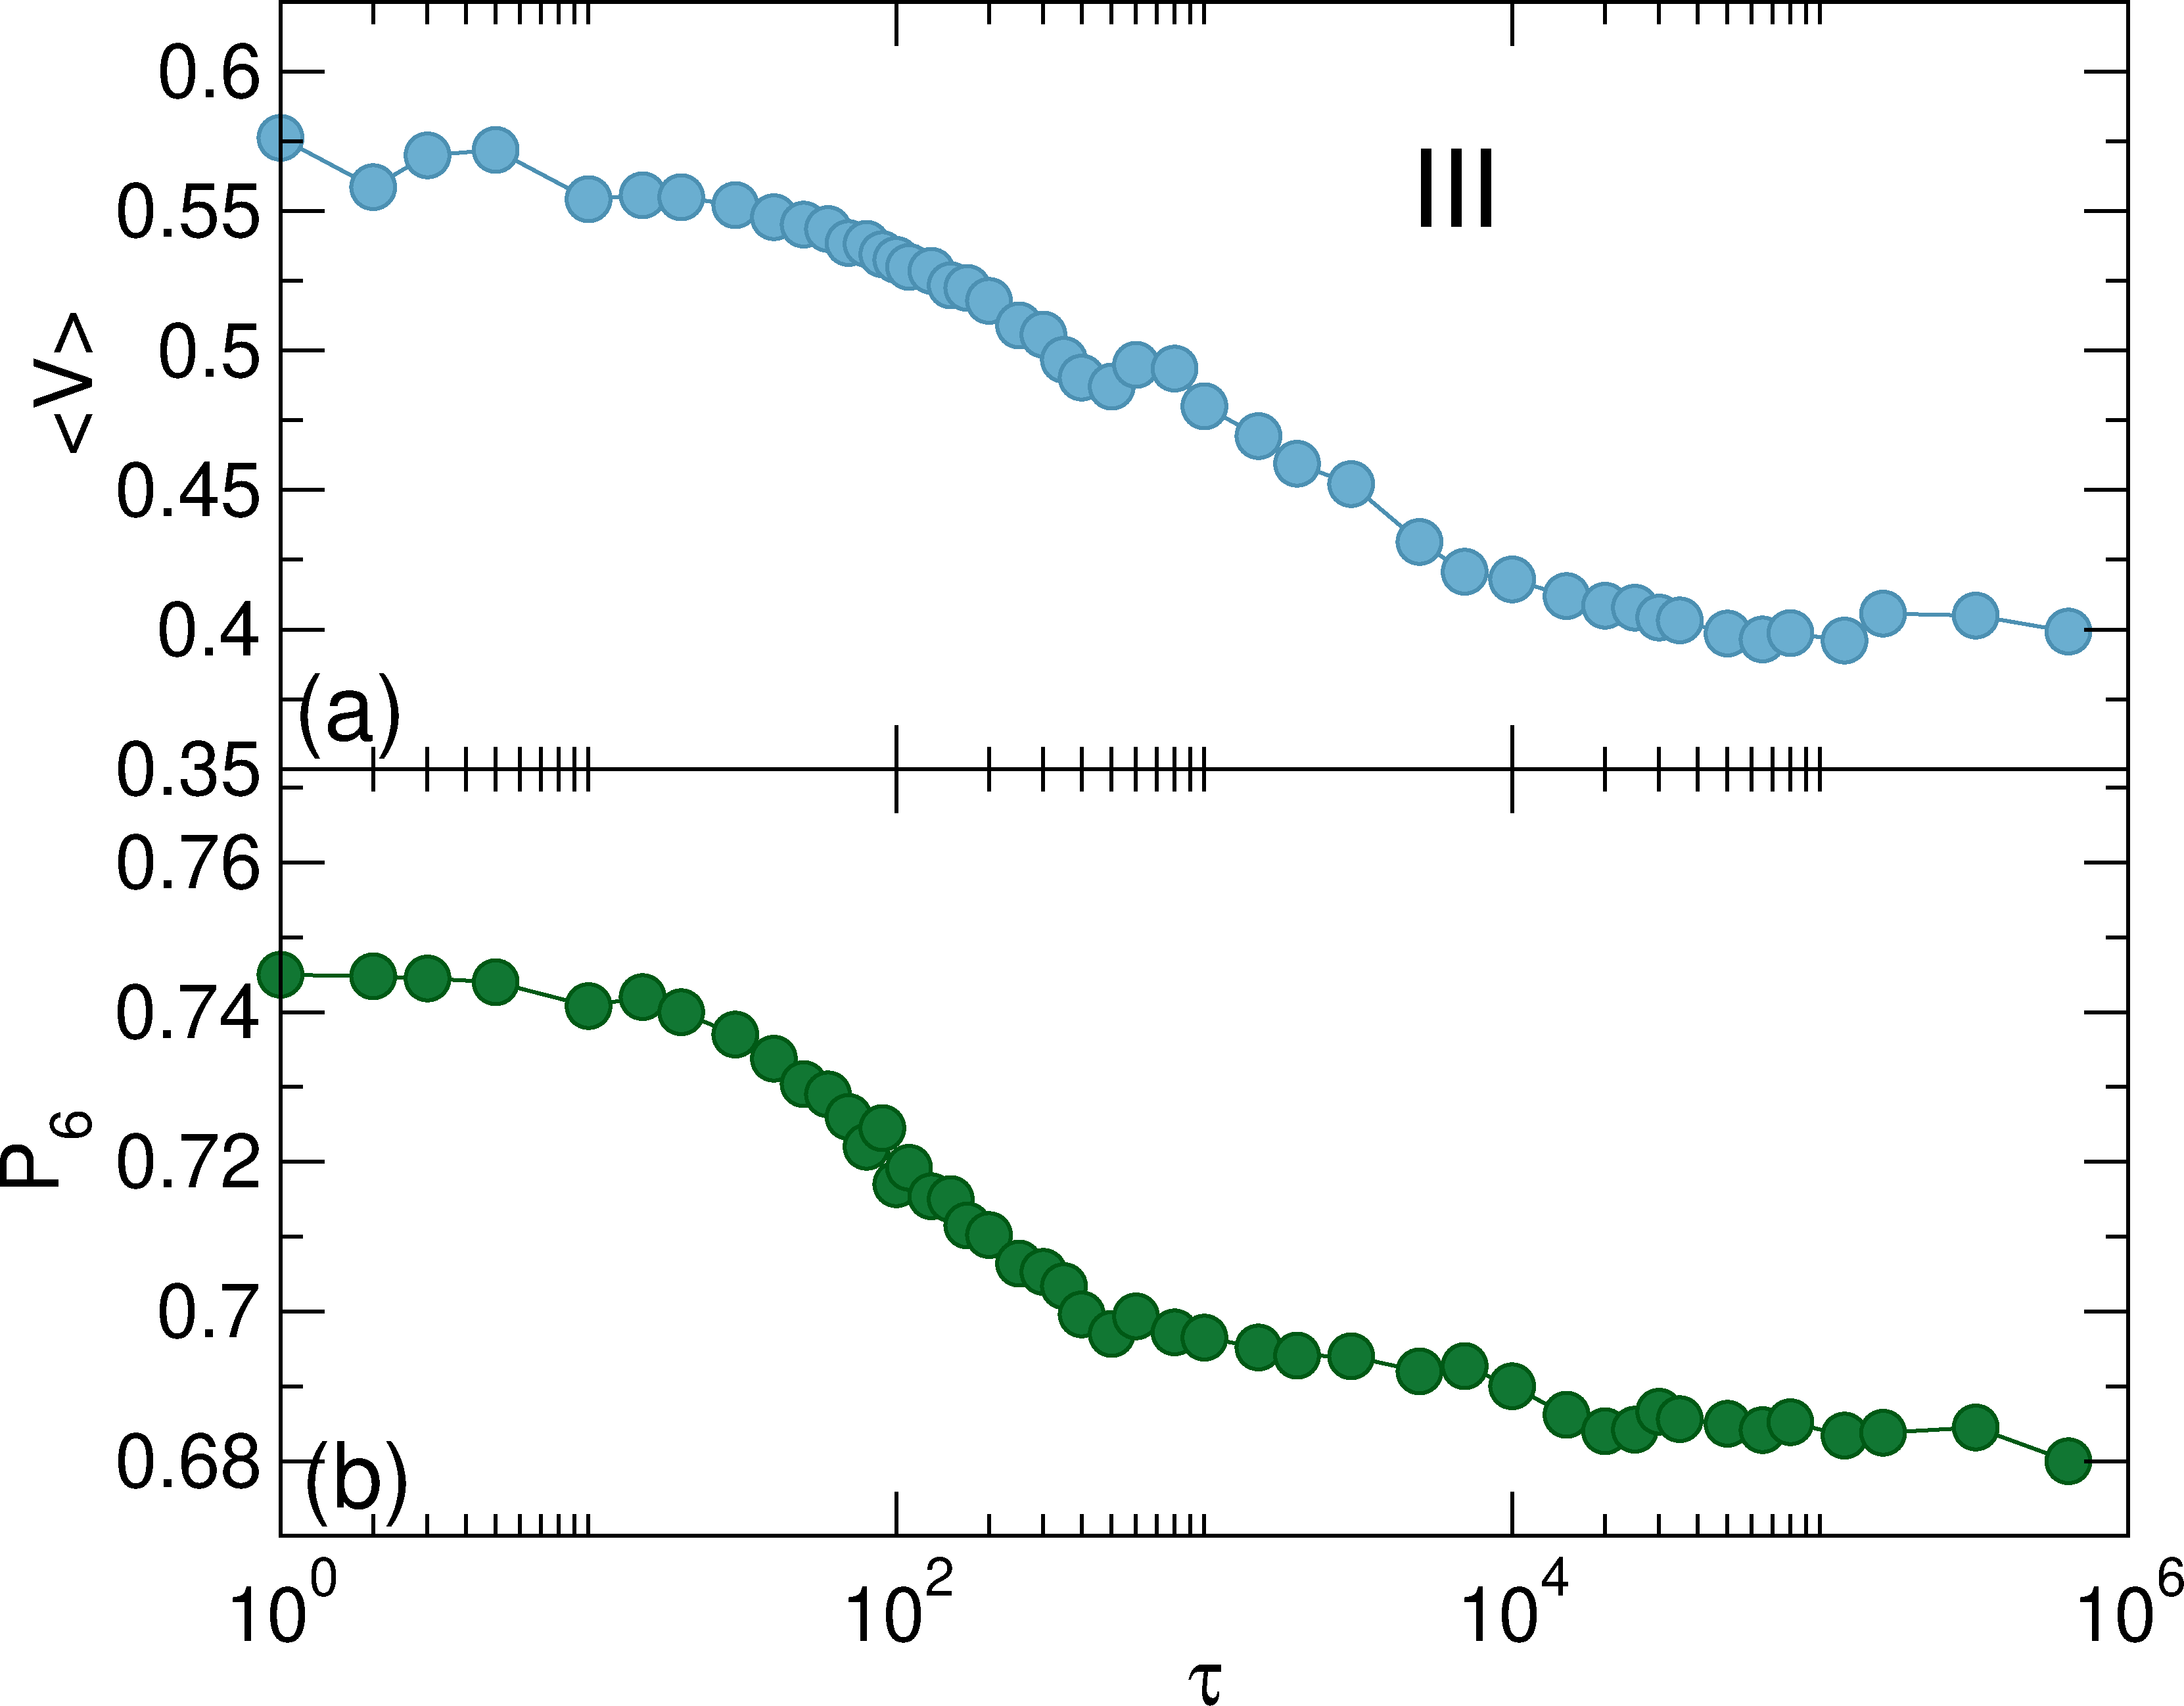
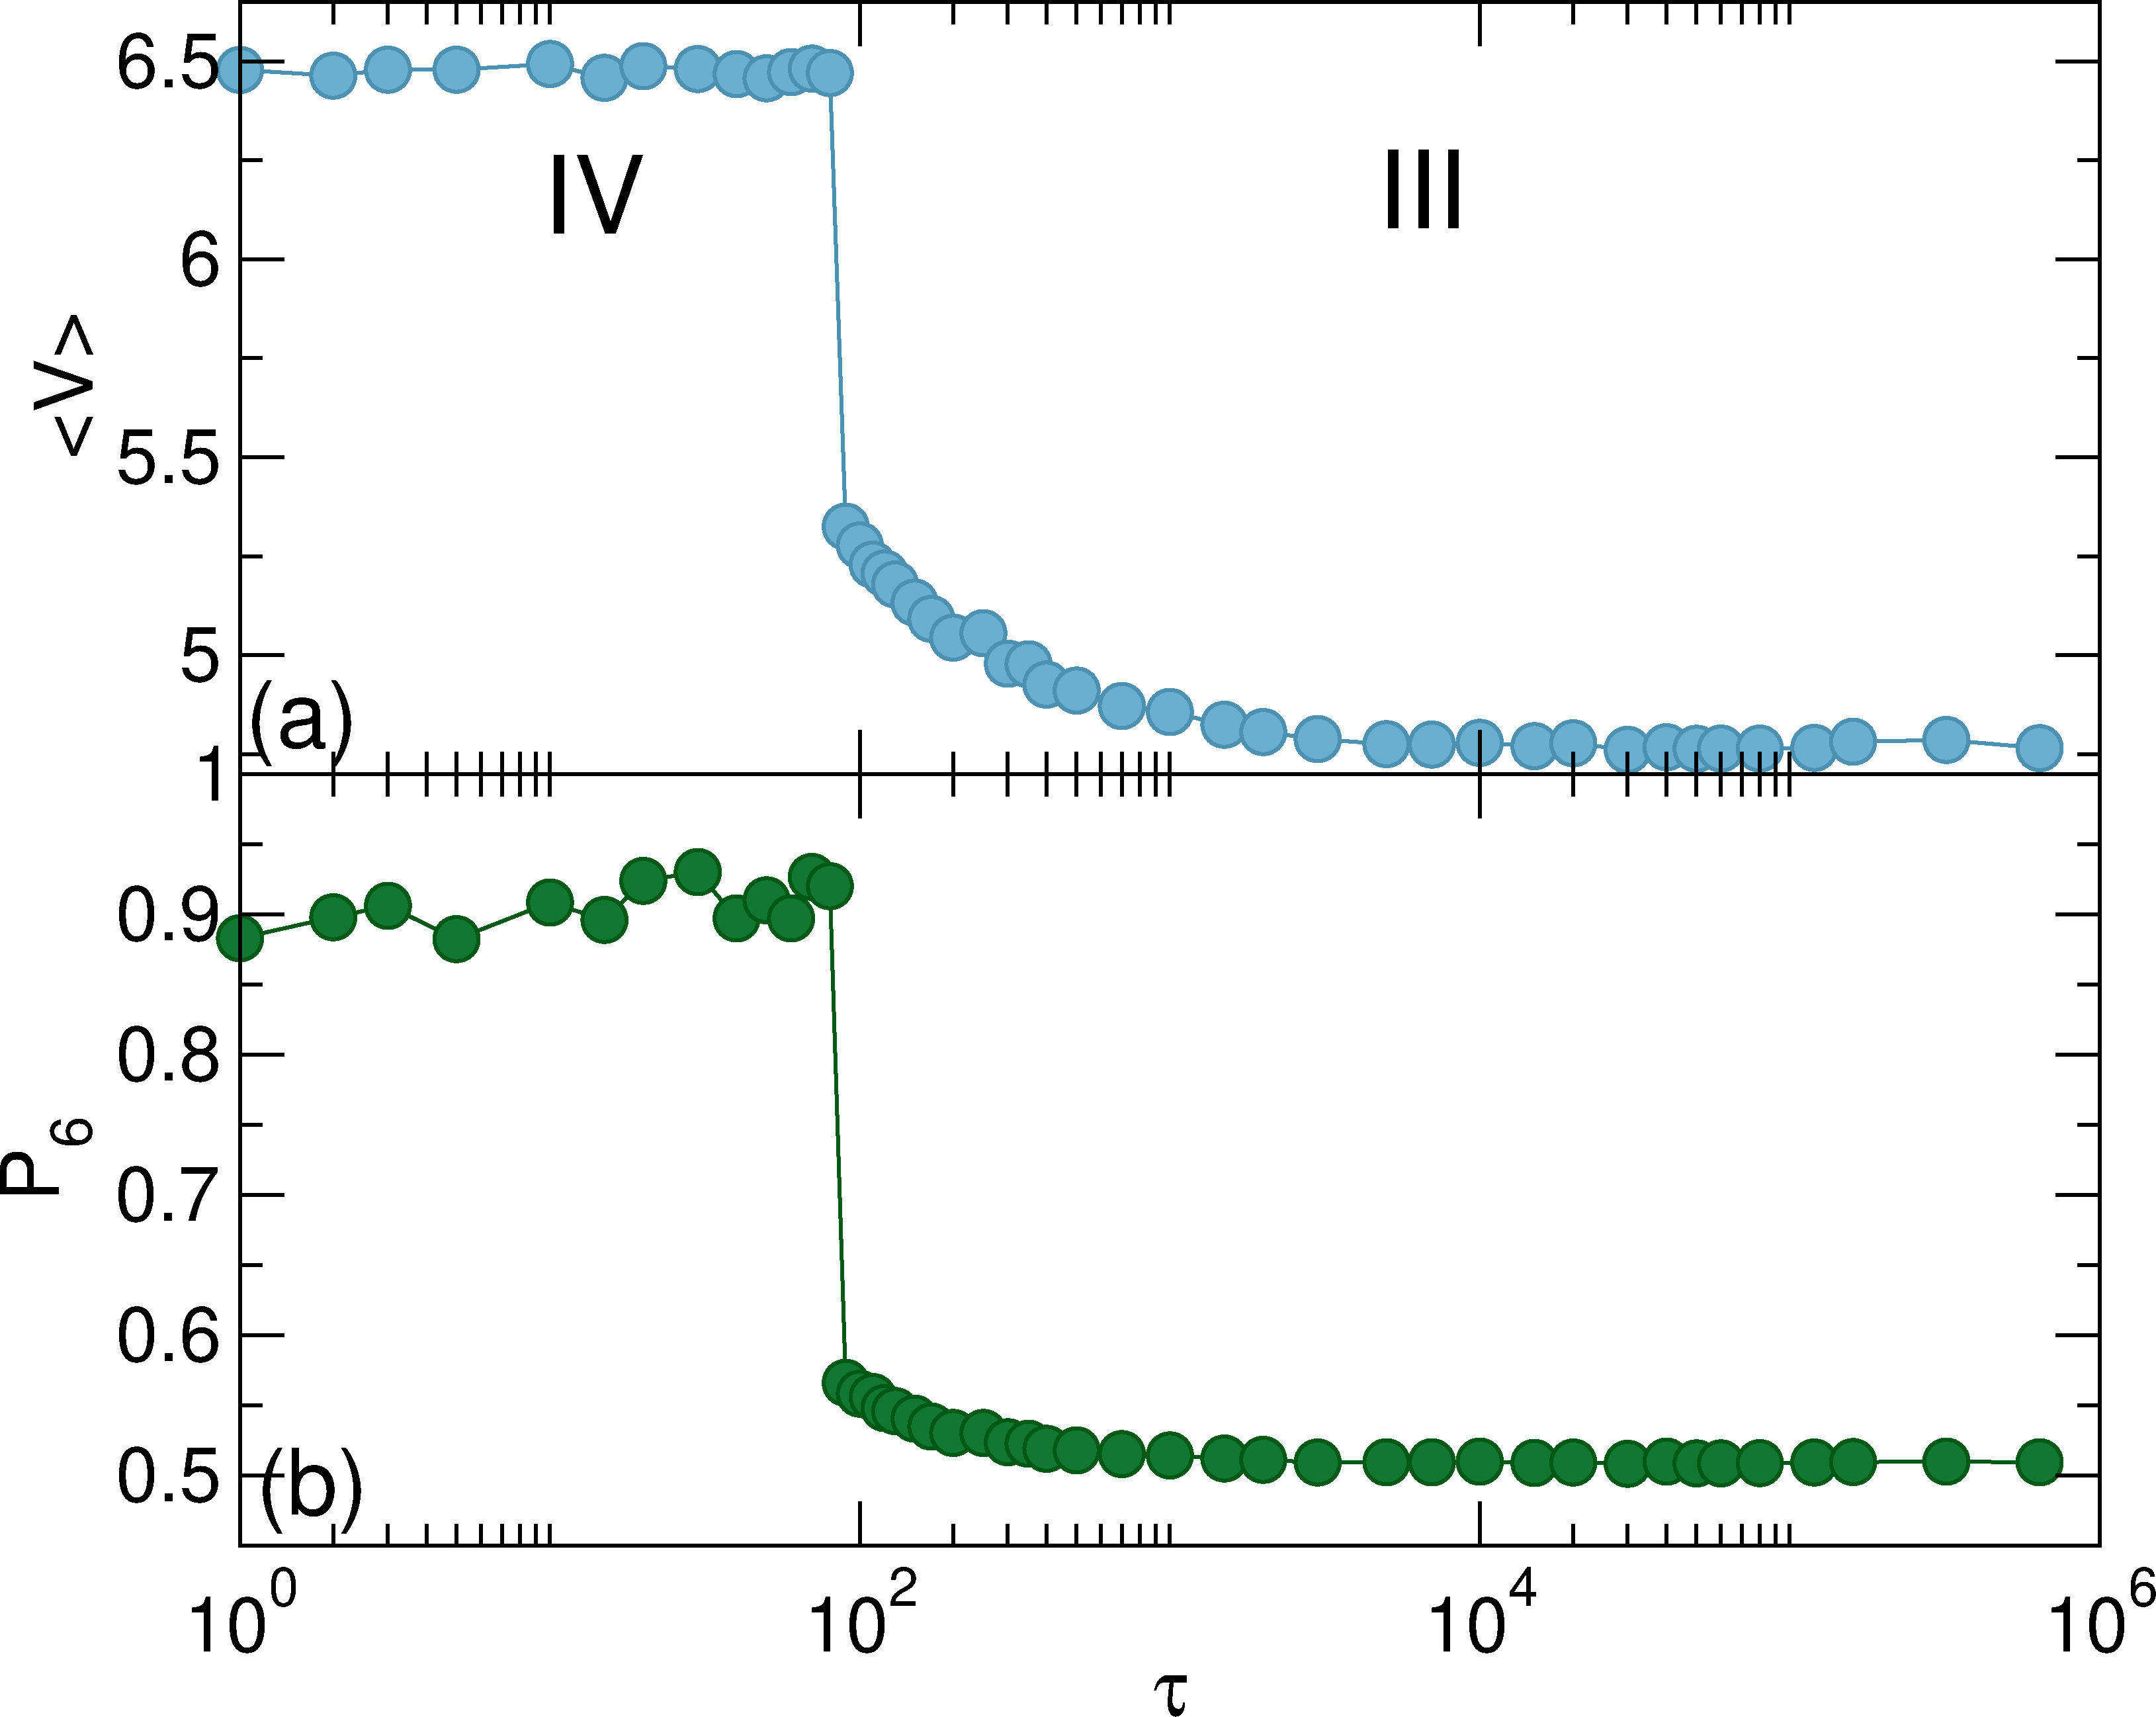
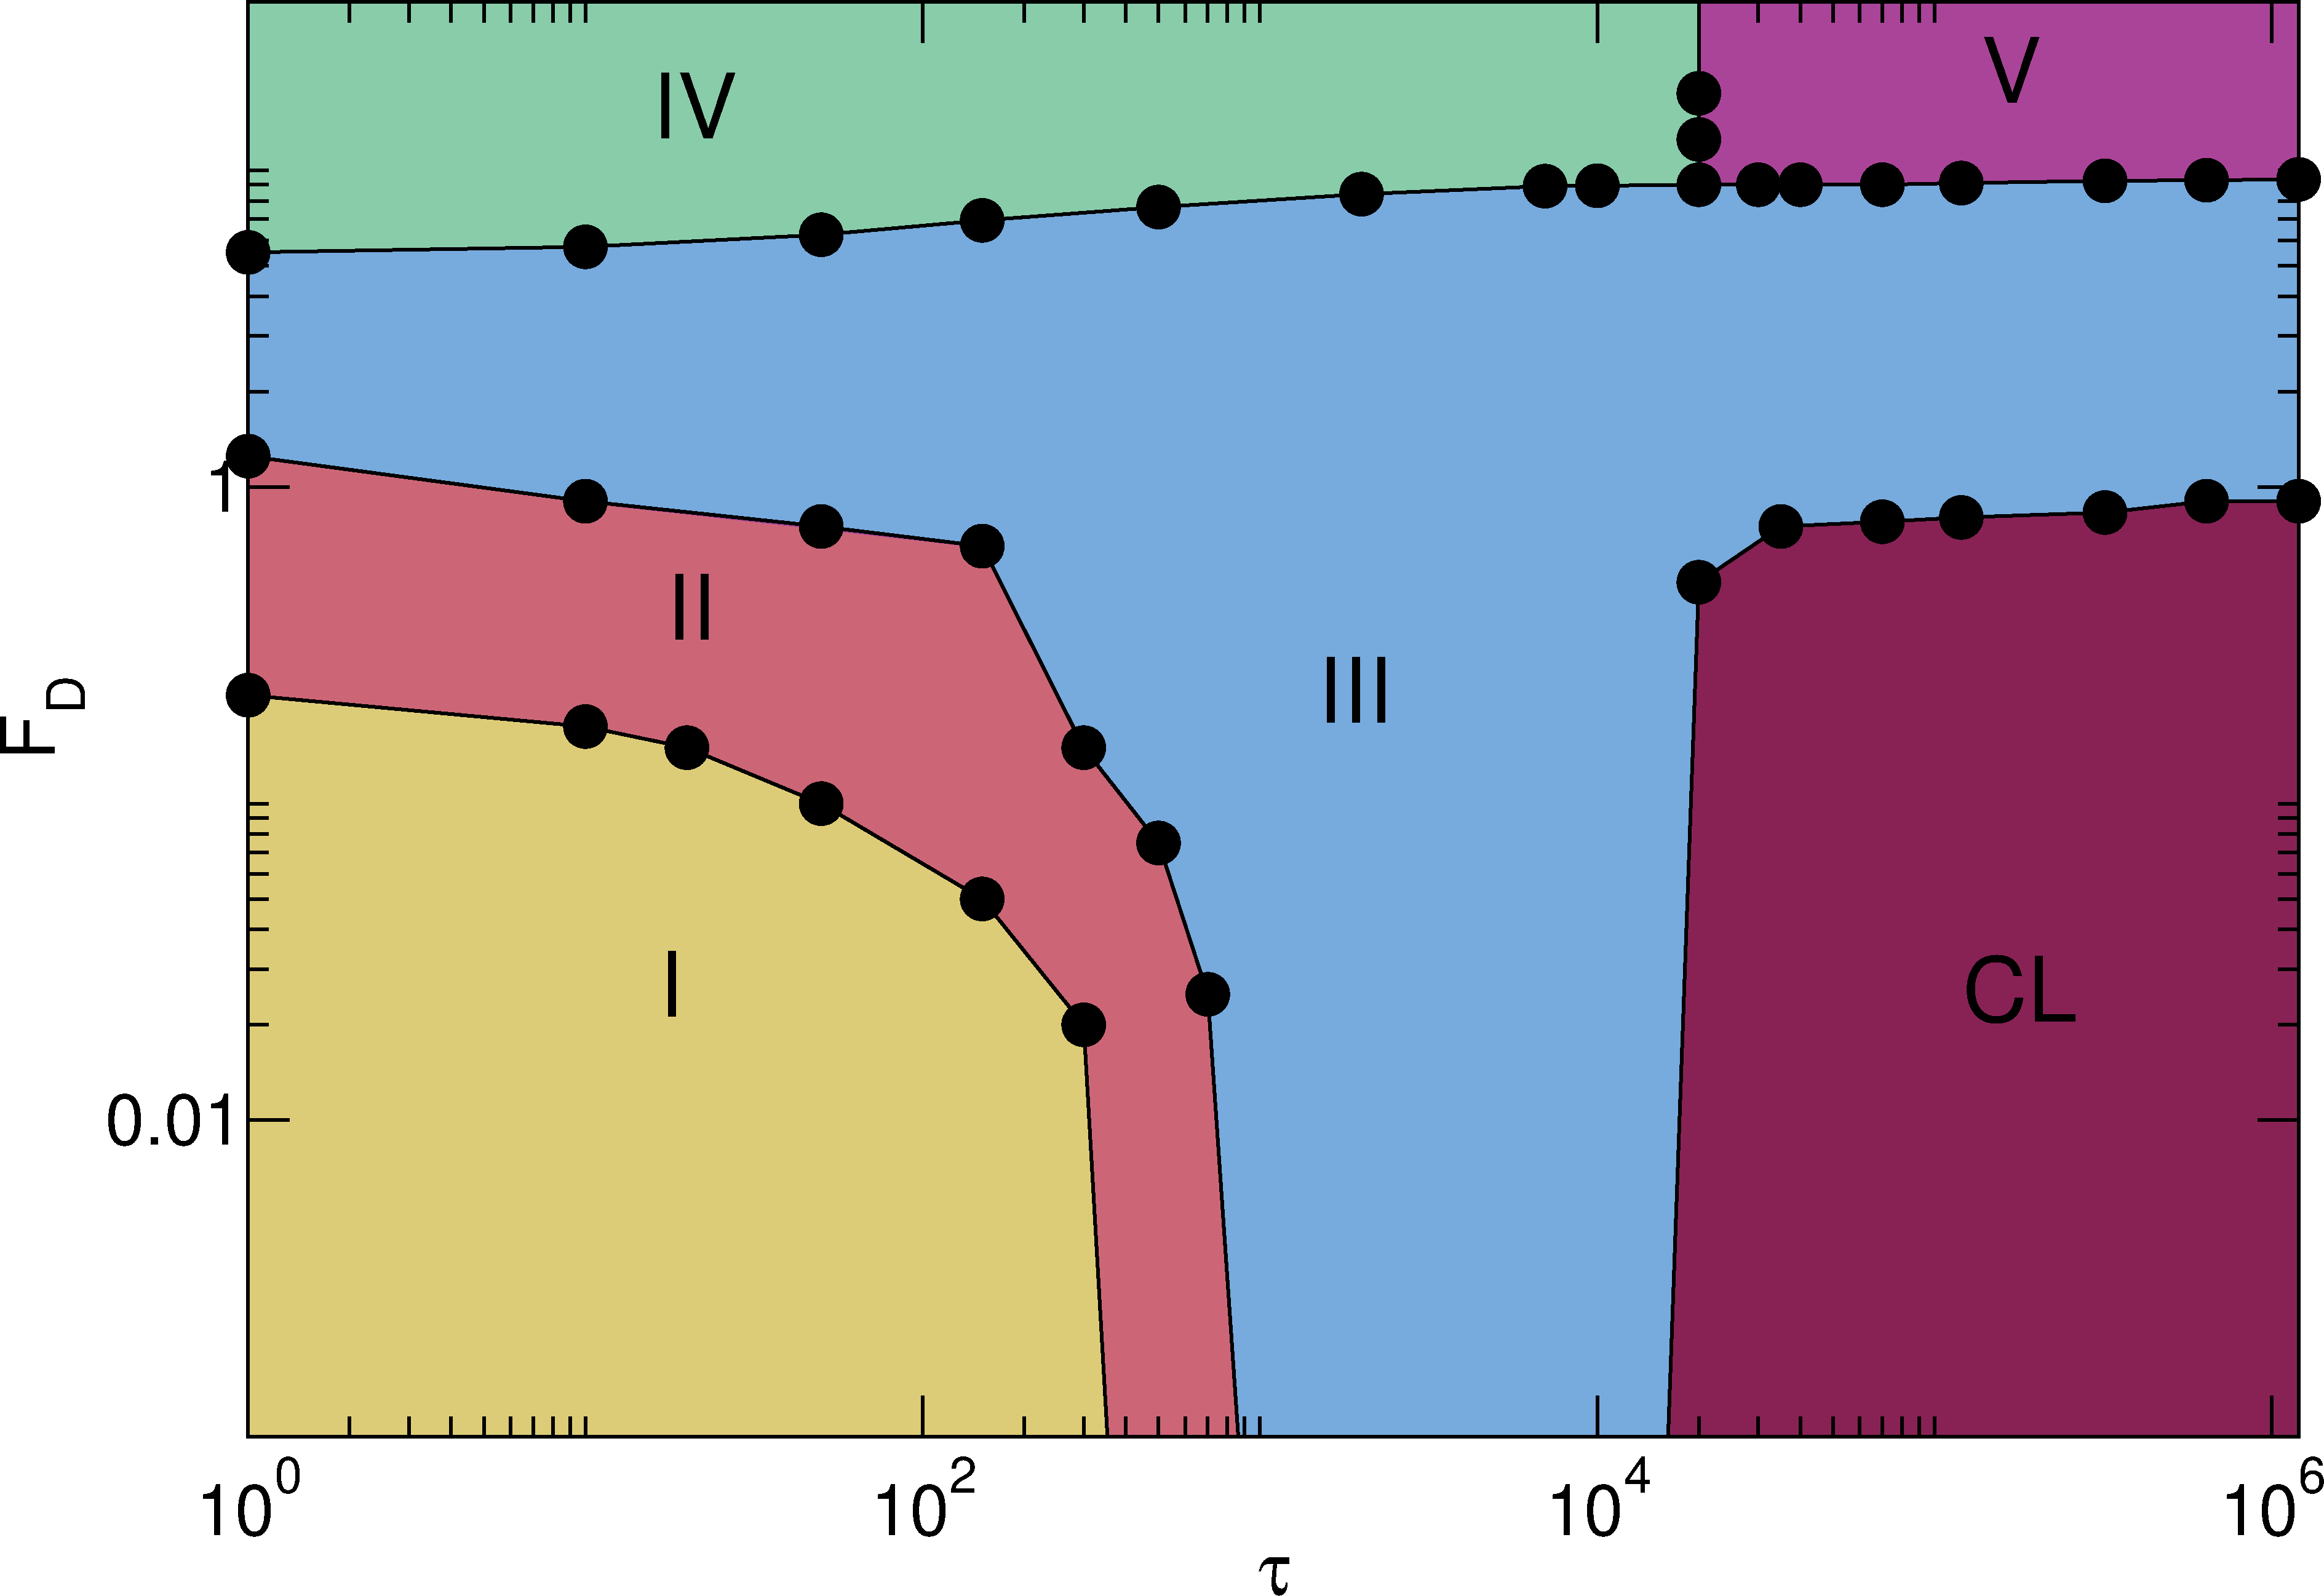
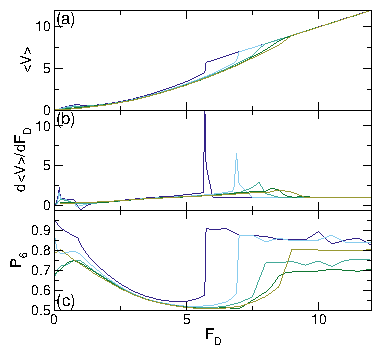
Figure 11: A system at ϕ = 0.848 with τ = 10 (dark blue), 150 (light blue), 500 (light green), 2000 (dark green), and 2 ×10⁴ (gold). (a) 〈V〉 vs FD. (b) dV〉/dFD vs FD. (c) P6 vs FD. 
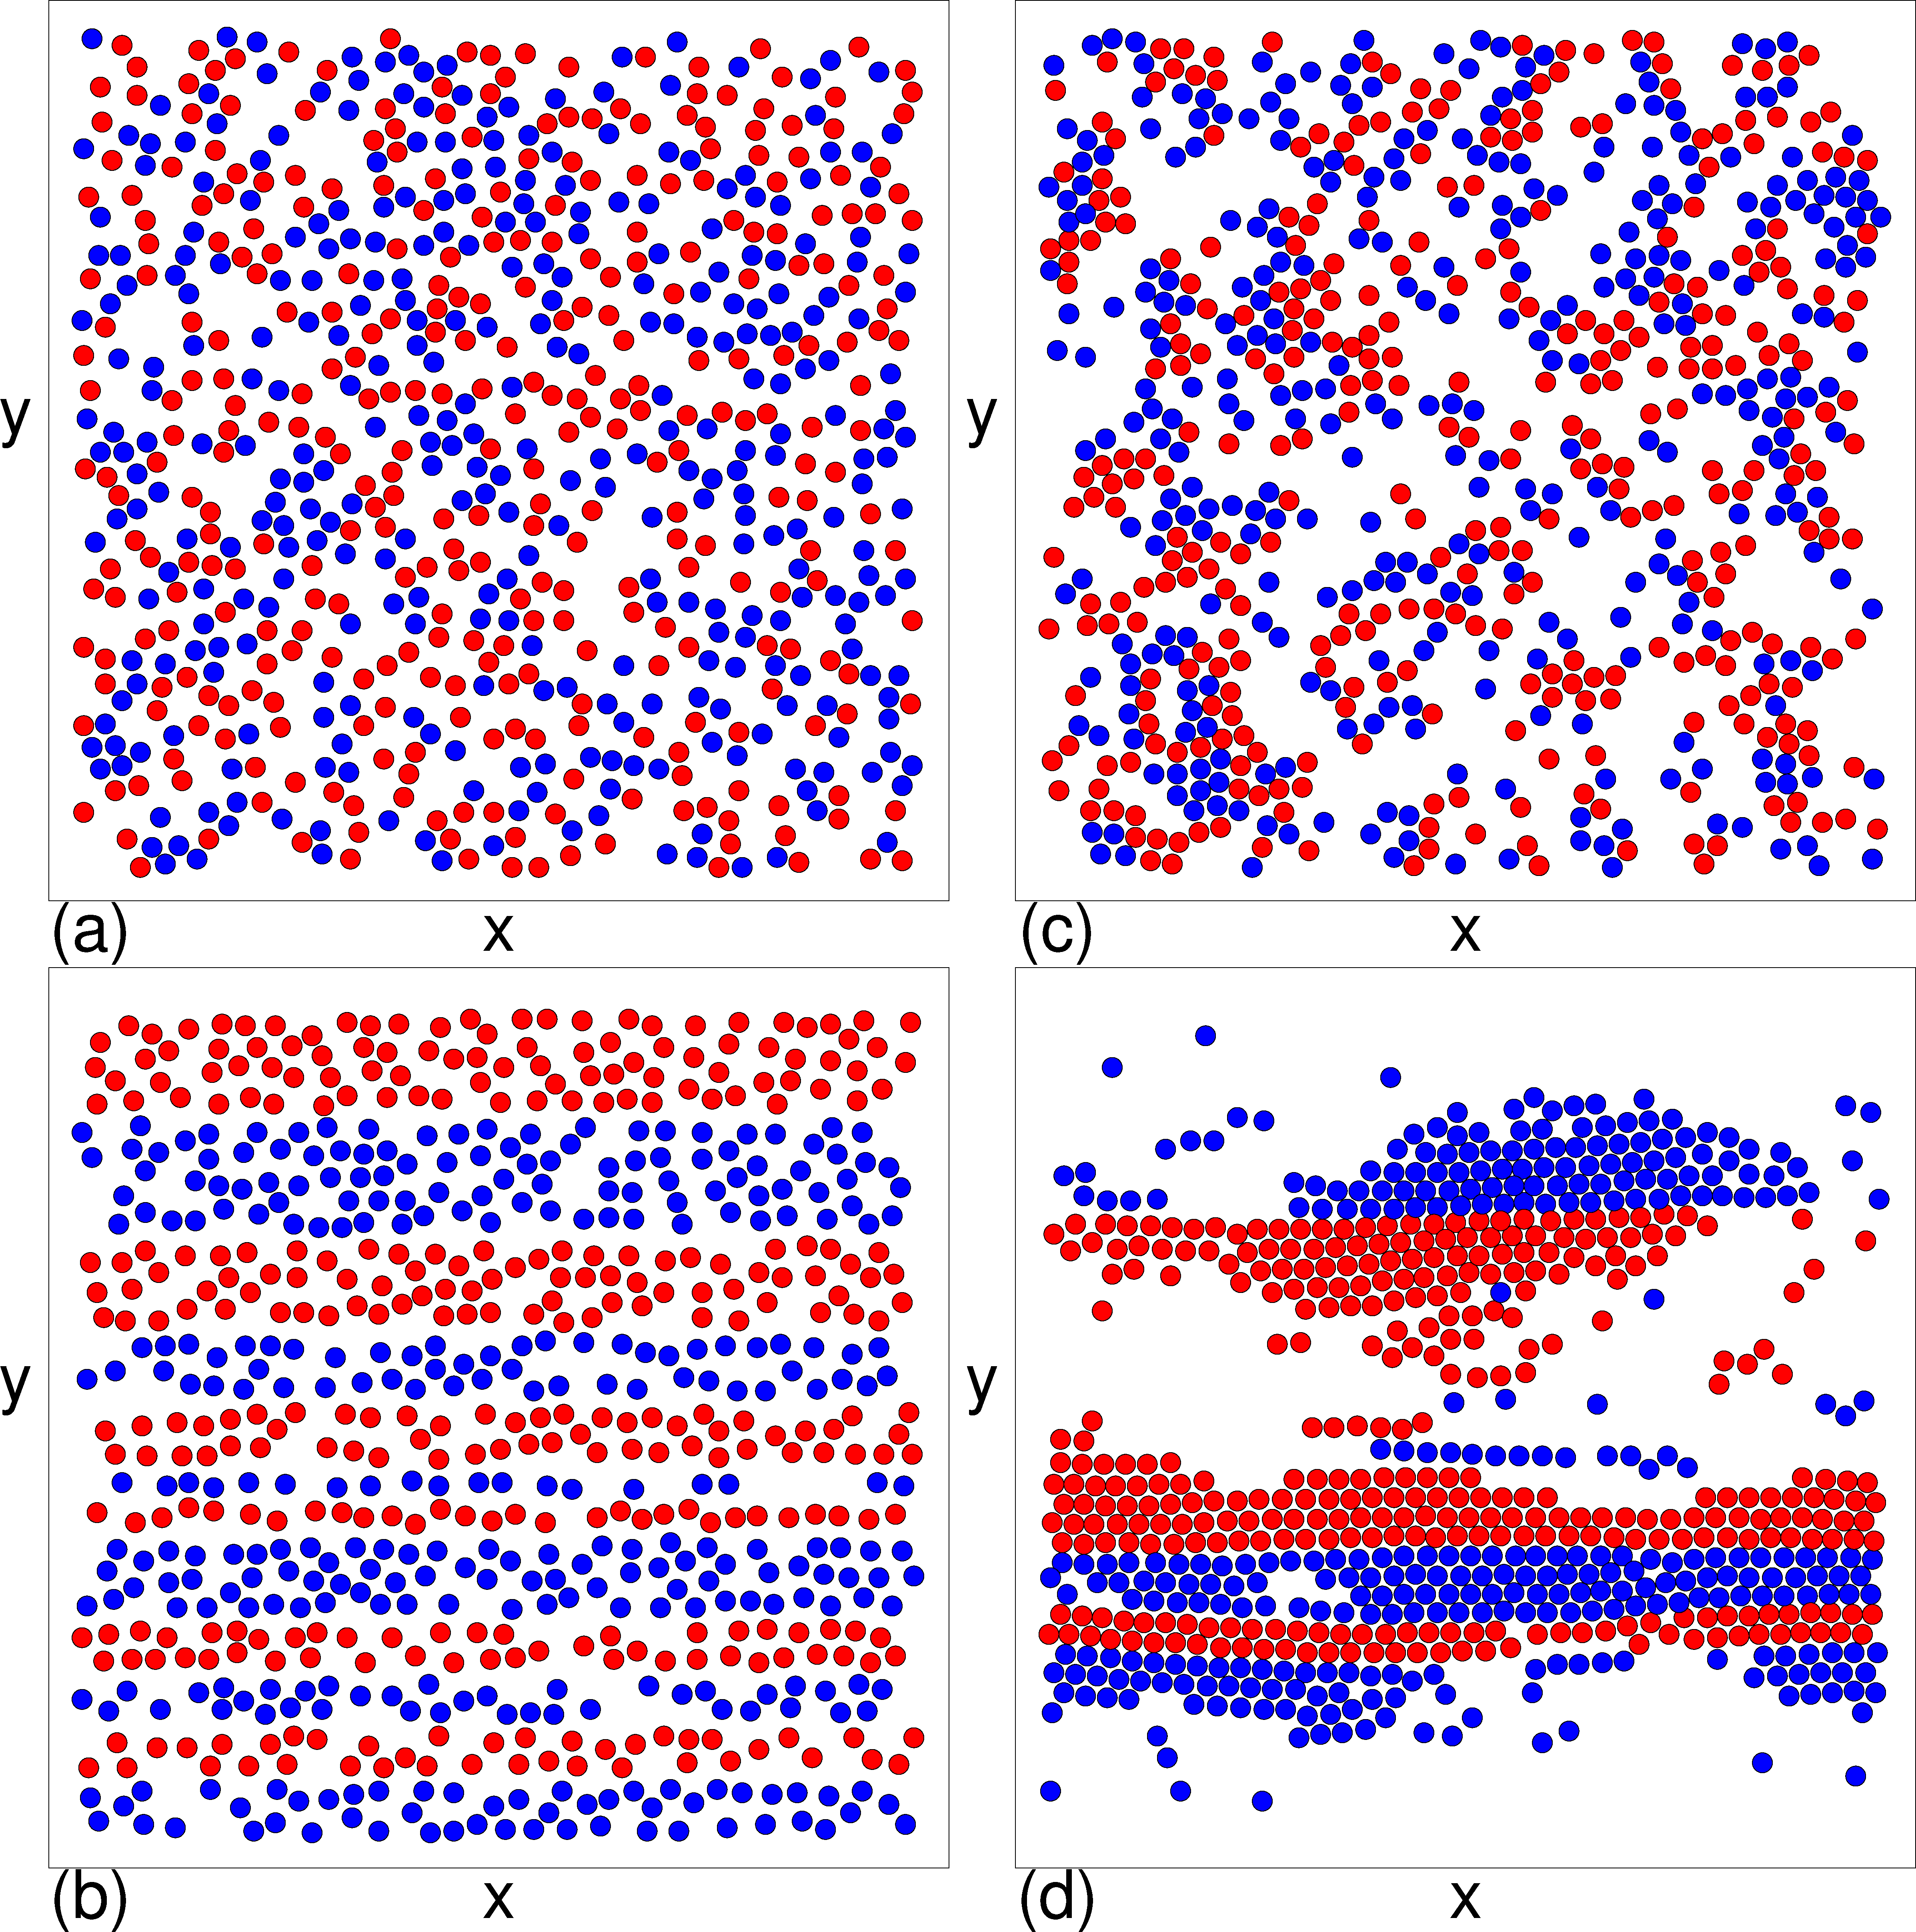
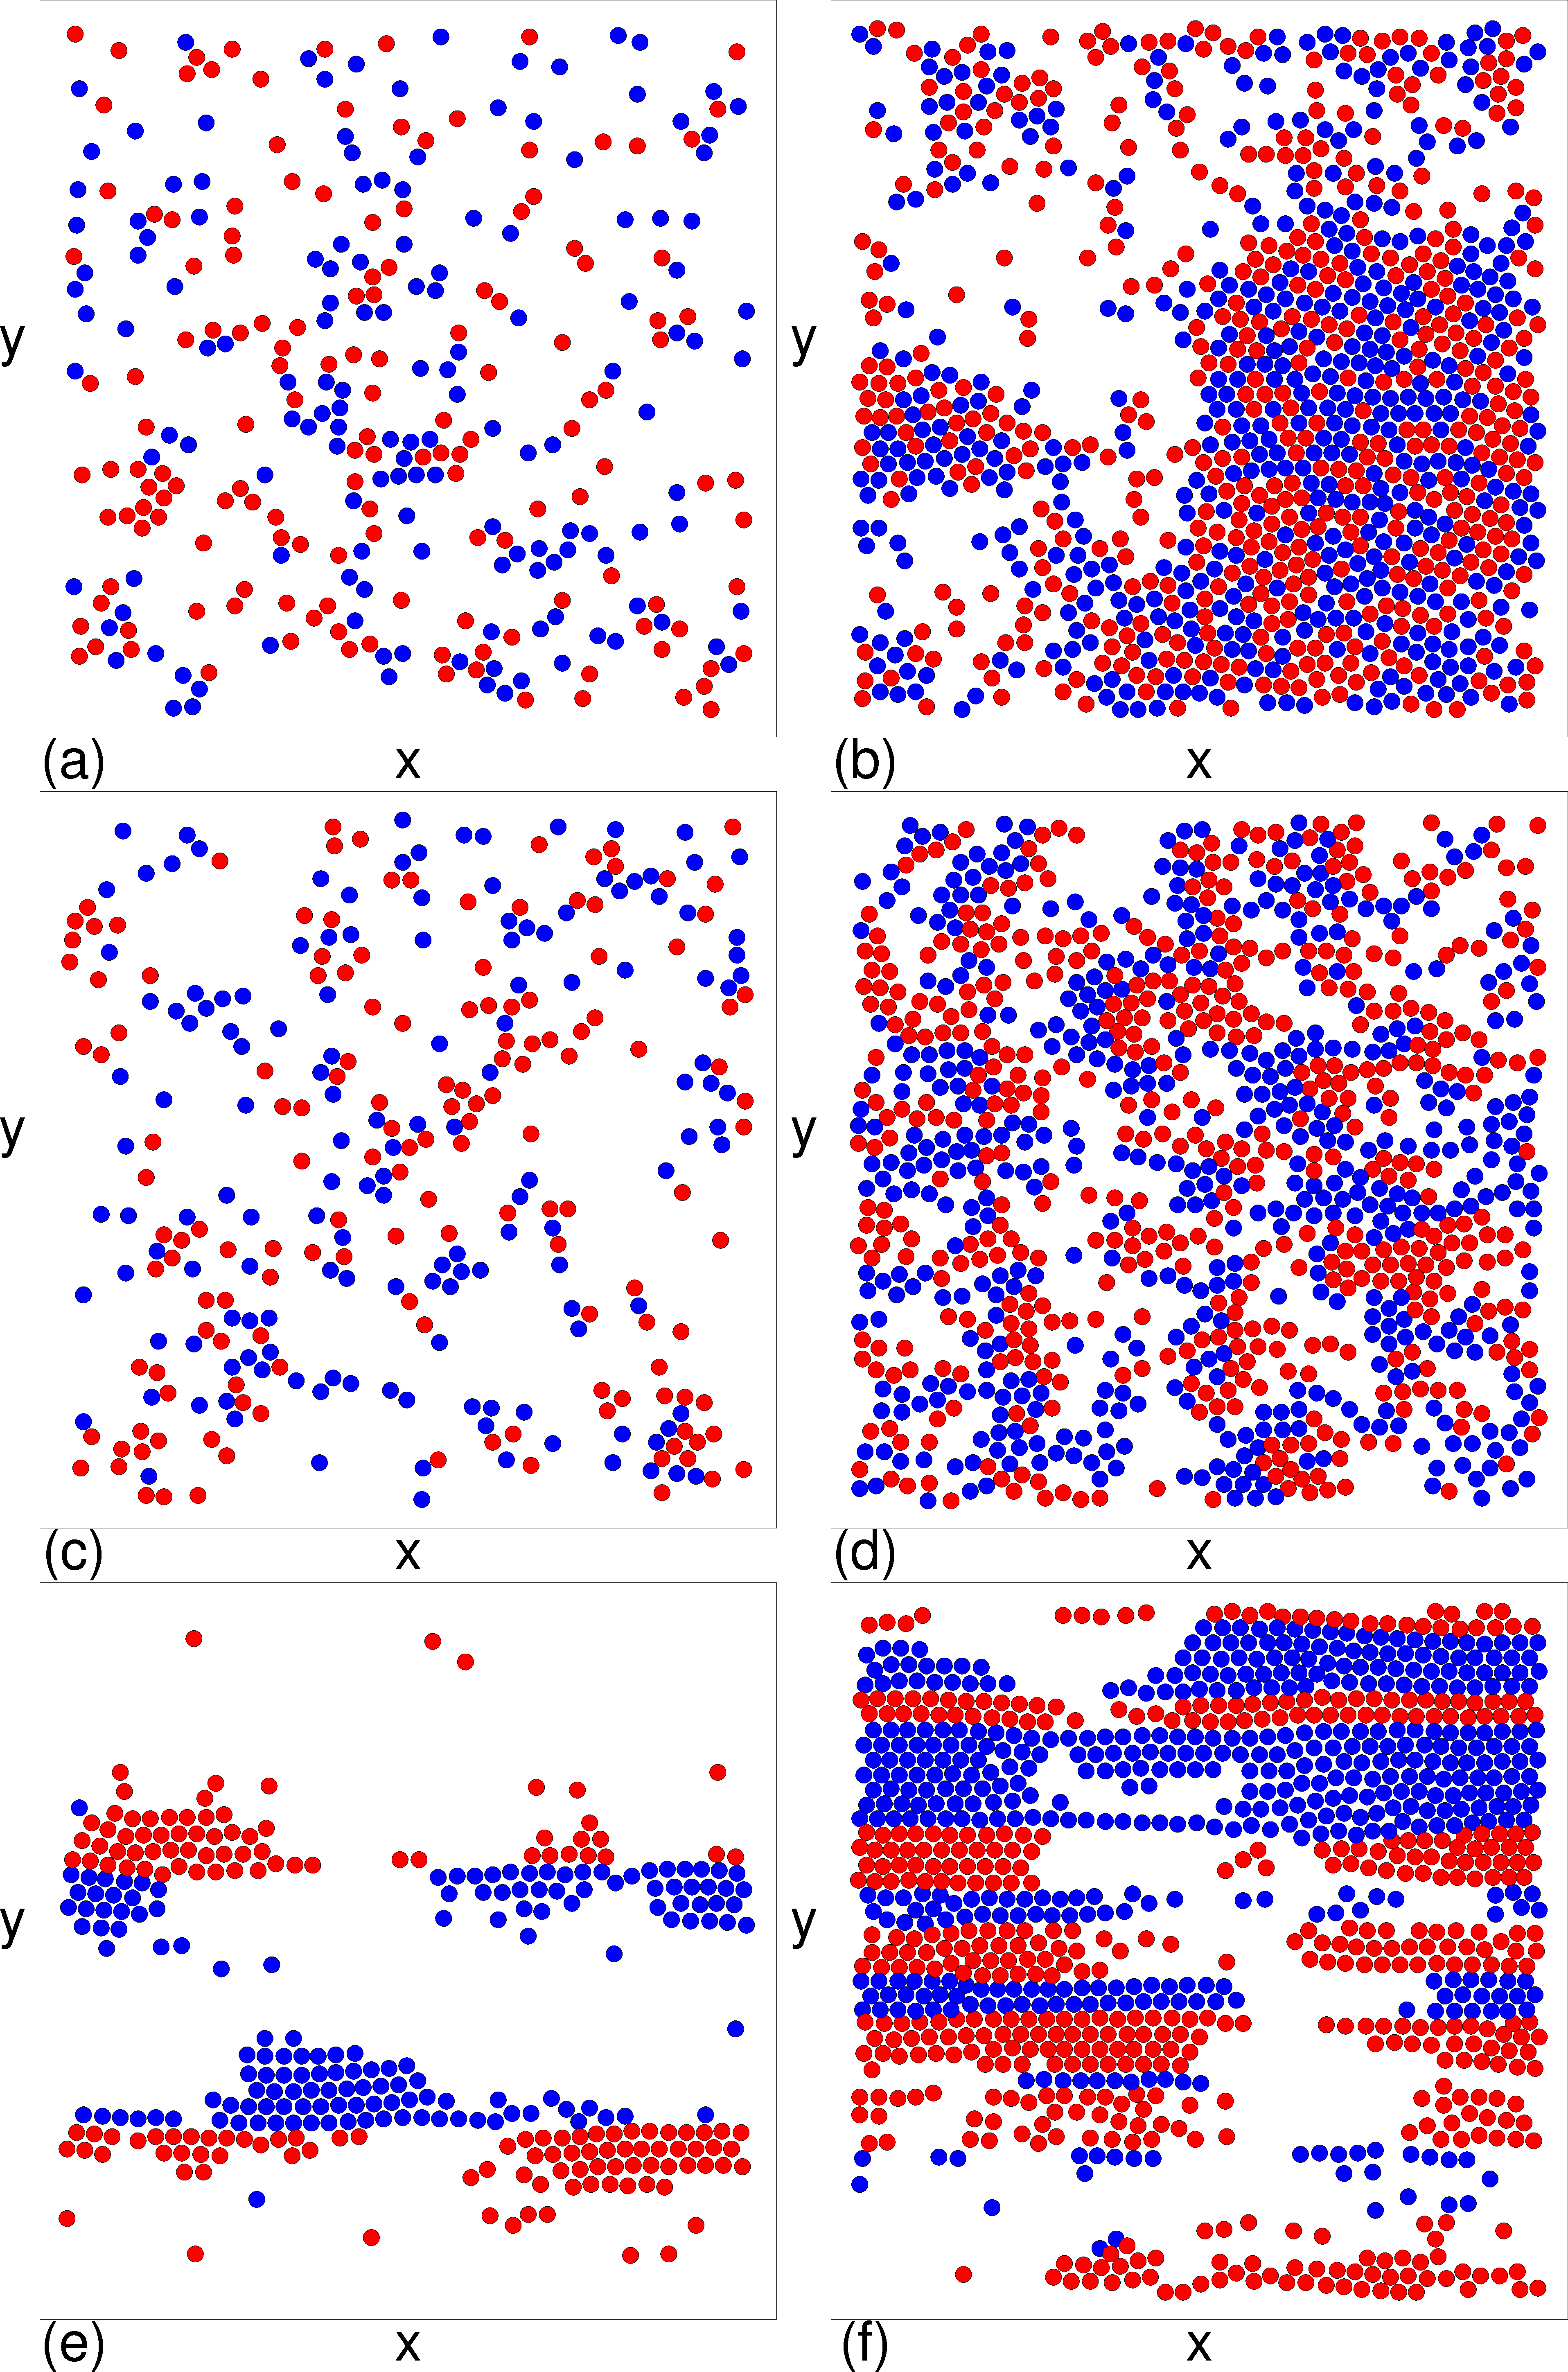
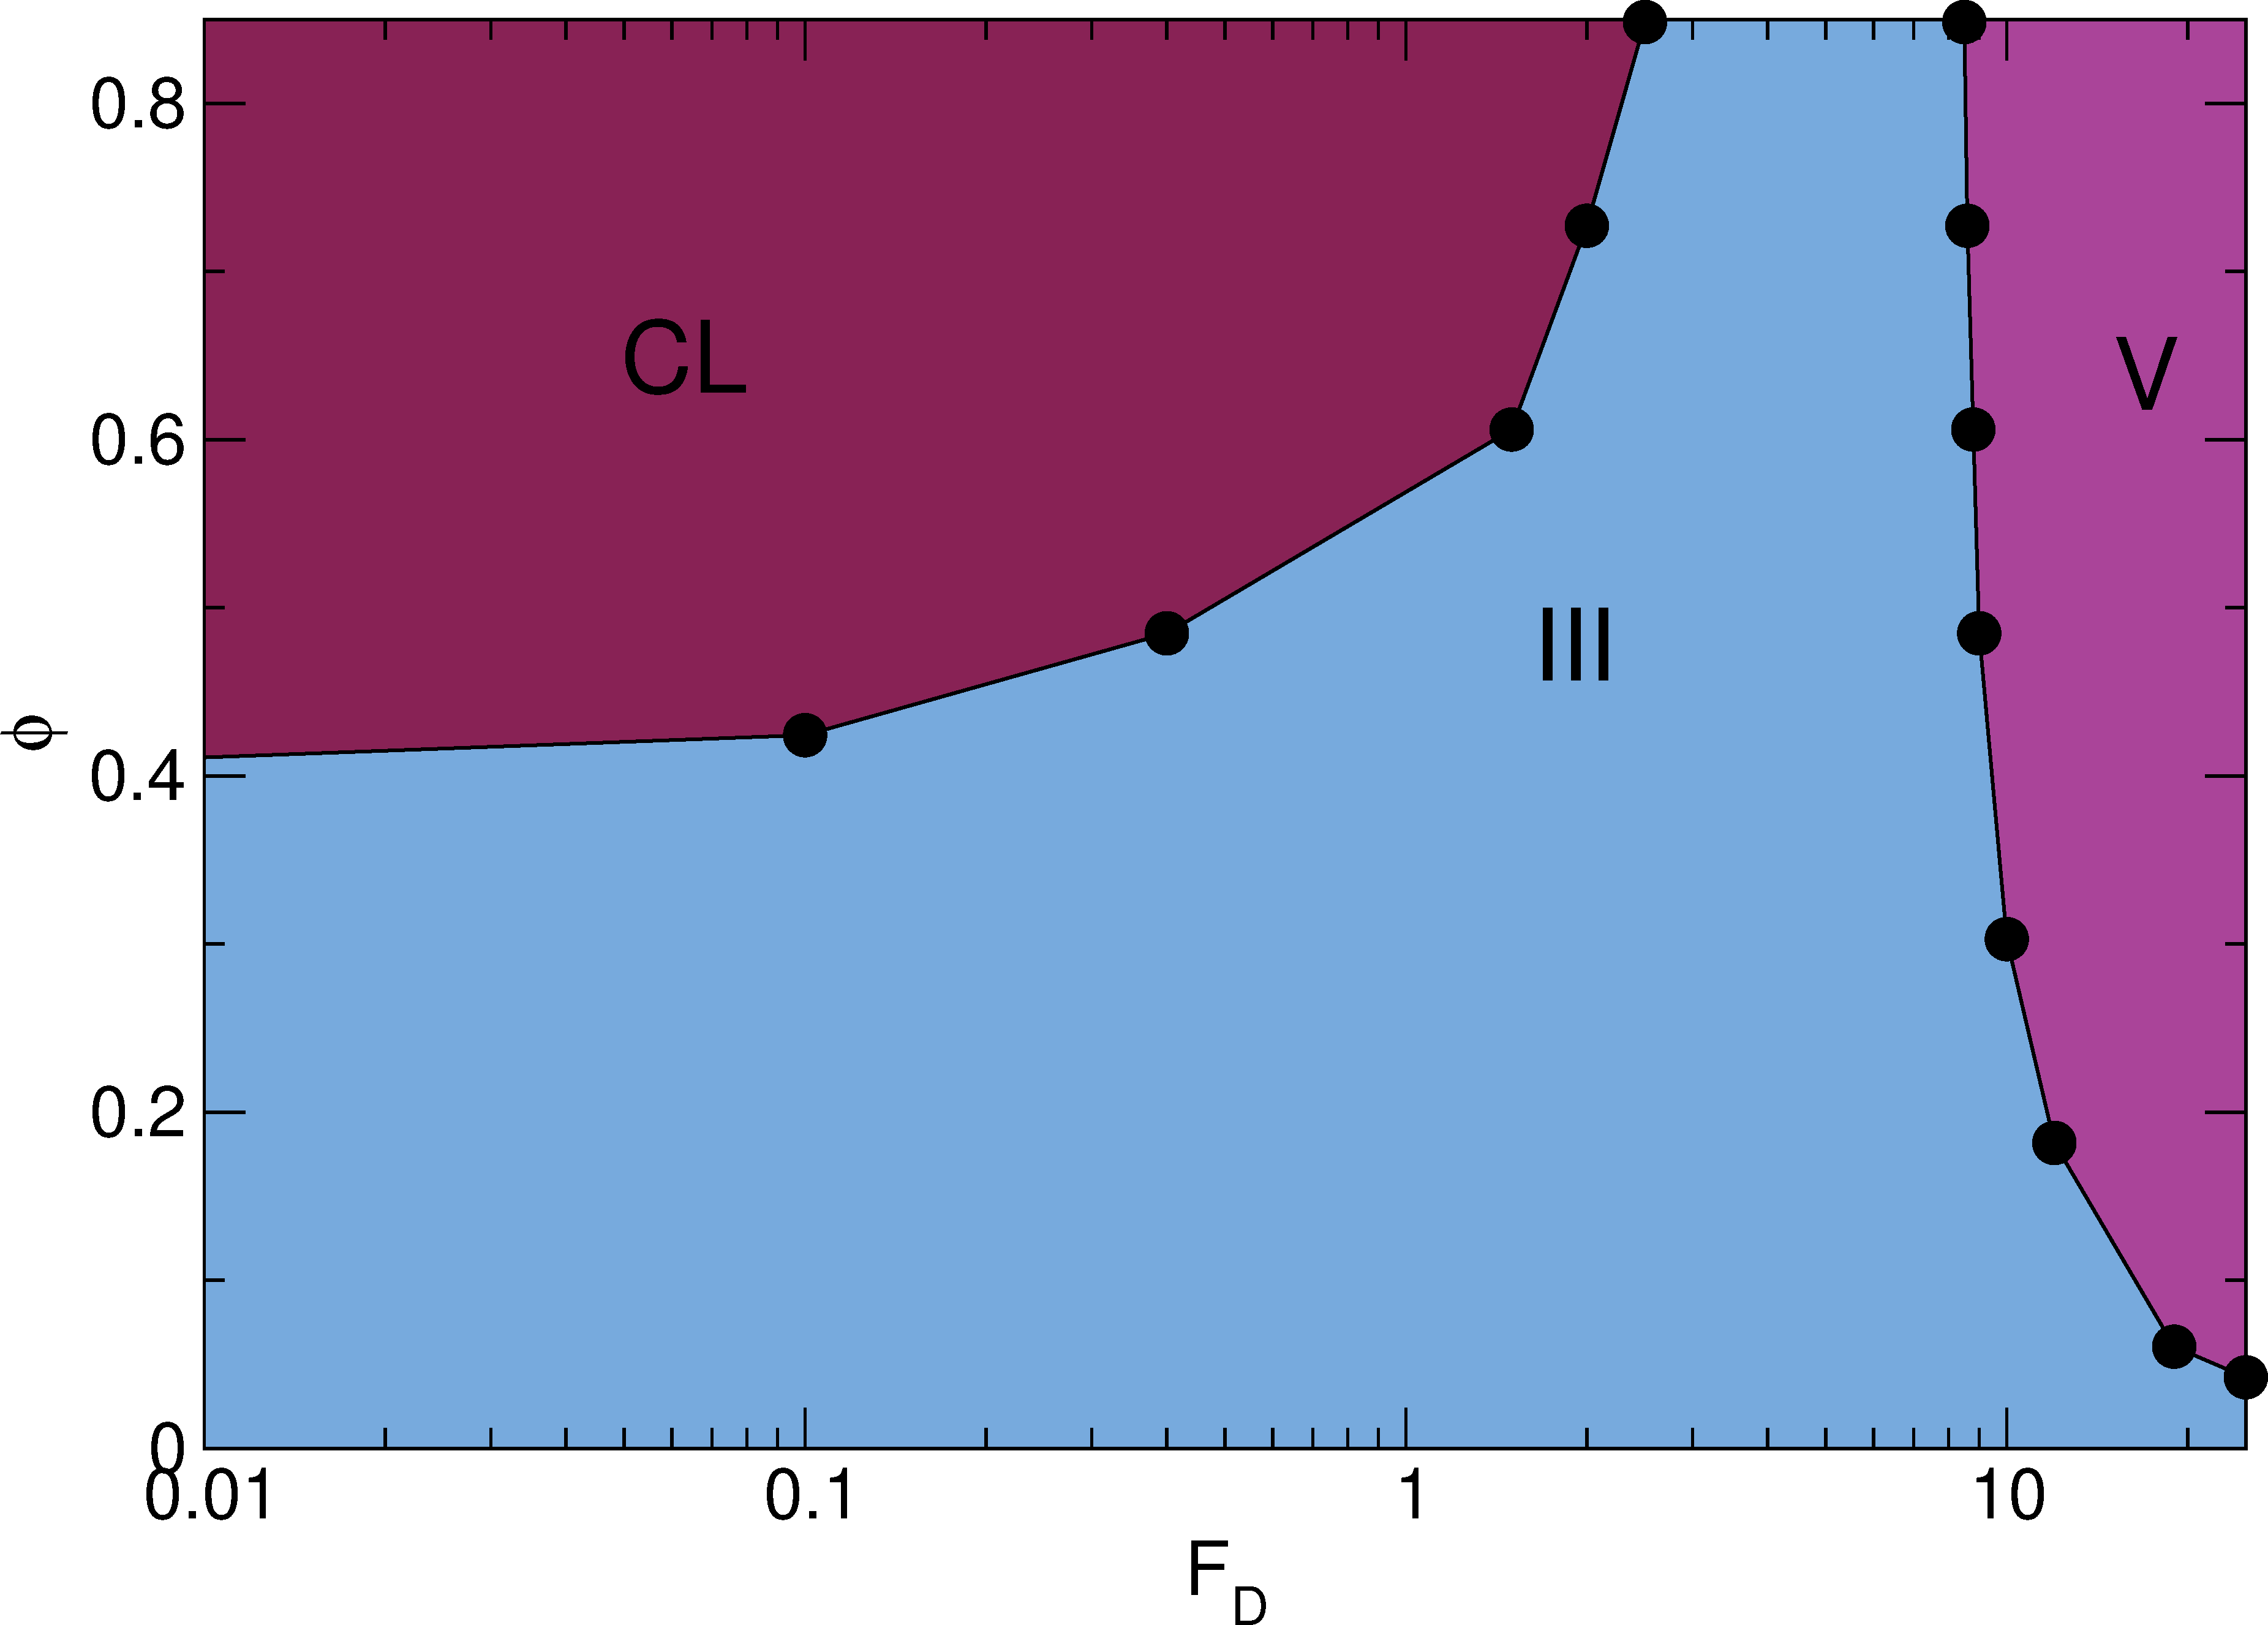
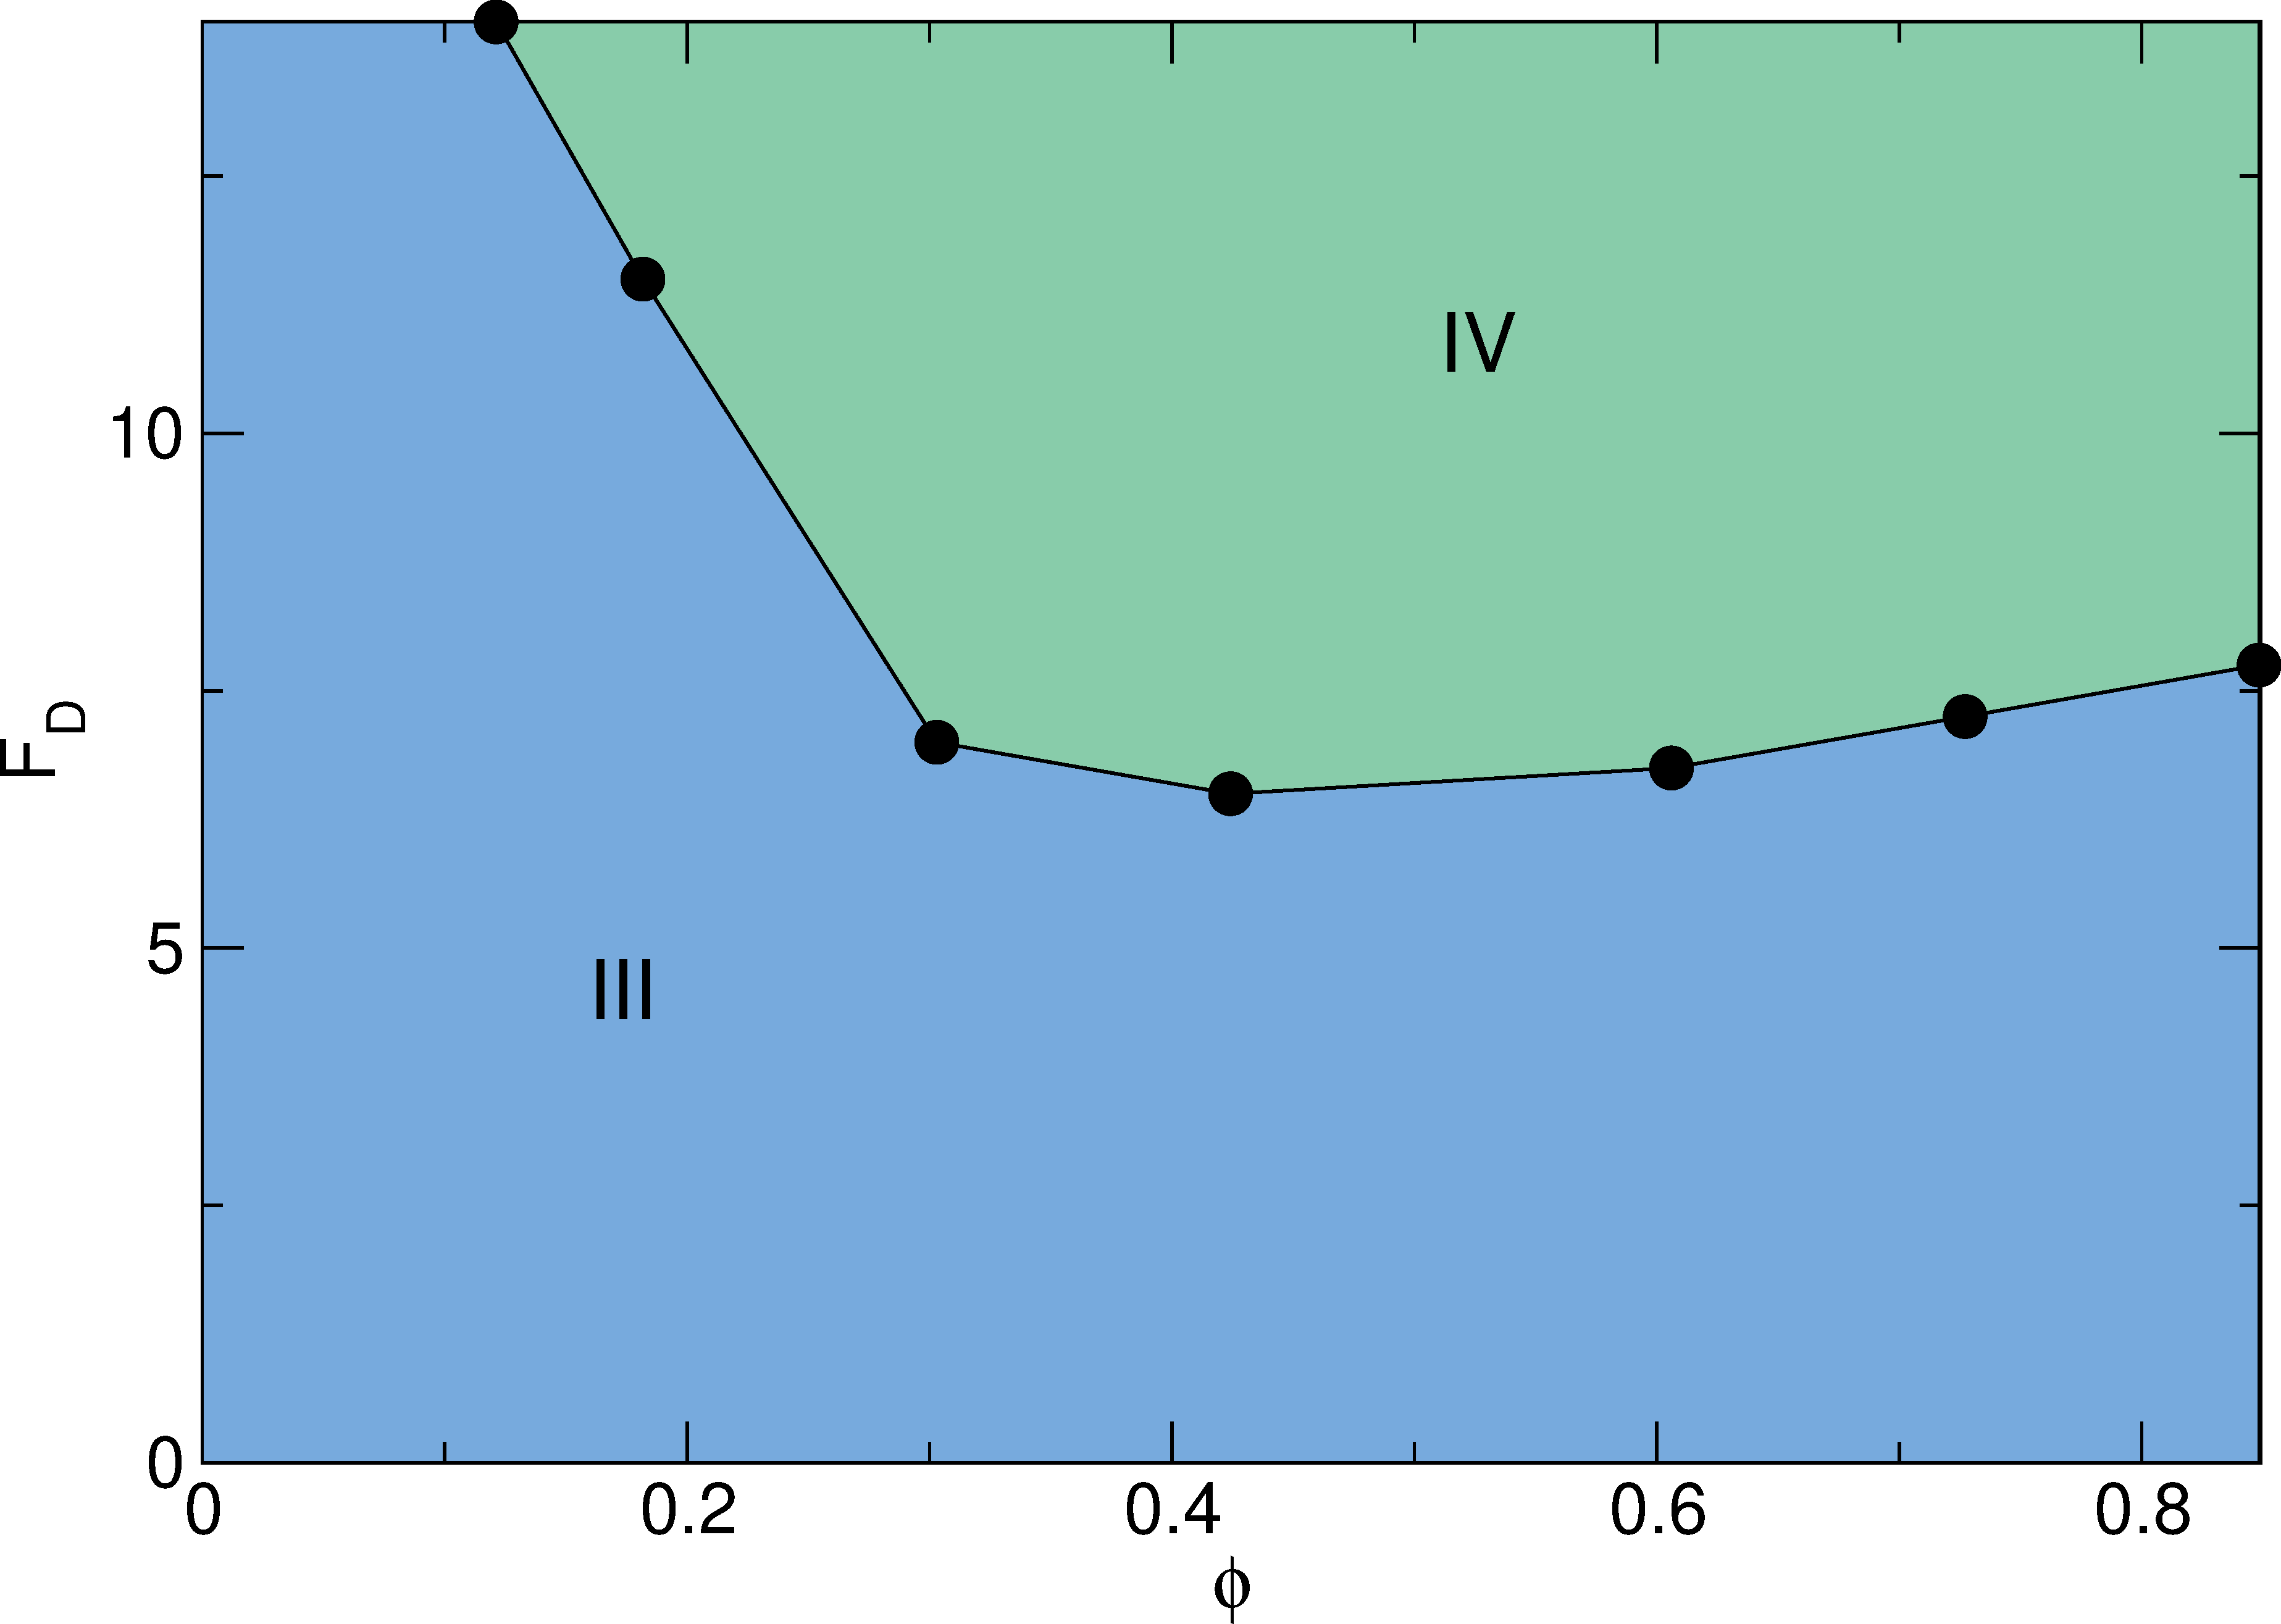
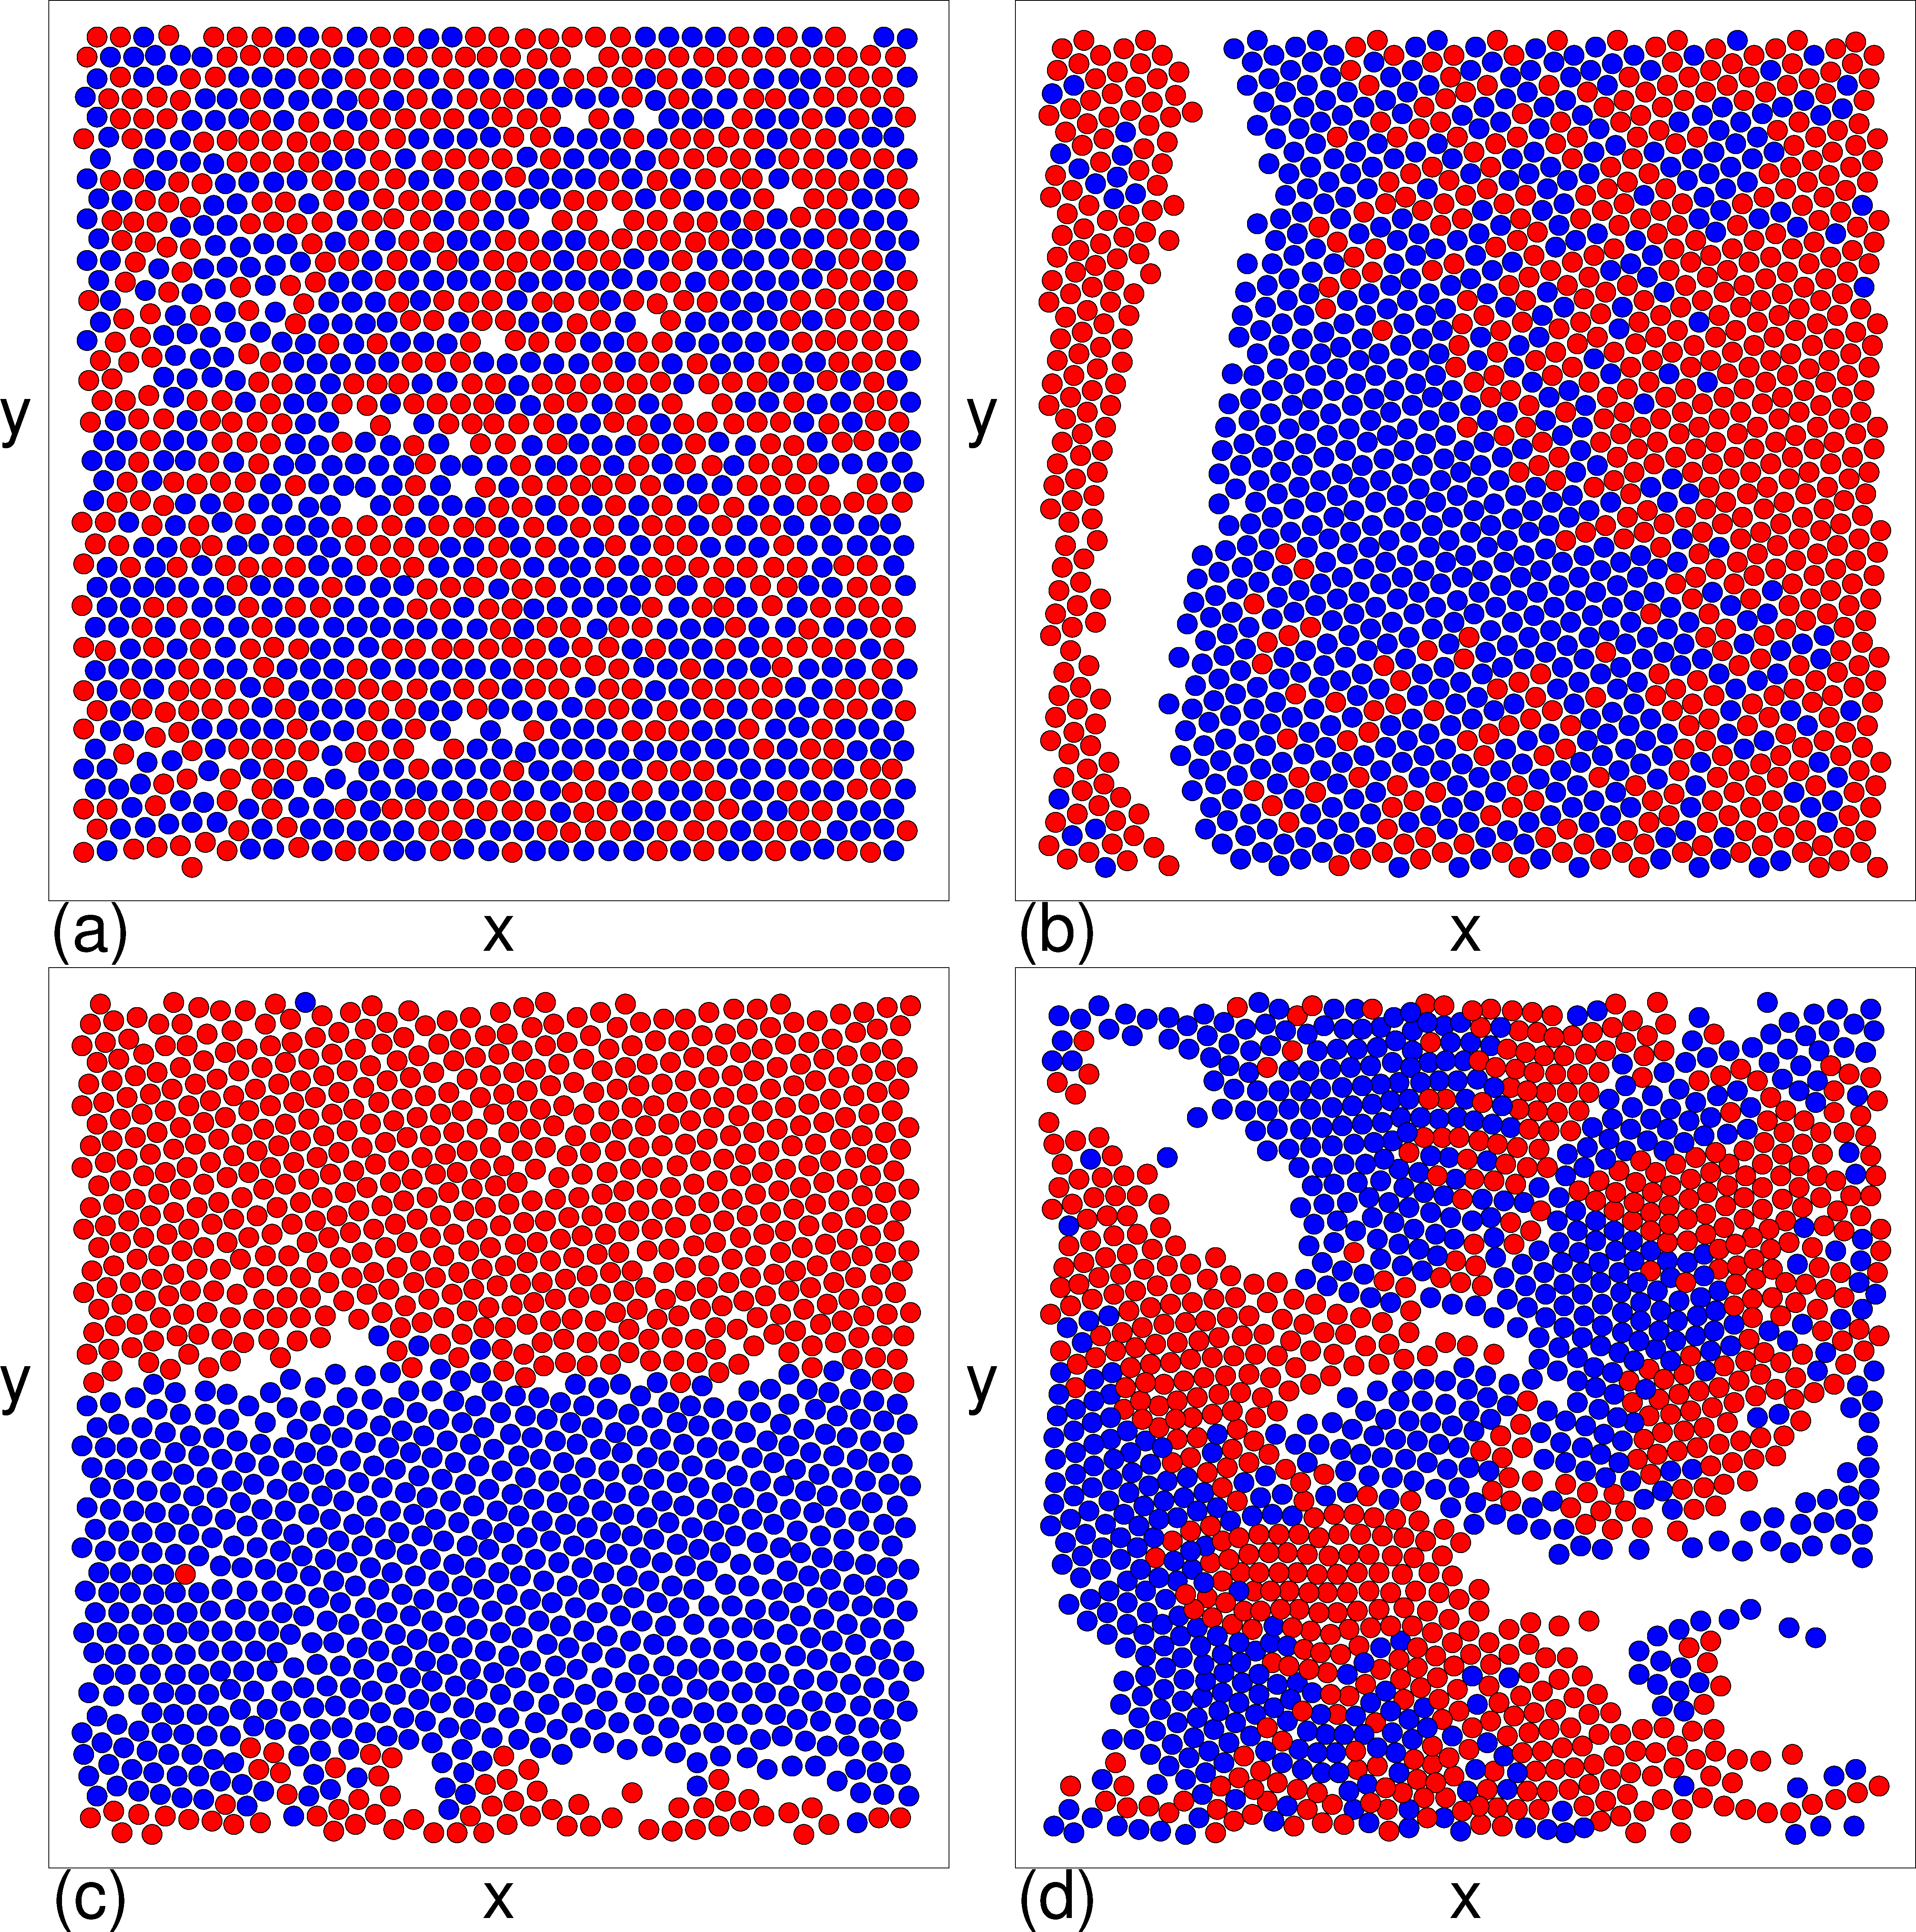
For τ < 500 we observe phase I (jammed), II (phase separated), III (disordered 
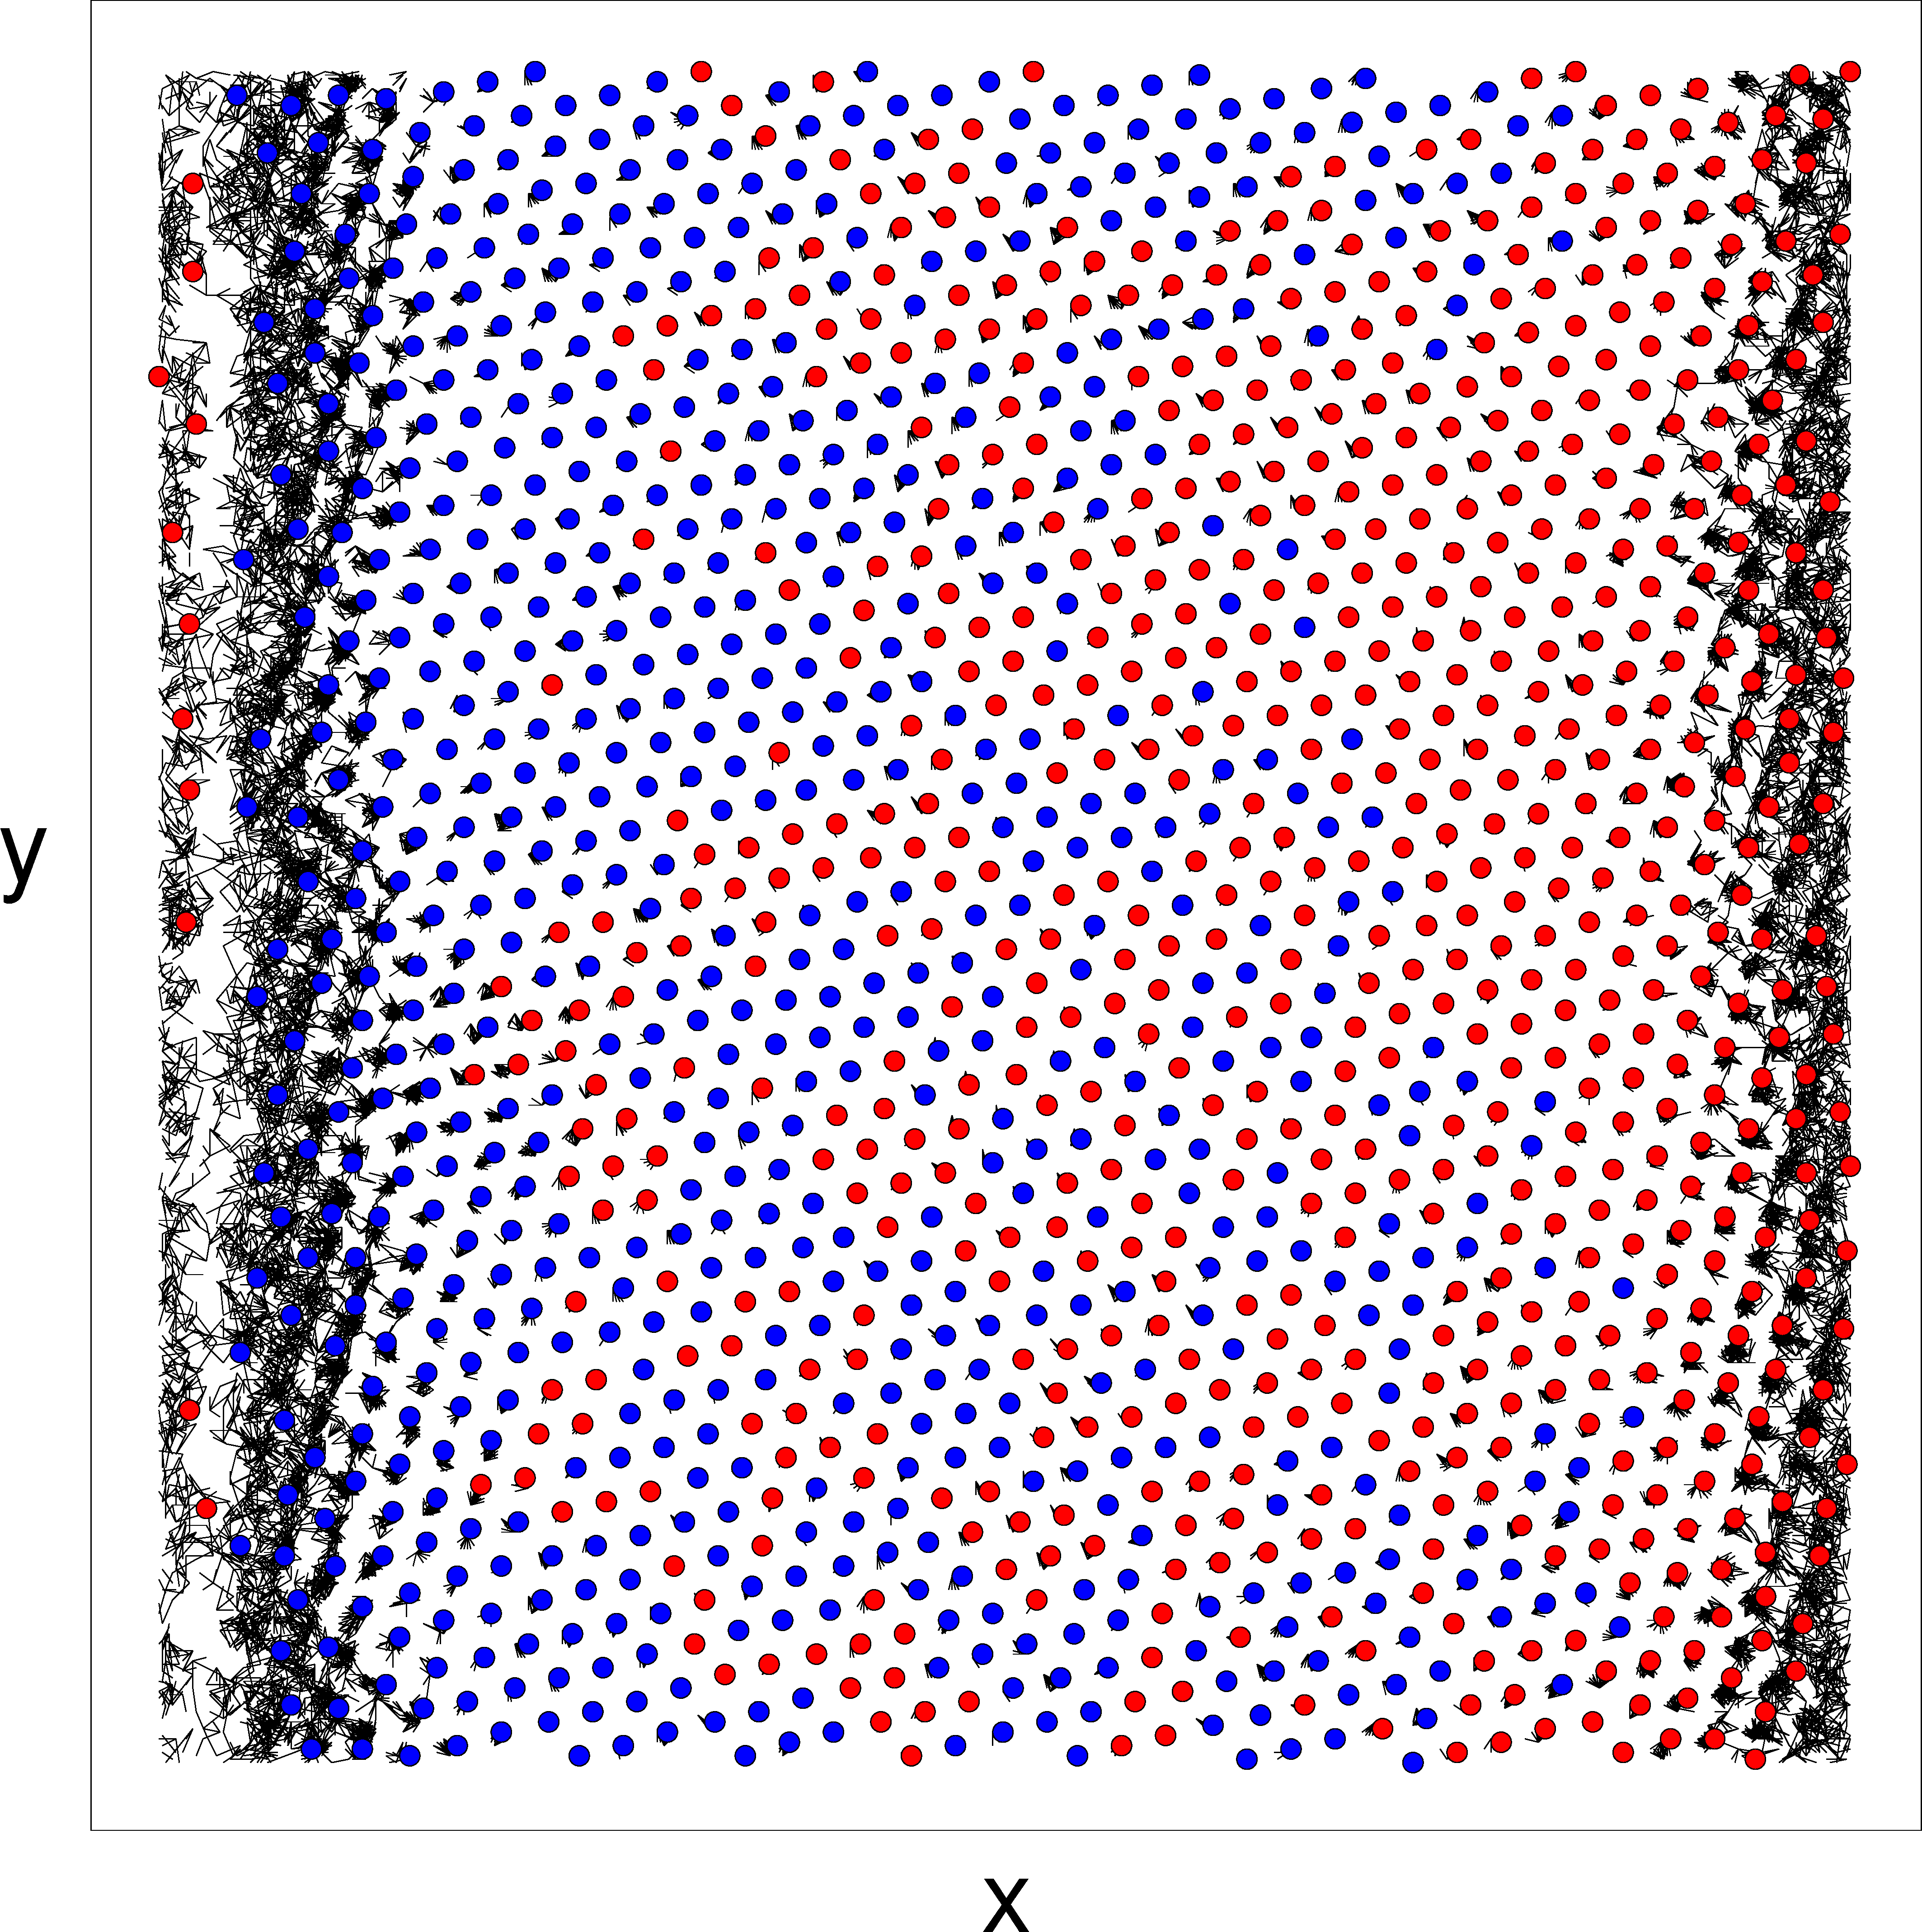
mixed flow), and IV (laning flow). Transitions between these phases appear as features in dV〉/dFD: an initial spike near FD=0.15 is the I-II transition, a negative region near FD=1.0 is the II-III transition, and the large spike that appears for FD > 5.0 is the III-IV transition. For τ > 1.5 ×10⁴, the III-IV transition is replaced by a III-V transition.
Fig12.png
Figure 12: Instantaneous positions of the σi=+1 (blue) and σi=−1 (red) run-and-tumble particles in the system from Fig. 11 with ϕ = 0.848 and τ = 10. (a) The jammed phase I at FD = 0.01. (b) The jammed phase I at FD = 0.15. (c) The phase separated state (phase II) at FD = 0.5. (d) The disordered mixed flow phase III at FD = 1.5.
We next consider the role of activity in the dense phase with ϕ = 0.848. Here, when FD < 1.0, we find two additional phases: a jammed state (phase I) and a phase separated state (phase II). In Fig. 11(a) we plot representative 〈V〉 versus FD curves for run times ranging from τ = 10 to τ = 2 ×10⁴. Figure 11(b) shows the corresponding dV〉/dFD versus FD curves and in Fig. 11(c) we plot P6 versus FD. For τ < 500 we find the jammed phase I in which 〈V〉 = 0 and dV〉/dFD = 0. The particle configurations in the two variations of the jammed state are illustrated in Fig. 12(a,b) for τ = 10 at FD=0.01 and FD=0.15, respectively. When FD < 0.05, the system remains in its initially deposited configuration and only small rearrangements occur before the particles settle into a motionless jammed state, while for FD > 0.05, the system undergoes transient large-scale rearrangements before organizing into a jammed state of the type illustrated in Fig. 12(b). Here there is both a density phase separation into high and zero density regions as well as a species phase separation, with the σi=−1 particles preferentially sitting to the left of the σi=+1 particles and blocking their motion. In phase II, the phase separated state illustrated in Fig. 12(c) for FD=0.5, each particle species forms a mostly triangular solid, giving a large value of P6. The I-II transition is associated with a spike in the dV〉/dFD curves near FD = 0.15. Within phase II, the phase separation allows the particles to move without collisions, so individual particles move at nearly the free flow velocity V0 and the mobility M ≈ 1. As FD increases, a II-III transition occurs. We illustrate the disordered mixed flow phase III in Fig. 12(d) for τ = 10 and FD = 1.5. The particles are in a fluctuating state and undergo numerous collisions, reducing the mobility. Just above the transition into phase III, some clustering of the particles persists, as shown in Fig. 12(d). As FD increases, the size of these clusters drops, causing P6 to decline. The II-III transition is associated with a drop in 〈V〉 and P6 along with negative values of dV〉/dFD, indicative of negative differential conductivity. For FD > 5.0 and τ < 1.5 ×10⁴, the system transitions from phase III to the laning cluster phase IV as shown previously, and this transition corresponds with upward jumps in 〈V〉 and P6 and a large positive spike in dV〉/dFD. For τ > 500, phases I and II disappear, as indicated by the loss of the spikes in dV〉/dFD and the reduced value of P6 at small values of FD. The III-IV transition shifts to higher values of FD as τ increases, as shown by the shift in the dV〉/dFD peak in Fig. 11(b). In phase IV, P6 gradually decreases with increasing τ up to τ = 1 ×10⁴, after which P6 begins to increase again when phase IV is replaced by phase V as shown previously. The transition to phase V is marked by a weak local maximum in dV〉/dFD.
We can characterize the dynamics of the dense phase in terms of three driving force regimes. At small drives, FD < 1.25, phases I and II appear. For intermediate values, 1.25 < FD < 5.5, the system is predominately in phase III. At high drives of FD > 5.5, phases IV and V occur.
Fig13.png
Figure 13: (a) 〈V〉 vs τ at FD = 0.15 and ϕ = 0.848. (b) The corresponding P6 vs τ. The system always reaches phase I for τ < 20 and phase II for 20 < τ < 65, while for 65 < τ < 300 the system can settle into either phase I or phase II. At larger τ, phase III flow is stable, and for τ > 1.5 ×10⁴, phase CL flow occurs.
Fig14.png
Figure 14: Trajectories over a fixed time period (lines) and instantaneous particle positions of the σi=+1 (blue circles) and σi=−1 (red circles) run-and-tumble particles for the system in Fig. 13 at τ = 200 and ϕ = 0.848, which reaches a reentrant jammed phase I. For clarity, in this image we have reduced the radii of the circles representing the particles in order to make the trajectories visible. Here there is a coexistence of a jammed state with a liquid.
In Fig. 13(a) we plot 〈V〉 versus τ for a system with ϕ = 0.848 and FD = 0.15, and we show the corresponding P6 versus FD curve in Fig. 13(b). For τ < 20, the system always forms a jammed phase I state with 〈V〉 = 0.0 and a high value of P6. Previous work with τ = 0 showed that phase II followed phase I upon increasing FD [19], while in Fig. 13 with fixed FD, phase II occurs for 20 < τ < 60 as indicated by the high value of 〈V〉 in this regime. We find that when 60 < τ < 300, the system can organize into either the jammed phase I or the phase separated state (phase II) as shown by the jumps in 〈V〉 between 〈V〉 = 0 and 〈V〉 ≈ V0, the free flow velocity. The plot in Fig. 13 was obtained from individual realizations for each value of τ; however, if we average the value of 〈V〉 over many different realizations for each τ, we obtain 〈~V〉 = 0.05 in this fluctuating regime since the system is in phase I for half of the realizations and in phase II for the other half. The reentrant behavior of phase I arises due to an effect similar to freezing by heating [46], since the increase in the run time makes the particle act as if it had an effectively larger radius, making the system susceptible to jamming. In Fig. 14 we show the particle positions and trajectories in the reentrant phase I for τ = 200. Here the jammed phase takes the form of a triangular lattice, while in the low density region, the particles are moving in a liquid like fashion. The appearance of the mixed phase I+phase II regime is probably strongly size dependent, similar to the observation that the freezing by heating phenomenon is enhanced by confinement [46]. For τ > 300 in Fig. 13, the activity is large enough to break apart the crystalline structure of phase I and the system enters the disordered mixing phase III, which coincides with a dip in P6 and a drop in 〈V〉. For τ > 1.5 ×10⁴, an increase in P6 coincides with the onset of the activity-included clustering phase CL in which 〈V〉 remains low. We find similar behavior as a function of τ over the range 0 < FD < 0.2, with the extent of the jammed phase I increasing as FD decreases.
Fig15.png
Figure 15: (a) 〈V〉 vs τ at FD=1.5 and ϕ = 0.848 where the system is always in phase III. (b) The corresponding P6 vs τ.
In Fig. 15(a,b) we show 〈V〉 and P6 versus τ for samples with ϕ = 0.848 at FD = 1.5, where the system is always in phase III. Here 〈V〉 gradually decreases from 〈V〉 = 0.575 at τ = 1.0 to 〈V〉 = 0.47 with increasing τ, while P6 decreases from P6=0.74 to P6=0.69. We find similar behavior for higher FD up to FD = 5.5.
Fig16.png
Figure 16: (a) 〈V〉 vs τ at FD = 6.5 and ϕ = 0.848. (b) The corresponding P6 vs τ. Here the system undergoes a IV-III transition.
Fig17.png
Figure 17: (a) 〈V〉 vs τ at FD=12.5 and ϕ = 0.848. (b) The corresponding P6 vs τ. The IV-V transition appears as a dip in P6, but there is is little change in 〈V〉 across the transition.
In Fig. 16 we plot 〈V〉 and P6 versus τ at FD = 6.5 and ϕ = 0.848 where the system is in the laning phase IV up to τ = 100. Within phase IV, 〈V〉 ≈ 6.5 and P6 ≈ 0.9. At the transition to phase III, there is an abrupt drop in both 〈V〉 and P6 when the onset of collisions between the two species decreases the flow. In Fig. 17(c,d) we show 〈V〉 and P6 versus τ in the same system at FD = 12.5 where a IV-V transition occurs near τ = 1.5 ×10⁴. At the transition, a dip in P6 appears but there is little change in 〈V〉. By conducting a series of simulations and examining the features in P6 and 〈V〉 along with images of the particle configurations, we construct a dynamic phase diagram as a function of FD versus τ for the ϕ = 0.848 system, as shown in Fig. 18. In the region marked phase I, the system always reaches a jammed state, while in the region marked phase II, the system is either in steady state phase II flow or falls into a reentrant phase I jammed state. Phases I and II appear only when τ < 500. Phase IV occurs at large FD when τ < 15000, phase CL occurs only when τ > 15000, and phase III separates phase II from phase IV, phase II from phase CL, and phase CL from phase V.
The phases we observe are robust for different system sizes. The transient times to reach the different phases increase with increasing system size, but there is little change in the locations of the phase transitions. The fluctuations in our system are produced by the activity; however, if an additional noise term such as a white noise is added, the phases remain stable until the noise becomes large enough to disorder the flow. Such an effect is akin to adding thermally-induced fluctuations, where the system disorders at high temperatures, but the phases remain stable over a range of lower temperatures. In this case, the noise would cause the locations of the transitions to shift. For example, in Fig. 18, phase III would gradually grow as the noise fluctuations increase.
Fig18.png
Figure 18: Dynamic phase diagram as a function of FD vs τ at ϕ = 0.848. In the region marked I the system always reaches the jammed phase I, while in the region marked II, the system sometimes reaches steady state phase II flow and sometimes enters a reentrant jammed phase I. Phase III is disordered mixing flow, phase IV is a laning state, phase V consists of laning cluster motion, and CL is the cluster phase.

VI.  SUMMARY

We have examined a two-dimensional binary system of particles driven in opposite directions where we introduce particle self-propulsion in the form of run-and-tumble dynamics. Previous work on this system in the non-active limit revealed four dynamic phases: jammed, phase separated, disordered mixing flow, and laning flow. At low particle densities, the non-active system exhibits both laning and disordered flow phases. As the activity is increased, the laning phase transitions into a disordered flow phase as indicated by both a drop in the average mobility and an increase in the frequency of particle-particle collisions. The transition also appears as a clear change in the velocity-force curve constructed using the average velocity of one particle species as a function of the external drift force. In terms of social systems, such a transition can be compared to a change from an orderly high mobility flow of agents such as pedestrians to a low mobility panic state in which the agents collide. At high drives we find a novel laning cluster state in which the particles undergo both density phase segregation and species phase segregation. The laning cluster state remains stable well below the density at which an activity-induced cluster state forms in an undriven system. This suggests that an externally applied drive can serve as an alternative method of inducing cluster formation in an active system. At high particle densities we find a total of six dynamic phases, including the jammed, phase separated, laning, and disordered flows, the laning cluster state, and an activity-induced cluster state which appears for small external drift forces. The activity can induce formation of a partially reentrant jammed state at low drift forces through a freezing by heating mechanism. Our results show that binary driven active particles exhibit a rich variety of behaviors. There are already several non-active experimental systems that can be modeled as binary driven systems, and it may be possible to realize variations of active matter binary driven systems that would exhibit the behavior we describe.

ACKNOWLEDGMENTS

We gratefully acknowledge the support of the U.S. Department of Energy through the LANL/LDRD program for this work. This work was carried out under the auspices of the NNSA of the U.S. DoE at LANL under Contract No. DE-AC52-06NA25396 and through the LANL/LDRD program.

REFERENCES

[1]
B. Schmittmann and R. K. P. Zia, Driven diffusive systems. An introduction and recent developments, Phys. Rep. 301, 45 (1998).
[2]
D. Helbing, I. J. Farkas, and T. Vicsek, Freezing by heating in a driven mesoscopic system, Phys. Rev. Lett. 84, 1240 (2000).
[3]
J. Dzubiella, G. P. Hoffmann, and H. Löwen, Lane formation in colloidal mixtures driven by an external field, Phys. Rev. E 65, 021402 (2002).
[4]
R. R. Netz, Conduction and diffusion in two-dimensional electrolytes, Europhys. Lett. 63, 616 (2003).
[5]
J. Chakrabarti, J. Dzubiella, and H. Löwen, Reentrance effect in the lane formation of driven colloids, Phys. Rev. E 70, 012401 (2004).
[6]
T Glanz and H Löwen, The nature of the laning transition in two dimensions, J. Phys.: Condens. Matter 24, 464114 (2012).
[7]
K. Klymko, P. L. Geissler, and S. Whitelam, Origin and macroscopic implications of lane formation in mixtures of oppositely driven particles, Phys. Rev. E 94, 022608 (2016).
[8]
A. Poncet, O. Bénichou, V. Démery, and G. Oshanin, Universal long ranged correlations in driven binary mixtures, Phys. Rev. Lett. 118, 118002 (2017).
[9]
M. E. Leunissen, C. G. Christova, A.-P. Hynninen, C. P. Royall, A. I. Campbell, A. Imhof, M. Dijkstra, R. van Roij and A. van Blaaderen, Ionic colloidal crystals of oppositely charged particles, Nature (London) 437, 235 (2005).
[10]
T. Vissers, A. Wysocki, M. Rex, H. Löwen, C. P. Royall, A. Imhof and A. van Blaaderen, Lane formation in driven mixtures of oppositely charged colloids, Soft Matter 7, 2352 (2011).
[11]
T. Vissers, A. van Blaaderen, and A. Imhof, Band formation in mixtures of oppositely charged colloids driven by an ac electric field, Phys. Rev. Lett. 106, 228303 (2011).
[12]
K. R. Sütterlin, A. Wysocki, A. V. Ivlev, C. Räth, H. M. Thomas, M. Rubin-Zuzic, W. J. Goedheer, V. E. Fortov, A. M. Lipaev, V. I. Molotkov, O. F. Petrov, G. E. Morfill, and H. Löwen, Dynamics of lane formation in driven binary complex plasmas, Phys. Rev. Lett. 102, 085003 (2009).
[13]
C.-R. Du, K. R. Sütterlin, A. V. Ivlev, H. M. Thomas, and G. E. Morfill, Model experiment for studying lane formation in binary complex plasmas, EPL 99, 45001 (2012).
[14]
M. Moussaid, S. Garnier, G. Theraulaz, and D. Helbing, Collective information processing and pattern formation in swarms, flocks, and crowds, Topics in Cognitive Sci. 1, 469 (2009).
[15]
I. D. Couzin and N. R. Franks, Self-organized lane formation and optimized traffic flow in army ants, Proc. Roy. Soc. B 270, 139 (2003).
[16]
H. Ohta, Lane formation in a lattice model for oppositely driven binary particles, EPL 99, 40006 (2012).
[17]
T. Glanz, R. Wittkowski, and H. Löwen, Symmetry breaking in clogging for oppositely driven particles, Phys. Rev. E 94, 052606 (2016).
[18]
K. Ikeda and K. Kim, Lane formation dynamics of oppositely self-driven binary particles: effects of density and finite system size, J. Phys. Soc. Jpn., 86, 044004 (2017).
[19]
C. Reichhardt and C. J. O. Reichhardt, Velocity force curves, laning, and jamming for oppositely driven disk systems, Soft Matter 14, 490 (2018).
[20]
C. Reichhardt and C. J. O. Reichhardt, Cooperative behavior and pattern formation in mixtures of driven and nondriven colloidal assemblies, Phys. Rev. E 74, 011403 (2006).
[21]
C. Reichhardt and C. J. O. Reichhardt, Stripes, clusters, and nonequilibrium ordering for bidisperse colloids with repulsive interactions, Phys. Rev. E 75, 040402 (2007).
[22]
A. Wysocki and H. Löwen, Oscillatory driven colloidal binary mixtures: Axial segregation versus laning, Phys. Rev. E 79, 041408 (2009).
[23]
M. Ikeda, H. Wada, and H. Hayakawa, Instabilities and turbulence-like dynamics in an oppositely driven binary particle mixture, EPL 99, 68005 (2012).
[24]
B. Heinze, U. Siems, and P. Nielaba, Segregation of oppositely driven colloidal particles in hard-walled channels: A finite-size study, Phys. Rev. E 92, 012323 (2015).
[25]
C. W. Wächtler, F. Kogler, and S. H. L. Klapp, Lane formation in a driven attractive fluid, Phys. Rev. E 94, 052603 (2016).
[26]
M. C. Cross and P. C. Hohenberg, Pattern formation outside of equilibrium, Rev. Mod. Phys. 65, 851 (1993).
[27]
T. Mullin, Coarsening of self-organized clusters in binary mixtures of particles, Phys. Rev. Lett. 84, 4741 (2000).
[28]
P. Sánchez, M. R. Swift, and P. J. King, Stripe formation in granular mixtures due to the differential influence of drag, Phys. Rev. Lett. 93, 184302 (2004).
[29]
C. Lozano, I. Zuriguel, A. Garcimartín, and T. Mullin, Granular segregation driven by particle interactions, Phys. Rev. Lett. 114, 178002 (2015).
[30]
M. C. Marchetti, J. F. Joanny, S. Ramaswamy, T. B. Liverpool, J. Prost, M. Rao, and R. A. Simha, Hydrodynamics of soft active matter, Rev. Mod. Phys. 85, 1143 (2013).
[31]
C. Bechinger, R. Di Leonardo, H. Löwen, C. Reichhardt, G. Volpe, and G. Volpe, Active Brownian particles in complex and crowded environments, Rev. Mod. Phys. 88, 045006 (2016).
[32]
Y. Fily and M. C. Marchetti, Athermal phase separation of self-propelled particles with no alignment, Phys. Rev. Lett. 108, 235702 (2012).
[33]
G. S. Redner, M. F. Hagan, and A. Baskaran, Structure and dynamics of a phase-separating active colloidal fluid, Phys. Rev. Lett. 110, 055701 (2013).
[34]
J. Palacci, S. Sacanna, A. P. Steinberg, D. J. Pine, and P. M. Chaikin, Living crystals of light-activated colloidal surfers, Science 339, 936 (2013).
[35]
I. Buttinoni, J. Bialké, F. Kümmel, H. Löwen, and C. Bechinger, Dynamical clustering and phase separation in suspensions of self-propelled colloidal particles, Phys. Rev. Lett. 110, 238301 (2013).
[36]
M. E. Cates and J. Tailleur, When are active Brownian particles and run-and-tumble particles equivalent? Consequences for motility-induced phase separation, Europhys. Lett. 101, 20010 (2013).
[37]
M. E. Cates and J. Tailleur, Motility-induced phase separation, Annu. Rev. Condens. Mat. Phys. 6, 219 (2015).
[38]
C. Reichhardt and C. J. O. Reichhardt, Active microrheology in active matter systems: Mobility, intermittency, and avalanches, Phys. Rev. E 91, 032313 (2015).
[39]
O. Chepizhko, E. G. Altmann, and F. Peruani, Optimal noise maximizes collective motion in heterogeneous media, Phys. Rev. Lett. 110, 238101 (2013).
[40]
O. Chepizhko and F. Peruani, Diffusion, subdiffusion, and trapping of active particles in heterogeneous media, Phys. Rev. Lett. 111, 160604 (2013).
[41]
C. Reichhardt and C.J. Olson Reichhardt, Absorbing phase transitions and dynamic freezing in running active matter systems, Soft Matter 10, 7502 (2014).
[42]
Cs. Sándor, A. Libál, C. Reichhardt, and C. J. Olson Reichhardt, Dynamic phases of active matter systems with quenched disorder, Phys. Rev. E 95, 032606 (2017).
[43]
T. Bertrand, Y. Zhao, O. Bénichou, J. Tailleur, and R. Voituriez, Optimized diffusion of run-and-tumble particles in crowded environments, Phys. Rev. Lett. 120, 198103 (2018).
[44]
C. Reichhardt and C. J. O. Reichhardt, Active matter transport and jamming on disordered landscapes, Phys. Rev. E 90, 012701 (2014).
[45]
C.J. Olson Reichhardt and C. Reichhardt, Avalanche dynamics for active matter in heterogeneous media, New J. Phys. 20, 025002 (2018).
[46]
D. Helbing, I. J. Farkas, and T. Vicsek, Freezing by heating in a driven mesoscopic system, Phys. Rev. Lett. 84, 1240 (2000).
[47]
N. Bain and D. Bartolo, Critical mingling and universal correlations in model binary active liquids, Nature Commun. 8, 15969 (2017).


File translated from TEX by TTHgold, version 4.00.
Back to Home