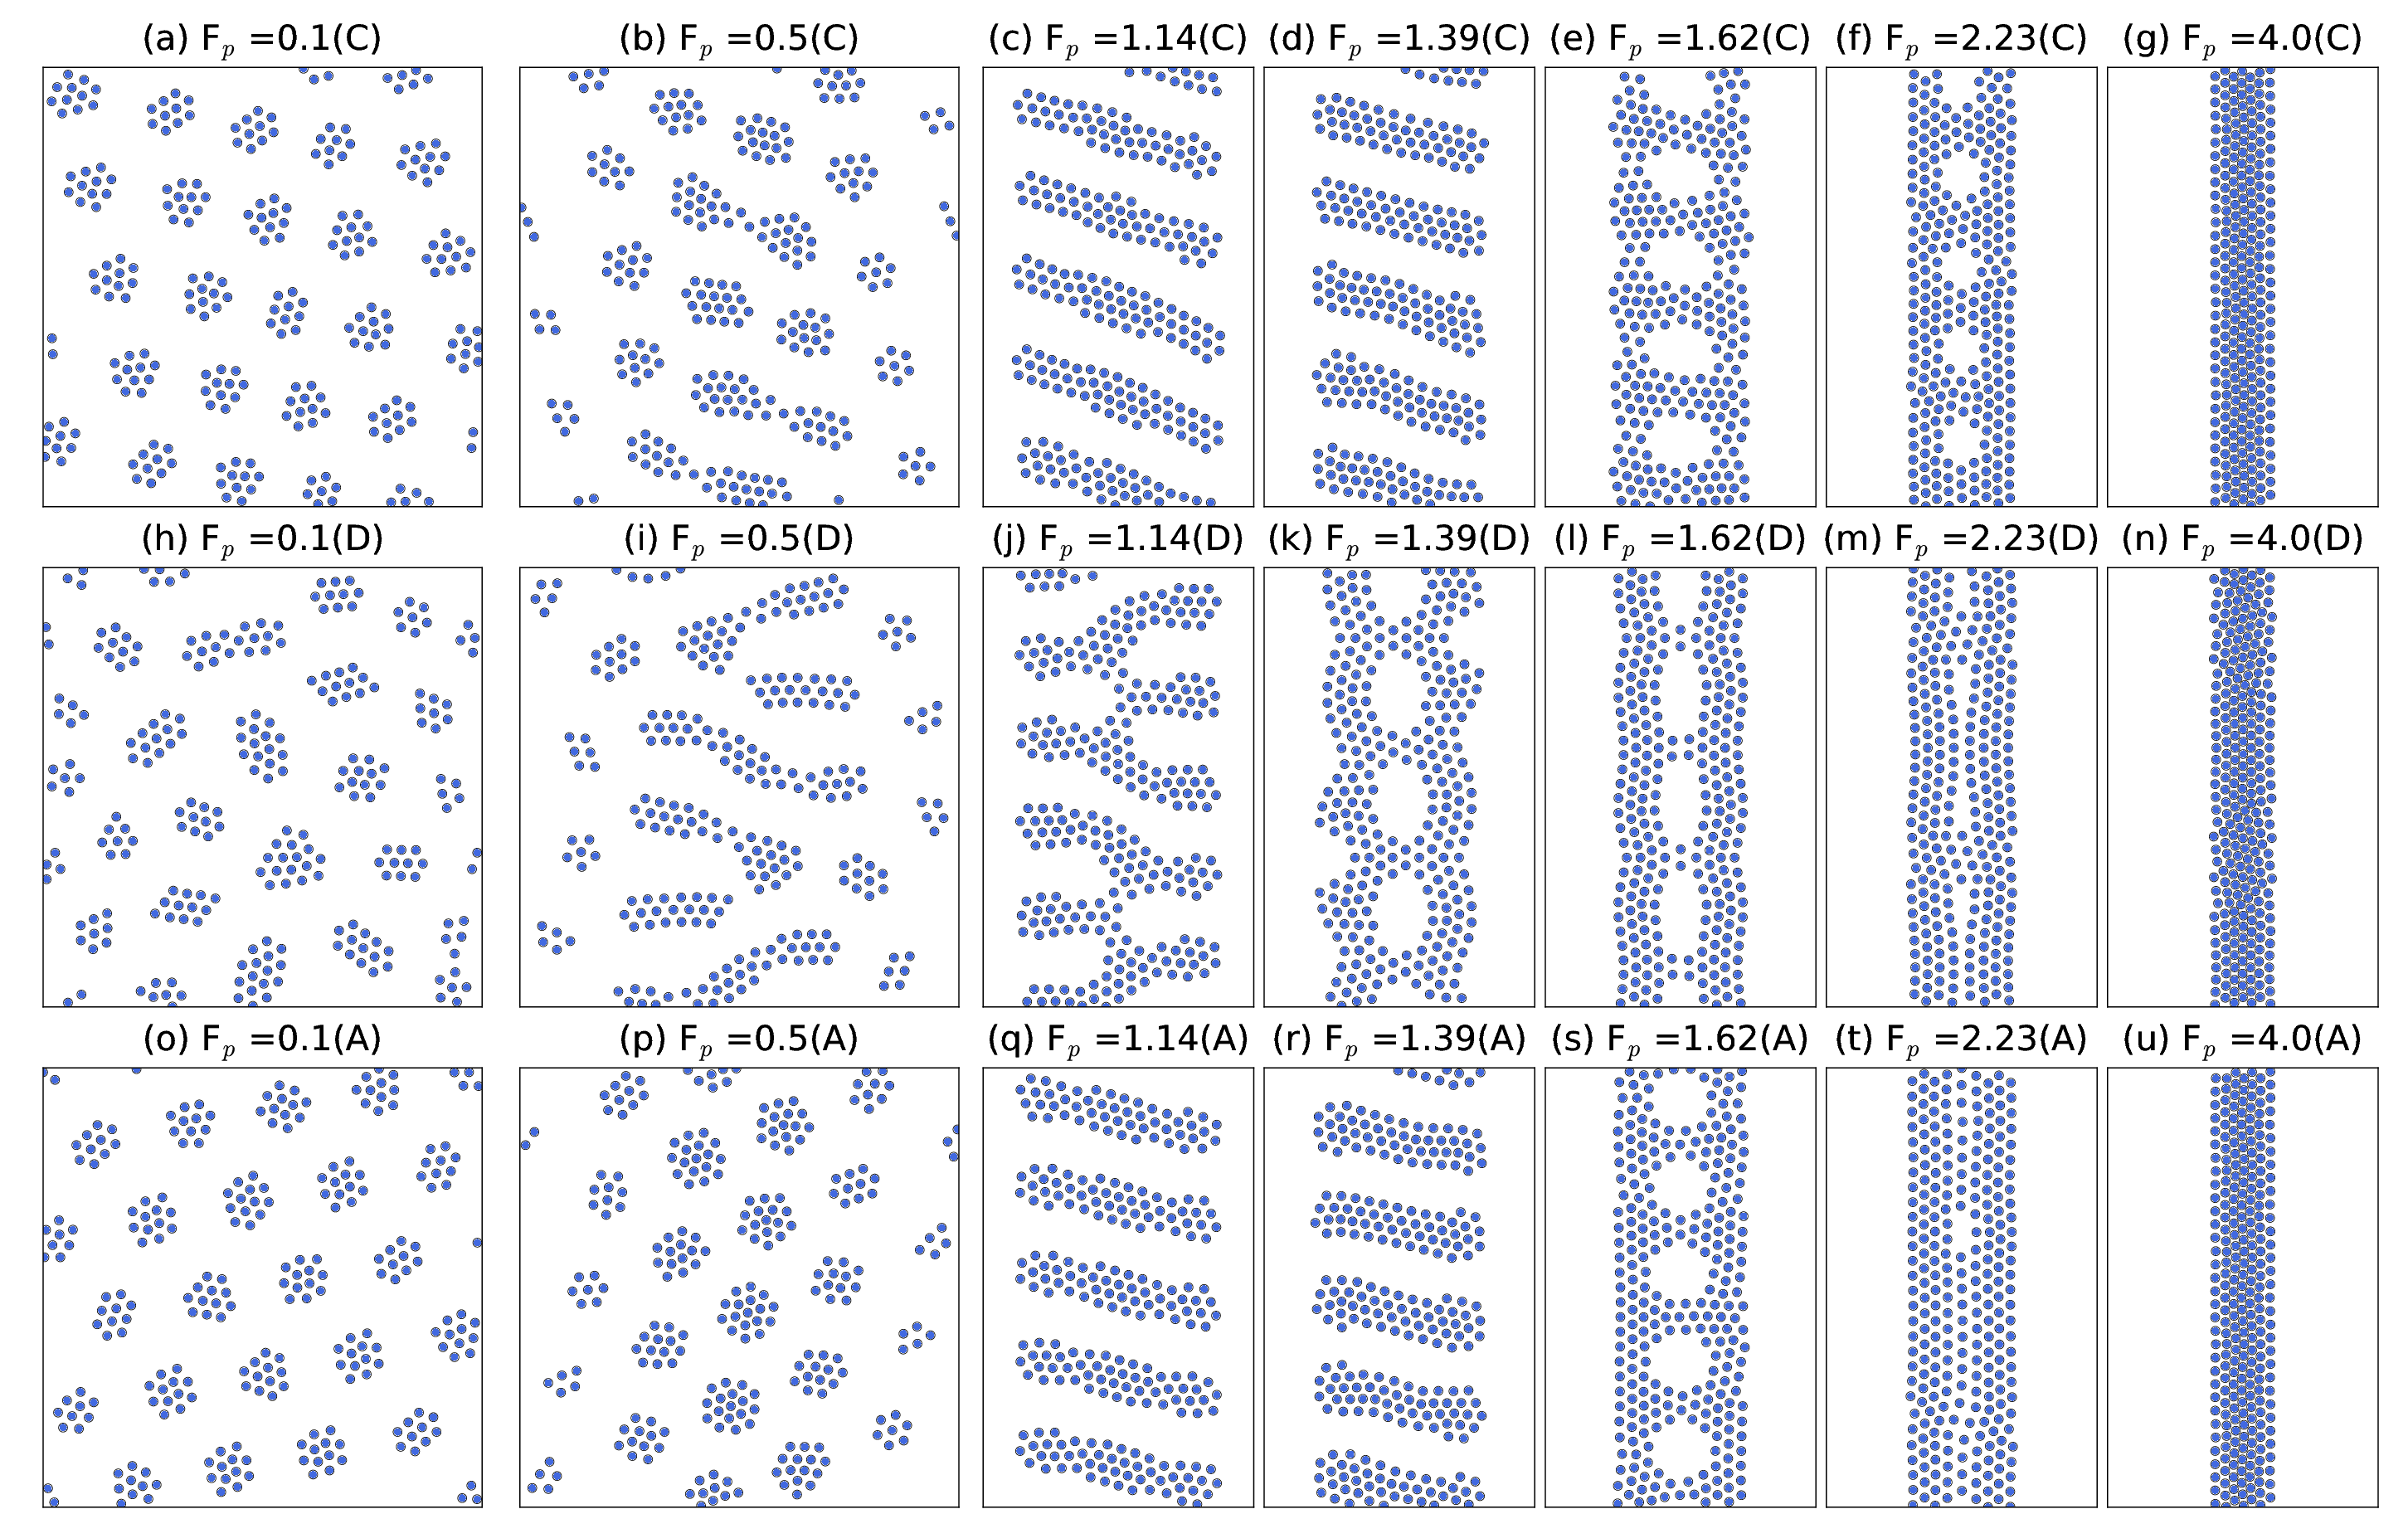
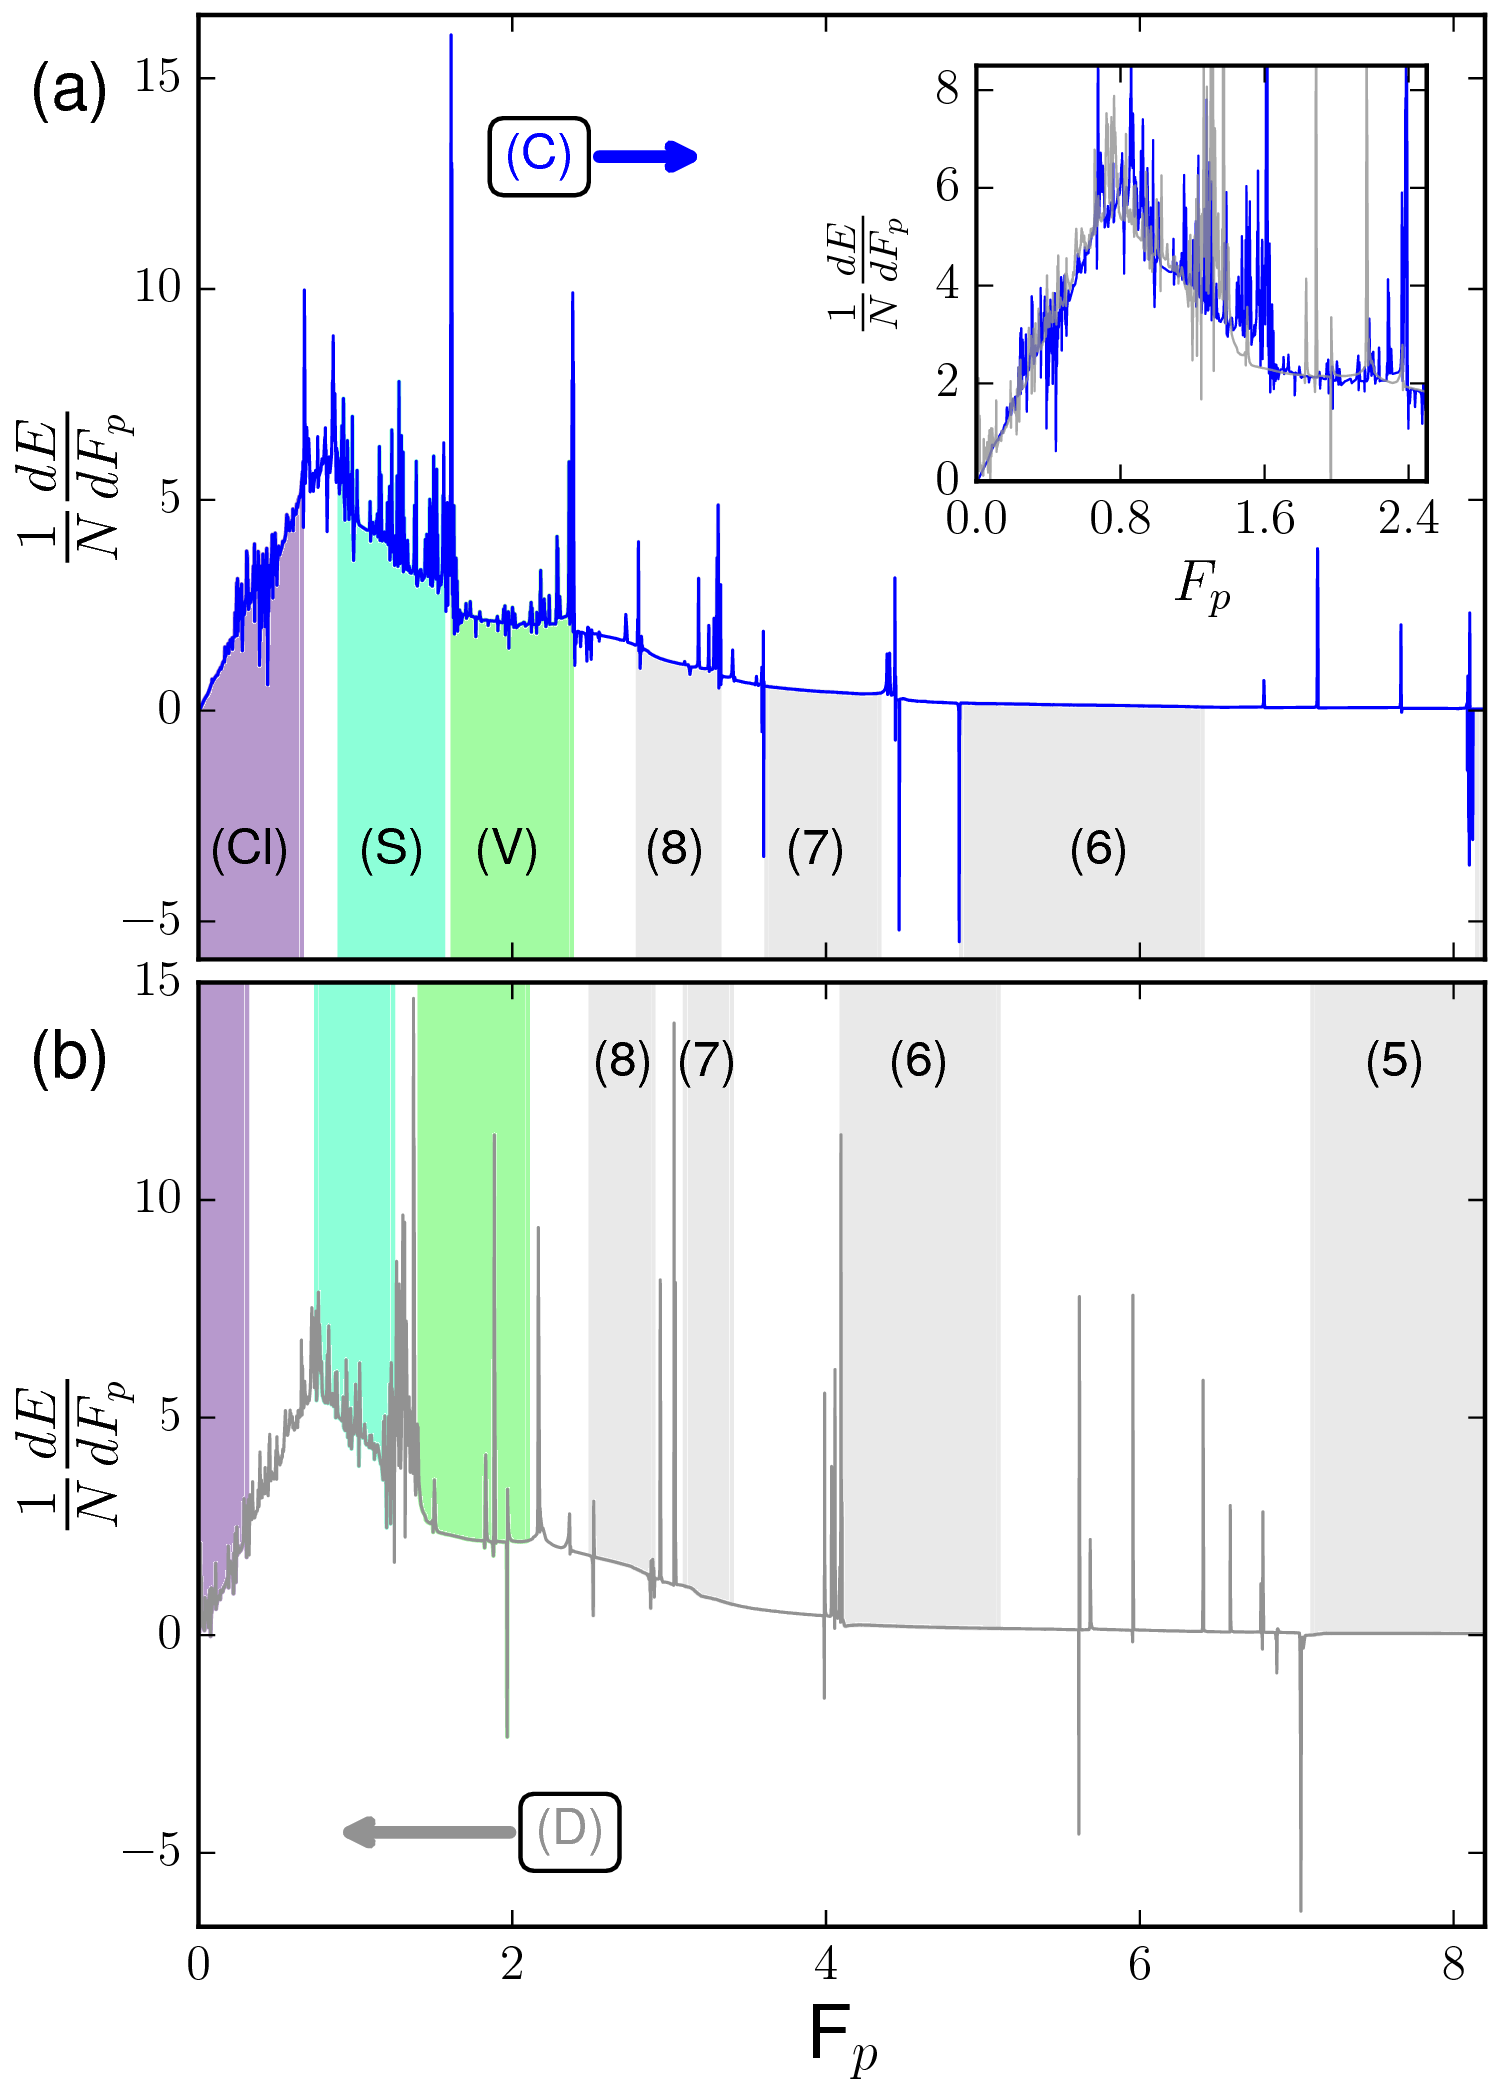
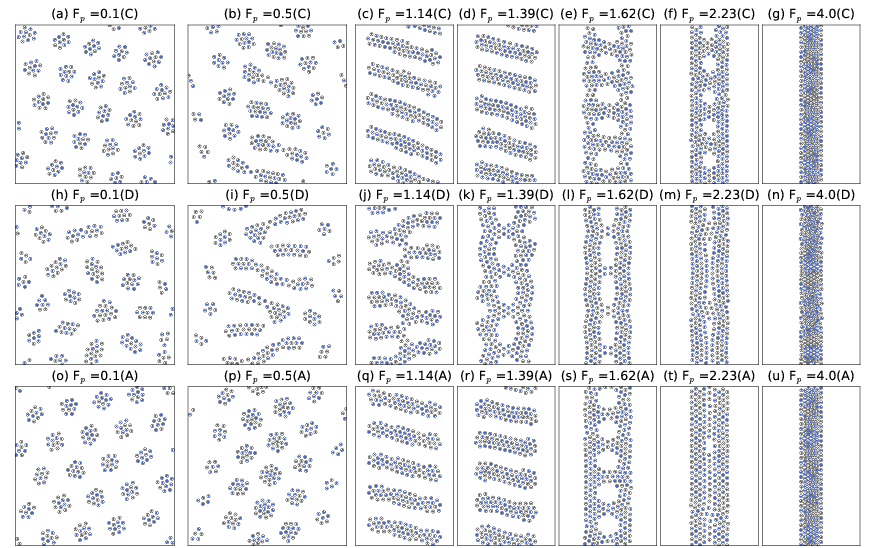
Soft Matter 12, 9549 (2016)

Structural Transitions and Hysteresis in Clump- and Stripe-forming Systems Under Dynamic Compression

Danielle McDermott,ab Cynthia J. Olson Reichhardt*a and Charles Reichhardta

aTheoretical Division, Los Alamos National Laboratory, Los Alamos, New Mexico 87545, USA. E-mail: cjrx@lanl.gov; Fax: +1 505 606 0917; Tel: +1 505 665 1134
bDepartment of Physics, Wabash College, Crawfordsville, Indiana 47933, USA.

DOI: 10.1039/c6sm01939k
www.rsc.org/softmatter
Using numerical simulations, we study the dynamical evolution of particles interacting via competing long-range repulsion and short-range attraction in two dimensions. The particles are compressed using a time-dependent quasi-one dimensional trough potential that controls the local density, causing the system to undergo a series of structural phase transitions from a low density clump lattice to stripes, voids, and a high density uniform state. The compression proceeds via slow elastic motion that is interrupted with avalanche-like bursts of activity as the system collapses to progressively higher densities via plastic rearrangements. The plastic events vary in magnitude from small rearrangements of particles, including the formation of quadrupole-like defects, to large-scale vorticity and structural phase transitions. In the dense uniform phase, the system compresses through row reduction transitions mediated by a disorder-order process. We characterize the rearrangement events by measuring changes in the potential energy, the fraction of sixfold coordinated particles, the local density, and the velocity distribution. At high confinements, we find power law scaling of the velocity distribution during row reduction transitions. We observe hysteresis under a reversal of the compression when relatively few plastic rearrangements occur. The decompressing system exhibits distinct phase morphologies, and the phase transitions occur at lower compression forces as the system expands compared to when it is compressed.
1 Introduction
2 Simulation and system
3 Results
4 Summary
References

1  Introduction

Superlattices of clump crystals, stripes, and voids form in a variety of soft matter systems [1,2,3,4,5,6,7], hard solids [8,9,10,11] and dense nuclear matter [12,13]. These systems can often be modeled as a collection of particles with pairwise interactions that act over multiple length scales. For instance, a rich variety of phases appear for a particle interaction potential that combines long range repulsion, which favors a uniform triangular crystal, with short range attraction, which favors condensed structures [3,4]. Clump and stripe morphologies also appear for strictly repulsive particle interactions provided that multiple length scales are present, such as in two-step repulsive potentials [14,15]. More generally, systems in which the Fourier transform of the particle interaction potential contains a negative mode can exhibit clump or stripe phases [16] that can undergo a multiple-step melting transition in which the ordering is destroyed at one length scale but preserved at another [5]. Introduction of a confining potential to such pattern forming systems can generate additional ordering effects such as the formation of rings, bands and other symmetric patterns [17,18,19,20], while the presence of a periodic substrate can induce commensurate-incommensurate transitions [21]. Studies of pattern forming systems generally focus on the types of patterned phases that appear, their equilibrium properties, and the nature of transitions between phases as a function of temperature, density, and interparticle interactions. Far less is known about the nonequilibrium behaviors of these systems under external drives, shear, or dynamic compression. In previous work, studies of the dynamical ordering of patterns driven over random substrates [22,23,24,25,26,27] or under an applied shear [28] showed that the system tends to form stripes that align in the direction of the drive or shear.
In this work we numerically examine the evolution of a system of particles with competing long range repulsion and short range attraction that are dynamically compressed and subsequently decompressed by a quasi-one-dimensional confining potential. In the absence of a confining potential, the particles organize into a clump state. During compression, the system undergoes a series of structural transitions from clumps to stripes, stripes to voids, and voids to a dense uniform phase by means of large-scale particle rearrangements. These large events are interspersed with smaller scale rearrangements consisting of localized excitations that are often quadrupolar in form. The structural rearrangements produce changes in the number of sixfold coordinated particles, the effective local density, and other geometric and energetic measures. We find a broad distribution of particle velocities with multiple scaling regimes. In the highly compressed dense uniform phase, the particle velocity distribution has avalanche-like power law scaling when large-scale rearrangements associated with changes in the triangular lattice ordering occur. These avalanche-like events, which we call row reduction transitions, occur through an order-disorder compression mechanism that differs from the dynamical behavior found for purely repulsive particles under compression [38]. The system exhibits hysteresis under decompression when the phase transitions shift to lower confining forces. Additionally, different stripe and void structures appear under decompression since fewer plastic particle rearrangements occur compared to the compression process.
Our model of a confining trap could be created experimentally through the optical trapping of soft matter systems [29,30,31], which permits the dynamical tuning of the strength of the confining potential. There are examples of Coulomb crystals in which particle confinement is changed by varying the strength of the confinement as a function of time [32,33,34,35]. Another compression method involves placing a soft matter assembly between two walls that confine the particles but allow fluid to flow through, such as in a recent bubble raft experiment on particles with competing interactions in which compression was used to achieve a structural transition from a less rigid to a more rigid amorphous phase that was correlated with a change in the mean coordination number and displacement field [36]. It may also be possible to compress a packing of magnetic particles using a changing magnetic field [37].

2  Simulation and system

We consider a two-dimensional (2D) system of size L ×L with periodic boundary conditions in the x and y-directions containing N=256 particles whose pairwise interactions include both repulsive and attractive components. The particle density is given by ρ = N/L2. The particle dynamics are governed by the following overdamped equation of motion:
η d Ri

dt
= − N

ji 
V(Rij) + Fsi + FTi.
(1)
Here η is the damping term which we set to unity and Ri (j) is the location of particle i (j). The particle-particle interaction potential has the form V(Rij) = 1/RijBexp(−κRij), where Rij=|RiRj|. The Coulomb term 1/Rij produces a repulsive interaction at long range, while the exponential term gives an attraction at shorter range. At very short range, the repulsive Coulomb interaction becomes dominant again. We place a cutoff on the interactions at Rij < 0.1 to avoid the divergence of the Coulomb interaction, and use a Lekner summation method to treat the long-range Coulomb forces [39]. The particles are confined by a single trough potential Fsi = Fpcos(2πxi/L)x which exerts an x-direction force that pulls the particles toward a central minimum. The thermal fluctuations FiT are present only during annealing and not during compression/decompression, and represent Langevin kicks with the properties 〈FiT〉 = 0 and 〈FiT(t)FjT(t′)〉 = 2ηkBTδijδ(tt′), where kB is the Boltzmann constant. Previous studies [4] of this model in the absence of a substrate showed that for fixed B = 2.0 and κ = 1.0, at low densities ρ ≤ 0.27 the system forms clumps that grow in size with increasing ρ. A stripe state appears for 0.27 < ρ ≤ 0.46, void crystals form for 0.46 < ρ ≤ 0.58, and a uniform triangular lattice appears for ρ > 0.58. Here we fix B=2.0 and κ = 1.0. We take L = 36.5 in dimensionless simulation length units so that in the absence of a confining potential the particle density is ρ = 0.19.
Before we apply compression forces, we anneal the system from a high temperature molten state down to zero temperature in small increments in order to obtain an initial substrate-free uniform distribution of clumps. Starting with the T=0 substrate-free annealed system, we ramp the substrate strength from 0 ≤ Fp ≤ 10 in quasistatic increments of ∆Fp = 0.001 every ∆t = 2000 simulation time steps, which permits the system to reach equilibrium at each confinement force, and then lower Fp back to zero at the same rate. For comparison, we also perform a static anneal of the system at selected fixed values of Fp in order to identify when the dynamically compressed particles are trapped in a metastable configuration.
During each confining force increment we measure ρeff, the density of the particles trapped within the well, given by
ρeff = N

L (xmaxxmin)
,
(2)
where xmax (xmin) is the x-position of the rightmost (leftmost) particle in the sample. Since the particles are pointlike, ρeff can become quite large in the densely compacted state. We also measure σxx, an element of the stress tensor:
σxx = 1

L2
N

i 


j < i 
(

F
 

ij 
)x (

R
 

ij 
)x ,
(3)
where Fij is the interparticle force between particles i and j and Rij is their relative separation. Further measures include the change in the total particle-particle interaction energy with compression force, dE/dFp, where E=∑iNjiNV(Rij), and the local ordering P6=N−1i=1Nδ(zi−6), where zi is the coordination number of particle i obtained from a Voronoi tessellation. We do not include particles along the sample edges in our measurement of P6 since they may show a local structure consistent with sixfold ordering despite not actually having six neighbors.
Fig1.png
Fig.  1: (a-u) Particle positions at increasing substrate strength Fp from left to right. Top row (a-g): compression (C); middle row (h-n): decompression (D); bottom row (o-u): annealed with fixed confining force (A). The confining forces Fp are: 0.1 (a,h,o), 0.5 (b,i,p), 1.14 (c,j,q), 1.39 (d,k,r), 1.62 (e,l,s), 2.23 (f,m,t), and 4.0 (g,n,u). The ESI+ fully illustrate the dynamics of compression and decompression.

3  Results

In Fig. 1 we plot the particle positions at selected confinement forces from compression (C, top row) and decompression (D, middle row) sequences as well as for static annealing (A, bottom row). The annealed configurations represent the ground state of the system, while the compression and decompression sequences exhibit hysteresis due to metastability caused by kinetic trapping.
Figure 1(a-g) illustrates the density-dependent phase transitions that occur during compression. The dynamics of these transitions are shown fully in ESI+. In Fig. 1(a), at Fp=0.10, the sample is filled with clumps that move as stable raftlike objects which interact only through long range repulsive forces. Each clump contains approximately ten particles with local triangular ordering. At Fp=0.50 in Fig. 1(b), the clumps interact and rearrange, becoming elongated as they converge at the center of the trap into proto-stripes. Figure 1(c) shows that the stripes at Fp=1.14 are roughly three particles wide, are slightly thicker near the trap center, and span the trap diagonally as in Ref.  21. As in Ref. 4, the stripe width is approximately equal to the diameter of the annealed clumps, a length scale that is determined by the range of the attractive interaction. As Fp continues to increase, the stripes become narrower in the x-direction, as shown in Fig. 1(d) for Fp=1.39. Here the stripes are four particles in width and exhibit some thickening at their outer edges. After the stripes have collapsed, as shown in Fig. 1(e) at Fp=1.62, five evenly-spaced voids form in the areas that previously separated the stripes. There are many defects and grain boundaries in the local particle ordering due to the rapid convergence of the separated stripes into a connected solid. Upon further compression these defects gradually heal as the voids shrink and become circular, as shown in Fig. 1(f) at Fp=2.23. Finally, at Fp=2.4, the voids collapse and the particles form a disordered dense solid that is n=8 rows wide (not shown). The particles eventually adopt nearly crystalline ordering in the dense phase, as illustrated in Fig. 1(g) at Fp=4.0.
Fig2a.png Fig2bcd.png
Fig.  2: (a) ρeff (blue) and P6 (green) vs Fp illustrating the transitions that occur under compression. The background shading indicates the regions of clumps (Cl, lavender), stripes (S, blue), voids (V, green), and crystalline order (n, gray) with white representing mixed phases or disordered regions. Each shaded region is labeled on the top axis, where the numbers in the crystalline ordered regime indicate that the packing is n rows wide. (b-d) Voronoi tessellation images of a portion of the compressed system illustrating the order-disorder cycle that occurs during an n=7 to n=6 row reduction transition. Voronoi cells with five sides are blue, six sides are gray, and seven sides are red. (b) Fp=4.1. (c) Fp=4.4. (d) Fp=5.0.
The qualitative behavior under decompression is similar to that observed for compression, as shown in Fig. 1(h-n); however, we find hysteresis in the onset of the transitions and the detailed morphology of the phases. The decompression dynamics are fully illustrated in the supplementary materials [ESI+]. In Fig. 1(n) at Fp=4.0, multiple triangularly ordered domains appear in the decompressing n=7 row wide dense packing as part of a transition in the number n of rows in the dense packing. As expansion continues, voids form by a nucleation process in which the dense solid unzips, creating two long gaps at the substrate minimum as shown in Fig. 1(m) at Fp=2.23. Although the compression of the void state involves localized defects and plastic rearrangements, during decompression the edge particles move smoothly and symmetrically outward. The symmetric voids at Fp=1.62, illustrated in Fig. 1(l), transition into the asymmetric arrangement shown in Fig. 1(k) at Fp=1.39 when a small void-like region opens on each edge of the sample. The asymmetric voids unravel into W-shaped labyrinth-like stripes that span the trap diagonally in both directions, as shown in Fig. 1(j) for Fp=1.14, instead of forming the uniformly spaced stripes that appear during compression. The stripe to clump transition is shifted to lower Fp during decompression, compared to where it occurs under compression, and proceeds via the formation of a mixed clump-stripe state of the type illustrated in Fig. 1(i) for Fp=0.50. The final clump state, shown in Fig. 1(h) at Fp=0.10, is not uniform but has a clear size distribution, with larger clumps located closer to the substrate minimum. The distribution of clump sizes is a result of the metastable persistence of the stripes to lower confinement during decompression.
In Fig. 1(o-u) we show the particle configurations obtained by annealing the particles in a static potential with fixed Fp. At Fp=0.1 in Fig. 1(o), the annealed system is nearly identical to the dynamically compressed system of Fig. 1(a). At Fp=0.5 in Fig. 1(p), the stripelike order found under compression and decompression is replaced by inhomogeneous clumps, with the largest clumps located closest to the substrate minimum. In the annealed stripe state at Fp=1.14 in Fig. 1(q), the modulated stripe widths minimize the repulsive interaction between the particles, and the stripes are narrower than those that form under compression. At Fp=1.39, where a metastable void state appears under decompression, Fig. 1(r) shows that the annealed sample forms stripes that are slightly thickened at the outer edges, similar to the compressed state at the same Fp in Fig. 1(d). In contrast to the elongated voids that form under compression or decompression, the annealed voids, shown in Fig. 1(s) at Fp=1.62, are nearly circular, while the particles surrounding the voids form a partially disordered triangular lattice. Figure 1(t) illustrates the last vestiges of the annealed void state at Fp=2.23 where a disordered triangular lattice appears that has a reduced density near the substrate minimum. The well-formed voids shown in Fig. 1(f) in the compressed sample at the same Fp are thus metastable. At Fp=4.0 in Fig. 1(u), the ordering in the dense annealed state is indistinguishable from that in the compressed packing in Fig. 1(g).
In Fig. 2(a) we illustrate the dynamical evolution of P6 and ρeff under compression. We observe clump (Cl), stripe (S), and void (V) ordering, as well as a dense n row triangular lattice (n) with n ranging from 8 to 5. At low Fp, P6 fluctuates rapidly and shows large jumps at the morphological transitions into and out of ordered states, while at high Fp, there are a series of plateau regions with P6 > 0.9 interrupted by sharp drops in P6 when row reductions occur. differ from the morphological phase transitions that occur at low confinement. When the particles are compressing via slow elastic motion, ρeff changes smoothly, whereas a sudden decrease of the width of the packing produces a sudden jump in ρeff. Often such jumps coincide with jumps in P6 since ordered crystalline domains with high P6 appear when a relatively disordered diagonal patch of the type illustrated in Fig. 1(n) reorders under the applied compression, so that the packing simultaneously becomes narrower and better ordered.
For low compression forces 0.0 < Fp < 0.26, ρeff in Fig. 2(a) remains flat since the particles still span the entire width of the system, and the clumps of particles move as stable rafts until the first clump-clump collision occurs. There is a large upward jump in P6 and a slight increase in ρeff at Fp ≈ 0.66 at the end of the pure clump phase where the first stripe forms. Under further compression, ρeff steadily increases and shows occasional jumps produced by structural transitions. For 0.9 < Fp < 1.6, the particles rapidly migrate toward the minimum of the substrate potential, and the increased local density causes a transition to an ordered stripe phase (S). The average value of P6 is noticeably higher in the stripe state than in the clump or void states, and P6 drops sharply at Fp=1.6 at the stripe to void transition, where a system-wide avalanche occurs and ρeff shows a slight jump. For 1.6 < Fp < 2.4, compression proceeds via the gradual shrinking of the voids. Several jumps in P6 occur as particles fill the outer edges of the void regions, while ρeff gradually increases. The closure of the voids is marked by a large jump in P6 and small fluctuations in ρeff when the system forms a disordered n=8 solid band that has a slightly reduced particle density at the substrate minimum.
As the compression proceeds in the densely packed phase, the particles shift toward the substrate minimum and develop sixfold ordering, as indicated by the slow rise in P6 in Fig. 2(a) over the range 2.4 < Fp < 2.9. The sharp jump in P6 at Fp=2.9 occurs when the packing first becomes nearly crystalline. As the number of rows n decreases step by step during compression, P6 alternates from P6 > 0.9 when the sample is in an n row ordered state to P6 < 0.9 when the sample disorders during the n to n−1 transition. In a study of the compression of purely repulsive particles in Ref. 38, the primary mechanism for row reduction transitions was a release from a highly anisotropic to a relatively isotropic triangular ordering via edge defect formation. In contrast, for the pattern forming system, the row reductions occur gradually due to the short range interparticle attractive force, and are initiated by a necking effect consisting of a localized density increase, as illustrated in the Voronoi tessellations of Fig. 2(b-d) and in the supplementary videos  [ESI+]. For 3.6 < Fp < 4.2, there is a plateau in Fig. 2(a) where P6 ≈ 0.96, indicating that the system is nearly crystalline, as illustrated at Fp=4.1 in Fig. 2(b). As the compression continues, additional row reductions occur, until at Fp=10.0, the particles are in a highly compressed state with n=5, at which point we begin the decompression process.
The hysteretic signatures in ρeff, P6, and σxx versus Fp for compression and decompression are plotted in Fig. 3. During decompression, the structural transitions are systematically shifted to lower Fp and fewer plastic rearrangements occur. In Fig. 3(a) we plot ρeff versus Fp for compression, decompression, and static annealing. Under annealing, the particles pack more tightly into the substrate minimum to give the highest values of ρeff. At high Fp, the decompression of the dense solid proceeds via a slow elastic expansion in which the particles tend to maintain the same nearest neighbors and the system forms inhomogeneous domains similar to those observed under compression that mediate the disorder-order transitions from n to n+1 rows. These transitions produce dips and jumps in P6 in Fig. 3(b). Since only elastic motion occurs for Fp > 8, ρeff, P6, and σxx are not hysteretic in this region.
Fig3.png
Fig.  3: (a) ρeff vs Fp, (b) P6 vs Fp, and (c) σxx vs Fp for the system under compression (blue), decompression (gray), and static annealing (magenta). The compression curves in panels (a) and (b) also appear in Fig. 2. In the inset of panel (a) we highlight the hysteresis in ρeff at the stripe-void transition.
In Figure 3(b), the largest single jump in P6 under compression occurs when the voids close at Fp=2.4. There is a complimentary sharp drop in P6 at Fp=2 under decompression when the voids open. From Fp=2.0 to Fp=1.4 in the symmetric void phase under decompression, σxx decreases with decreasing Fp and P6 fluctuates around a value of P6 ≈ 0.75. Below Fp=1.4 for decompression, P6 drops steadily and contains no signatures associated with the formation of labyrinth-like stripes or the clump state. When asymmetric voids appear, for 1.4 > Fp > 1, σxx increases with decreasing Fp, and there is a step in ρeff. A peak in σxx occurs at the void to stripe transition at Fp=1.6 under compression, while σxx increases with decreasing Fp under decompression in both the asymmetric void and the labyrinth phases before merging with the compression curve at Fp=1.4 when the connections between adjacent labyrinths break. The inset of Fig. 3(a) highlights the hysteresis in ρeff at the void-stripe transition where the jump in ρeff associated with void collapse/formation occurs at Fp=1.6 under compression and at Fp=2.0 under decompression. There is an additional drop in ρeff for the decompressing system at Fp=1.4, when the voids change from symmetric to asymmetric. The slight hysteresis in ρeff above Fp=1.6 is the result of slightly different void morphologies under compression and decompression, as illustrated in Fig. 1. The effective system width cannot capture the behavior at low confinement forces, so ρeff shows no hysteresis for Fp < 1.4.
At lower Fp, Fig. 3(b) shows that sharp jumps in P6 appear only during compression-induced transitions, while P6 decreases steadily with decreasing Fp under decompression. In addition, σxx is systematically higher under expansion than under contraction, as shown in Fig. 3(c). During decompression, the domains tend to undergo elastic motions that preserve the nearest neighbor structure of each particle, so σxx decreases smoothly under decompression as Fp is lowered and the stripes break apart into clumps, in a manner similar to the smooth increase of σxx with increasing Fp in the clump phase under compression.
Fig4_dEdF.png
Fig.  4: (a,b) Change in system energy dE/dFp vs Fp under compression (a) and decompression (b). Inset of panel (a): both curves plotted together. The bands of color denote: clumps (Cl, lavender), stripes (S, light blue), voids (V, green), and dense crystal with different numbers of rows of particles (n, gray).
In Fig. 4(a,b) we plot the change in the total interparticle interaction energy dE/dFp versus Fp under compression and decompression, and show both curves together in the inset of Fig. 4(a). Shading indicates the values of Fp for which the sample is in the clump (Cl), stripe (S), void (V), or crystalline state with n rows of particles (n). White areas indicate mixed regions, such as the mixed clump-stripe phase that appears under decompression for 0.3 < Fp < 0.9. Spikes in dE/dFp indicate plastic rearrangements. For low confinement forces, dE/dFp fluctuates rapidly about its average value as the particles repeatedly rearrange plastically in response to the changing substrate. These noise bursts are more intense during compression than during decompression, indicating the less frequent occurrence of plastic rearrangements. At high Fp, the particles are too dense to rearrange easily, so dE/dFp becomes smooth except for rare large avalanche events.
Fig5.png
Fig.  5: (a-f) Positions and velocities of the compressed system during the formation and collapse of the void state. The velocity vector (arrow) indicates the instantaneous direction of motion and the particle color indicates speed. White particles are completely motionless, blue particles are nearly motionless, and red particles move the most rapidly. (a) Fp=1.45. (b) Fp=1.61. (c) Fp=2.04. (d) Fp=2.24. (e) Fp=2.39. (f) Fp=4.0.
In Fig. 4(a), dE/dFp increases smoothly with Fp at very low Fp due to the increase in the repulsive interparticle interaction as the clumps glide toward the substrate minimum before the first clump collision occurs. The negative spikes in dE/dFp that occur in the clump phase result when clumps at the edge of the particle assembly break apart, while positive spikes in dE/dFp are produced by the collision of clumps near the substrate minimum. At the clump to stripe transition at Fp=0.9, there is a large positive spike in dE/dFp along with a slope change from positive to negative. The average value of dE/dFp decreases with increasing Fp for Fp > 0.9 since the stripe structures thicken while the interparticle distances change very little. As a result, E decreases as the particles gain neighbors that contribute to the attractive interparticle interaction. Many positive spikes in dE/dFp occur in the stripe regime due to frequent rearrangements of the particles around the stripe edges. The stripe-void transition is marked by a large positive spike in dE/dFp at Fp=1.6 produced when particles rush to fill the inter-stripe gaps, which suddenly increases the interparticle repulsive force in a system-wide avalanche. In the void phase, small positive spikes in dE/dFp appear when a few particles move inward in order to gradually shrink the size of the voids. The end of the void phase is associated with a large spike in dE/dFp at Fp=2.4 caused by particles flooding into the remaining void space. There are fewer spikes in dE/dFp in the dense solid states since the deformation of the system is dominated by elastic motion except for occasional plastic avalanches associated with row reduction transitions. Under compression the majority of spikes are positive, indicating an increase in the system energy as the particles are forced into stronger confinement. In contrast, large negative spikes occur during decompression that coincide with positive jumps in P6, associated either with an energy release by the destruction of strain-induced defects, or with a dynamical reordering from a highly anisotropic to an isotropic arrangement of particles. At the highest confinement forces, Fp > 8, dE/dFp is featureless since no rearrangements occur for either compression or decompression. The noise in dE/dFp in the clump and stripe phases is reduced during expansion due to the lack of plastic rearrangements compared to compression. There is no large noise spike at the stripe-clump transition since these phases coexist under expansion until Fp ≈ 0.3.
In Fig. 5 we show the positions and average velocity of individual particles in the system under compression at different Fp values spanning the stripe to void and void to dense solid states. The typical mechanism for stripe compression is illustrated in Fig. 5(a), at Fp=1.45. Each stripe gradually becomes thicker as particles rearrange through a vortexlike motion at the stripe ends, as shown on the left end of the bottommost complete stripe. Such vortexlike motion rarely occurs during decompression. Figure 5(b) shows the collapse of the stripe state into a void state at Fp=1.61. At this point, the stripes have reached their maximum thickness, which is dictated by the length scale of the short range attraction, so the stripe ends begin to buckle outward, allowing particles to bridge the inter-stripe gaps, as indicated by the red particles with large velocity vectors. We show a quiescent void state at Fp=2.04 in Fig. 5(c), where the particles form a disordered triangular lattice surrounding five nearly circular voids. At high confinement, the system spends more time in a quiescent state, and shows less noise in dE/dFp, with no large spikes appearing between 1.6 < Fp < 2.4 in Fig. 4(a).
In Fig. 5(d) at Fp=2.24, the voids have been compressed to a smaller size, and the upper void serves as the center of a vortex of particle motion, which is a common rearrangement mechanism in the compressing void system. Similar vortexlike motions do not occur in the expanding void state. In Fig. 5(e), at Fp=2.39, the voids have just closed, and the system forms a disordered dense solid through the plastic motion of many particles. As the compression proceeds, the particle motion becomes increasingly localized and occurs only when the system has built up enough strain to trigger a rearrangement avalanche that reduces the energy of the system. In Fig. 5(f) we show a nearly crystalline state at Fp=4.0. The outer rows of particles have smectic-like ordering and do not form a close packed lattice with the inner rows of particles due to the curvature of the substrate.
Fig6.png
Fig.  6: (a-d) The velocity distributions P(|V|) vs |V| along with approximate power law fits (dashed) used to estimate the scaling. (a) Low density phases 0.0 < Fp < 2.5 under compression (blue) and decompression (gray). A fit to the intermediate values of the compression data gives an exponent τ = −2.79. (b) The stripe state with 1.45 < Fp < 1.55 (violet) and the void state with 2.28 < Fp < 2.38 (green). A fit to the tail of both distributions gives τ = −2.68. (c) The high density phase 2.5 < Fp < 10.0 under compression (blue) and decompression (gray). A fit to the tail of the compressed system gives τ = −2.78. (d) The dense triangular phase under compression in a quiescent period from 4.1 < Fp < 4.2 (violet) and during a row reduction event 8.0 < Fp < 8.1 (green). A fit to all of the data gives τ = −1.73.
In Fig. 6 we plot the velocity distribution P(|V|) versus |V|, where |V|=√{Vx2+Vy2}, on a log-log scale. The distribution is broad, and exhibits distinct scaling regimes produced by different particle behaviors. We plot the low and high Fp regimes separately since strong avalanche-like behavior is only observed during the row reduction transitions of the dense solid state. Since the compression is quasistatic, the particles are often motionless, particularly at high Fp. Velocities in the range 10−5 > |V| > 5 ×10⁻⁴ appear as dark blue particles in the images of Fig. 5, and undergo motion that is so small as to be negligible.
In Fig. 6(a) we plot P(|V|) in the range Fp < 2.5 for both compression and decompression. Both curves have a flat region for |V| < 10−3, an intermediate region 10−3 < |V| < 10−2 that may exhibit power law scaling, and a tail showing a suppression of high velocities. We fit the intermediate region of the compressed system to a power law, P(|V|) ∝ |V|τ, and obtain an exponent of τ = −2.79. For the expanding system, P(|V|) is systematically shifted to lower values compared to the compressed system, and the tail of the distribution falls off more rapidly. This is expected since the system does not exhibit sharp phase transitions at low Fp under decompression, and therefore the particles move at lower velocities. It is also consistent with the observation that the spikes in dE/dFp at low Fp are less frequent and of smaller magnitude under expansion than under compression. In Fig. 6(b) we plot P(|V|) for the most active portions of the compressed system. In the stripe phase, 1.45 ≤ Fp ≤ 1.55, the stripes are undergoing the thickening behavior illustrated in Fig. 5(a) in which slow elastic compression is interrupted by small plastic rearrangements. Here, P(|V|) is relatively low in the regime of negligible motion |V| < 10−4, has linear scaling over the range 10−3 < |V| < 10−2, and drops rapidly to zero for |V| < 10−2. This shape resembles that found for Fp < 2.5. In contrast, in the void regime with 2.28 < Fp < 2.38, P(|V|) is higher both at low and at high |V|. A fit to the entire tail of the distribution gives τ = −2.68.
In Fig. 6(c) we plot P(|V|) in the dense solid state from 2.5 < Fp < 10 for both compression and expansion. There is a distinct regime |V| > 2 ×10⁻⁴ over which a power law fit gives τ = −2.78. Compression and expansion produce nearly the same P(|V|) curves, although there is slightly more weight in the tail of the distribution under decompression. This is consistent with the behavior of dE/dFp in Fig. 4, where the expanding system has a larger number of higher magnitude spikes for Fp > 2.5. In Fig. 6(d) we plot P(|V|) for the compressed system in the range 4.1 < Fp < 4.2, where the particles are nearly crystalline and show no significant motion. There are no velocities higher than |V|=3 ×10⁻⁴, while the behavior at low |V| is the same as that observed over the entire range of Fp > 2.5. Figure 6(d) also shows P(|V|) for a row reduction transition over the range 8.0 < Fp < 8.1, where a power law fit to the entire distribution gives τ = −1.73. We find similar behavior for the other row reduction transitions that occur at Fp ≈ 4.3, 4.9, and 7.1. We analyzed a larger system with L=50.0 containing N=475 particles, and found similar velocity distributions. The dynamics of these transitions are shown fully in ESI+.
Fig7.png
Fig.  7: (a-c) Quadrupole defect formation under compression at Fp=2.28. (a) Particle location and velocity, with the same coloring as in Fig. 5. (b) The curl of the velocity field with particle velocity vectors. Blue indicates clockwise curl and red indicates counterclockwise curl. (c) The enstropy of the velocity field with particle velocity vectors, where dark regions indicate high enstropy. (d-f) The system under decompression at Fp=2.24, with the same coloring as above. (d) Particle location and velocity. (e) The curl of the velocity field with particle velocity vectors. (f) The enstropy of the velocity field with particle velocity vectors using the same colors previously described, but with different scaling.
Fig8.png
Fig.  8: (a-b) The velocity distribution P(Vx) of the quadrupole defects on a log-linear scale accumulated over a range ∆Fp=0.03 of substrate strength. (a) Fp = 2.28 (blue) under compression, as illustrated in Fig. 7(a-c), and Fp = 2.24 (gray) under decompression, as illustrated in Fig. 7(d-f). (b) Fp = 1.1 (blue) under compression, as illustrated in Fig. 9(b), and Fp = 1.0 (gray) under decompression, as shown in Fig. 9(d).
Fig9.png
Fig.  9: The curl ω illustrating the relative symmetry or asymmetry of quadrupole formation under (a-c) compression (C) and (d-f) decompression (D) for increasing Fp. Blue indicates clockwise rotation, red indicates counterclockwise rotation, and the color scale differs from panel to panel. (a) Fp=1.0. (b) Fp=2.8. (c) Fp=4.85. (d) Fp=1.0. (e) Fp=2.88. (f) Fp=5.15.
Although the range of scaling for the velocity distributions is too small to unambiguously determine whether a power law tail is present, we note that studies of the velocity distribution tails for 2D particle-based models of dislocation motion give power laws with exponents of τ = −2.0 to −2.5, where it is argued that exponents greater than τ = −2.0 indicate that collective events are important [40]. Additionally, 2D simulations of particle-based models of driven dislocations undergoing avalanches also produce velocity distributions that can be fit to a power law with τ = −2.5 [41]. In our work, we measure the velocity of the individual particles, and not that of dislocations in the packing; however, in the particle-based models of dislocation motion, the pairwise dislocation-dislocation interactions include competing attractive and repulsive terms.
In Fig. 7(a-c) we show the formation of a quadrupole-like defect in the void system under compression at Fp=2.28. In addition to the particle velocities, illustrated in Fig. 7(a), we analyze the particle motion by mapping it onto a velocity field. This allows us to estimate the spatial distribution of vorticity using the curl ω=∇×v, shown in Fig. 7(b), and the enstropy, or rotational kinetic energy, ϵ(ω) = [1/2] ω2, shown in Fig. 7(c). We overlay ω and ϵ with the particle velocity vectors to show the correlation between the field vorticity and the instantaneous particle motion. From ω in Fig. 7(b) we observe that cooperative particle motion produces a quadrupole-like defect. The compressive substrate force pushes a portion of the particles inward near the edge of the open void, decreasing the void size as shown in Fig. 1. The short-range attractive force causes the immediate neighbors of the moving particles to also move in their wake, whereas the long-range repulsive force pushes more distant particles away. Thus the competing interactions create a quadrupole-like defect that does not appear in similar simulations of purely repulsive particles [38]. These quadrupoles take the form of two combined defects, and have been previously observed in simulations of sheared particles where the defects were primarily located at the edge of the sample subjected to the largest applied shear  [42]. Our simulations suggest that even in the absence of shear, quadrupoles tend to form at the edges of the particle assembly where the local particle density is reduced. Typically, only a single quadrupole-like defect appears in the compressed system, not only in the void regime as shown in Fig. 7(a-c), but also in the stripe and dense solid regimes.
In Fig. 7(d-f) we show the formation of the void state at Fp=2.24 under decompression. The bulk outward flow of the particles suppresses plastic rearrangement and prevents the formation of isolated quadrupoles. Instead, the quadrupoles form in pairs, as shown in Fig. 7(e). In Fig. 7(d), the particle locations and velocity vectors indicate that the most rapid motion occurs at the edges of the newly forming voids, as shown by the green particles at the sample center and their light blue neighbors. Above and below this expansion front are particles that appear motionless, as indicated by their dark blue color. Alternating with the rapidly moving regions, and separated from them by the motionless particles, are groups of light blue particles that have a small inward velocity. In Fig. 7(e) we plot the curl of the velocity field and in Fig. 7(f) we show the corresponding enstropy using the same colors described in Fig. 7(a-c), but on a different scale. Under expansion, the quadrupole defects tend to form in symmetric pairs with opposite polarity. This occurs because the decompression is a more orderly process than compression, so all of the interior regions of the packing can reach the threshold for quadrupole formation simultaneously, rather than having just one location reach the quadrupole nucleation threshold prior to the rest of the sample due to the plastic flow that occurs under compression. The attractive interaction mediates the counter rotation at local length scales, while the long range repulsion produces cooperative motion across the sample, giving an ordered pattern of quadrupoles under decompression. The velocity vectors show that the inward velocities are quite small under expansion, producing only weak large scale vorticity in contrast to the strongly localized motion that generates strong local vorticity during compression. A similar distinction between large scale rotation and localized quadrupole defects was noted in the sheared system of Ref. 42.
In Fig. 8 we plot the velocity distributions P(Vx) over a force range of ∆Fp = 0.03 to highlight the asymmetry that appears in Vx when a single quadrupole defect forms. Figure 8(a) shows the void system under compression at Fp=2.28, as illustrated in Fig. 7(a-c), and under expansion at Fp=2.24, as illustrated in Fig. 7(d-f). The magnitude of Vx is much higher under compression, spanning the range −0.007 < Vx < 0.014, while the velocities in the expanding system fall within the range −0.002 < Vx < 0.002. Under compression, P(Vx) is heavily skewed toward positive Vx since the quadrupole defect forms at the right side of the void and triggers a net inward motion of particles. Similarly P(Vy) (not shown) is skewed toward positive Vy since the quadrupole forms below the void. Under decompression, P(Vx) is symmetric, consistent with the velocity vectors in Fig. 7(d). In Fig. 8(b) we plot P(Vx) under compression in the stripe phase for Fp = 1.1, as illustrated in Fig. 9(a), and under decompression for Fp = 1.0, as illustrated Fig. 9(d). Under compression P(Vx) is nearly symmetric, with a slight skew toward negative Vx due to the vortexlike motion on the lower left side of the sample in Fig. 9(a). P(Vx) is also nearly symmetric under decompression, with a slight skew to positive Vx values. These slight asymmetries are weak compared to those in the void state shown in Fig. 8(a), and indicate that it is possible to identify the presence of isolated quadrupole defects through the asymmetry the generate in P(Vx).
The stripe state under compression at Fp=1.10, shown in Fig. 9(a), contains a single strong vortex as described in Fig. 5(a). In contrast, the labyrinth state under decompression at Fp=1.0 exhibits plastic motion that produces a pair of quadrupoles, as shown in Fig. 9(d). There is a large vortex with quadrupole-like features in Fig. 9(b) under compression at Fp=2.8 where the sample transitions into an n=8 crystalline triangular lattice. The defect forms asymmetrically on one side of the sample due to the plastic rearrangements. In contrast, Fig. 9(e) shows that under decompression at Fp=2.88, pairs of weak quadrupoles form in a nearly crystalline n=8 state. Figure 9(c) illustrates the large scale motion that occurs under compression at Fp=4.85 when the system transitions to a nearly crystalline n=6 state, which is associated with a large negative spike in dE/dFp and collective particle motion. Under decompression at Fp=5.15, Fig. 9(f) shows that a pair of quadrupole-like excitations form. Such excitations are common at high confinements, and their formation is enhanced by the finite width of the particle packing.
Fig10.png
Fig.  10: Particle positions under compression in a larger system with L=50 containing N=475 particles. (a) A labyrinth stripe state at Fp=1.62. (b) The transition between stripes and voids at Fp=1.9. (c) A double row of voids at Fp=2.1. (d) A single row of voids at Fp=3.0. (e) A close-packed triangular solid at Fp=4.0. The supplementary materials fully illustrate the dynamics of compression [EIS+].
In addition to the L=36.5 sample containing N=256 particles considered above, we also we annealed and compressed N=475 particles in a sample of size L=50.0, using the same compression rate described above. In general, we find that the larger system is more disordered due to the diminished influence of the short range attractive forces across the system. In Fig. 10 we show the particle positions under compression in the L=50.0 sample At Fp=1.62 in Fig. 10(a), the stripe phase is less ordered, and it persists to higher Fp compared to the smaller sample since greater compression is required to bring the larger number of particles to a high enough local density to form voids. At Fp=1.9 in Fig. 10(b), the transition to the void state has begun, and we find two instead of one rows of voids. We expect that in larger systems would stabilize larger numbers of rows of voids, since annealed systems containing no substrate form a complete crystal of voids [4]. The fully formed double void state appears in Fig. 10(c) at Fp=2.1. The voids are oblong and lack a uniform shape and size. The particle structure is also disordered, resembling conjoined stripes more than a uniform lattice. As Fp increases, the local ordering of the particles increases, but the voids never become uniform in shape. At Fp=2.6, a transition to a single row of nonuniform voids occurs, as shown in Fig. 10(d) for Fp=3.0. The particles surrounding the voids form a defected triangular lattice. Like the stripe state, the void state persists to higher Fp in the larger system, and does not collapse into a dense triangular lattice until Fp=3.6, whereas the voids collapse at Fp=2.4 in the smaller system. We show the close packed triangular phase at Fp=4.0 in Fig. 10(e), where there is still a reduced density at the center of the system which disappears for higher Fp.

4  Summary

We have studied the compression and decompression in a time-dependent potential of a pattern-forming system of particles that interact via a short-range attractive force and a long-range repulsive force. As a function of increasing confinement, the system undergoes a series of dynamic rearrangements from clumps to stripes to voids, and finally forms a dense solid. The rearrangements occur via slow elastic motion interspersed with avalanche events of two types. Large avalanches are associated with structural changes from one type of pattern to another, while smaller avalanches occur during local structural rearrangements that consist of the motion of dislocations in the patterns. The velocity distributions during large avalanches exhibit strongly non-Gaussian features, and the tails of the distributions can be fit to power laws. At the highest compressions, the system forms a dense solid which becomes denser under further compression through a series of row reduction transitions. We compare the dynamically produced structures with those obtained by performing simulated annealing in a static confining potential of the same strength, and find that the annealed patterns are more ordered, indicating that the dynamical compression produces persistent metastable states.
When we decompress the fully compressed sample, we observe hysteresis in which the void, stripe, and clump states reappear at lower confinements for decompression than those at which they disappeared during compression. The morphology of some of the patterns is different during decompression due to the relative symmetry of tensile forces compared to the asymmetry of the compressive forces. We also find that the system undergoes fewer plastic rearrangements upon decompression than during compression. The particle velocity distributions indicate that higher speeds occur more frequently under compression, so the row reduction avalanches under compression are stronger than the row expansion avalanches that occur during decompression. We also observe a difference in the defects created under compression and decompression, with single quadrupole defects forming at the sample edge during compression and symmetric pairs of defects appearing in the center of the sample during decompression. Our work shows that it may be possible to control the morphology of the rich phases of a pattern forming particle system by using a confining trap to tune the system density. Such a procedure may allow the creation of metastable persistent phases that cannot be accessed in an equilibrium system.

  Acknowledgments

This work was carried out under the auspices of the NNSA of the U.S. DoE at LANL under Contract No. DE-AC52-06NA25396. The work of DM was supported in part by the U.S. DoE, Office of Science, Office of Workforce Development for Teachers and Scientists (WDTS) under the Visiting Faculty Program (VFP).

References

[1]
M. Seul and D. Andelman, Science, 1995, 267, 476.
[2]
A.D. Stoycheva and S.J. Singer, Phys. Rev. Lett., 2000, 84, 4657.
[3]
C.J. Olson Reichhardt, C. Reichhardt, and A.R. Bishop, Phys. Rev. Lett., 2004, 92, 016801
[4]
C.J. Olson Reichhardt, C. Reichhardt, and A.R. Bishop, Phys. Rev. E, 2010, 82, 041502.
[5]
A.D. Dinsmore, P.L. Dubin, and G.M. Grason, J. Phys. Chem. B, 2011, 115 7173.
[6]
H.J. Zhao, V.R. Misko, and F.M. Peeters, New J. Phys., 2012, 14 063032.
[7]
T. Das, T. Lookman and M.M. Bandi, Soft Matter, 2015, 11, 6740-6746
[8]
M.M. Fogler, A.A. Koulakov, and B.I. Shklovskii, Phys. Rev. B, 1996, 54, 1853.
[9]
E. Babaev and M. Speight, Phys. Rev. B, 2005, 72, 180502(R) .
[10]
L. Komendova, M.V. Milosevic, and F.M. Peeters, Phys. Rev. B, 2013, 88, 094515.
[11]
C.N. Varney, K.A.H. Sellin, Q.-Z. Wang, H. Fangohr, and E. Babaev, J. Phys.: Condens. Matter, 2013, 25, 415702.
[12]
G. Watanabe, T. Maruyama, K. Sato, K. Yasuoka, and T. Ebisuzaki, Phys. Rev. Lett, 2005, 94, 031101.
[13]
A.S. Schneider, D.K. Berry, C.M. Briggs, M.E. Caplan, and C.J. Horowitz, Phys. Rev. C, 2014, 90, 055805.
[14]
G. Malescio and G. Pellicane, Nature Mater., 2003, 2, 97; Phys. Rev. E, 2004, 70, 021202.
[15]
M.A. Glaser, G.M. Grason, R.D. Kamien, A. Kosmrlj, C.D. Santangelo, and P. Ziherl, EPL, 2007, 78, 46004.
[16]
E. Edlund and M.N. Jacobi, Phys. Rev. Lett., 2010, 105, 137203.
[17]
K. Nelissen, B. Partoens, and F. Peeters, Phys. Rev. E, 2005, 71 066204.
[18]
F.F. Munarin, K. Nelissen, W.P. Ferreira, G.A. Farias, and F.M. Peeters, Phys. Rev. E, 2008, 77, 031608.
[19]
Y.H. Liu, L.Y. Chew, and M.Y. Yu, Phys. Rev. E, 2008, 78, 066405.
[20]
L.Q. Costa Campos, S.W.S. Apolinario, and H. Löwen, Phys. Rev. E, 2013, 88, 042313.
[21]
D. McDermott, C. J. Olson Reichhardt, and C. Reichhardt, Soft Matter, 2014, 10, 6332.
[22]
C. Reichhardt, C.J. Olson Reichhardt, I. Martin, and A.R. Bishop, Phys. Rev. Lett., 2003, 90, 026401.
[23]
C. Reichhardt, C.J. Olson, I. Martin, and A.R. Bishop, Europhys. Lett., 2003, 61, 221.
[24]
J.-X. Chen, J.-W. Mao, S. Thakur, J.-R. Xu, and F.-Y. Liu, J. Chem. Phys., 2011, 135, 094504.
[25]
C. J. Olson Reichhardt, C. Reichhardt, and A. R. Bishop, Phys. Rev. E, 2011, 83, 041501.
[26]
X. B. Xu, H. Fangohr, Z. H. Wang, M. Gu, S. L. Liu, D. Q. Shi, and S. X. Dou, Phys. Rev. B, 2011, 84, 014515.
[27]
H. J. Zhao, V. R. Misko, and F. M. Peeters, Phys. Rev. E, 2013, 88, 022914.
[28]
A. Imperio, L. Reatto, and S. Zapperi, Phys. Rev. E, 2008, 78, 021402.
[29]
A. Chowdhury, B.J. Ackerson, and N.A. Clark, Phys. Rev. Lett., 1985, 55, 833.
[30]
Q.-H. Wei, C. Bechinger, D. Rudhardt, and P. Leiderer, Phys. Rev. Lett., 1998, 81, 2606.
[31]
L. Zaidouny, T. Bohlein, R. Roth and C. Bechinger, Soft Matter, 2013, 9, 9230.
[32]
M. Mielenz, J. Brox, S. Kahra, G. Leschhorn, M. Albert, T. Schaetz, H. Landa, and B. Reznik, Phys. Rev. Lett., 2013, 110, 133004.
[33]
S. Mavadia, J.F. Goodwin, G. Stutter, S. Bharadia, D.R. Crick, D.M. Segal, and R.C. Thompson, Nature Commun., 2013, 4, 2571.
[34]
S. Ulm, J. Roßnagel, G. Jacob, C. Degünther, S.T. Dawkins, U.G. Poschinger, R. Nigmatullin, A. Retzker, M.B. Plenio, F. Schmidt-Kaler, and K. Singer, Nature Commun., 2013, 4, 2290.
[35]
K. Pyka, J. Keller, H.L. Partner, R. Nigmatullin, T. Burgermeister, D.M. Meier, K. Kuhlmann, A. Retzker, M.B. Plenio, W.H. Zurek, A. del Campo, and T.E. Mehlstäubler, Nature Commun., 2013, 4, 2291.
[36]
A. Varshney, A. Sane, S. Ghosh, and S. Bhattacharya, Phys. Rev. E, 2012, 86, 031402.
[37]
P. Tierno, Phys. Rev. Lett., 2012, 109, 198304.
[38]
D. McDermott, C. J. Olson Reichhardt, and C. Reichhardt, Phys. Rev. E, 2016, 93, 062607.
[39]
J. Lekner, Physica A, 1991, 176, 485; N. Grønbech-Jensen, G. Hummer, and K.M. Beardmore, Mol. Phys., 1997, 92, 941; M. Mazars, J. Chem. Phys., 2001, 115, 2955.
[40]
F. Jafarpour, L. Angheluta, and N. Goldenfeld, Phys. Rev. E, 2013, 88, 042123.
[41]
M. Miguel, A. Vespignani, S. Zapperi, J. Weiss, and J. Grasso, Nature (London), 2001, 410, 667.
[42]
S. Biswas, M. Grant, I. Samajdar, A. Haldar, A. Sain, Sci. Rep., 2013, 3, 2728.
[EIS+]
Electronic supplementary information (ESI) available: Movie of the compression and decompression cycles. See DOI: 10.1039/c6sm01939k


File translated from TEX by TTHgold, version 4.00.
Back to Home