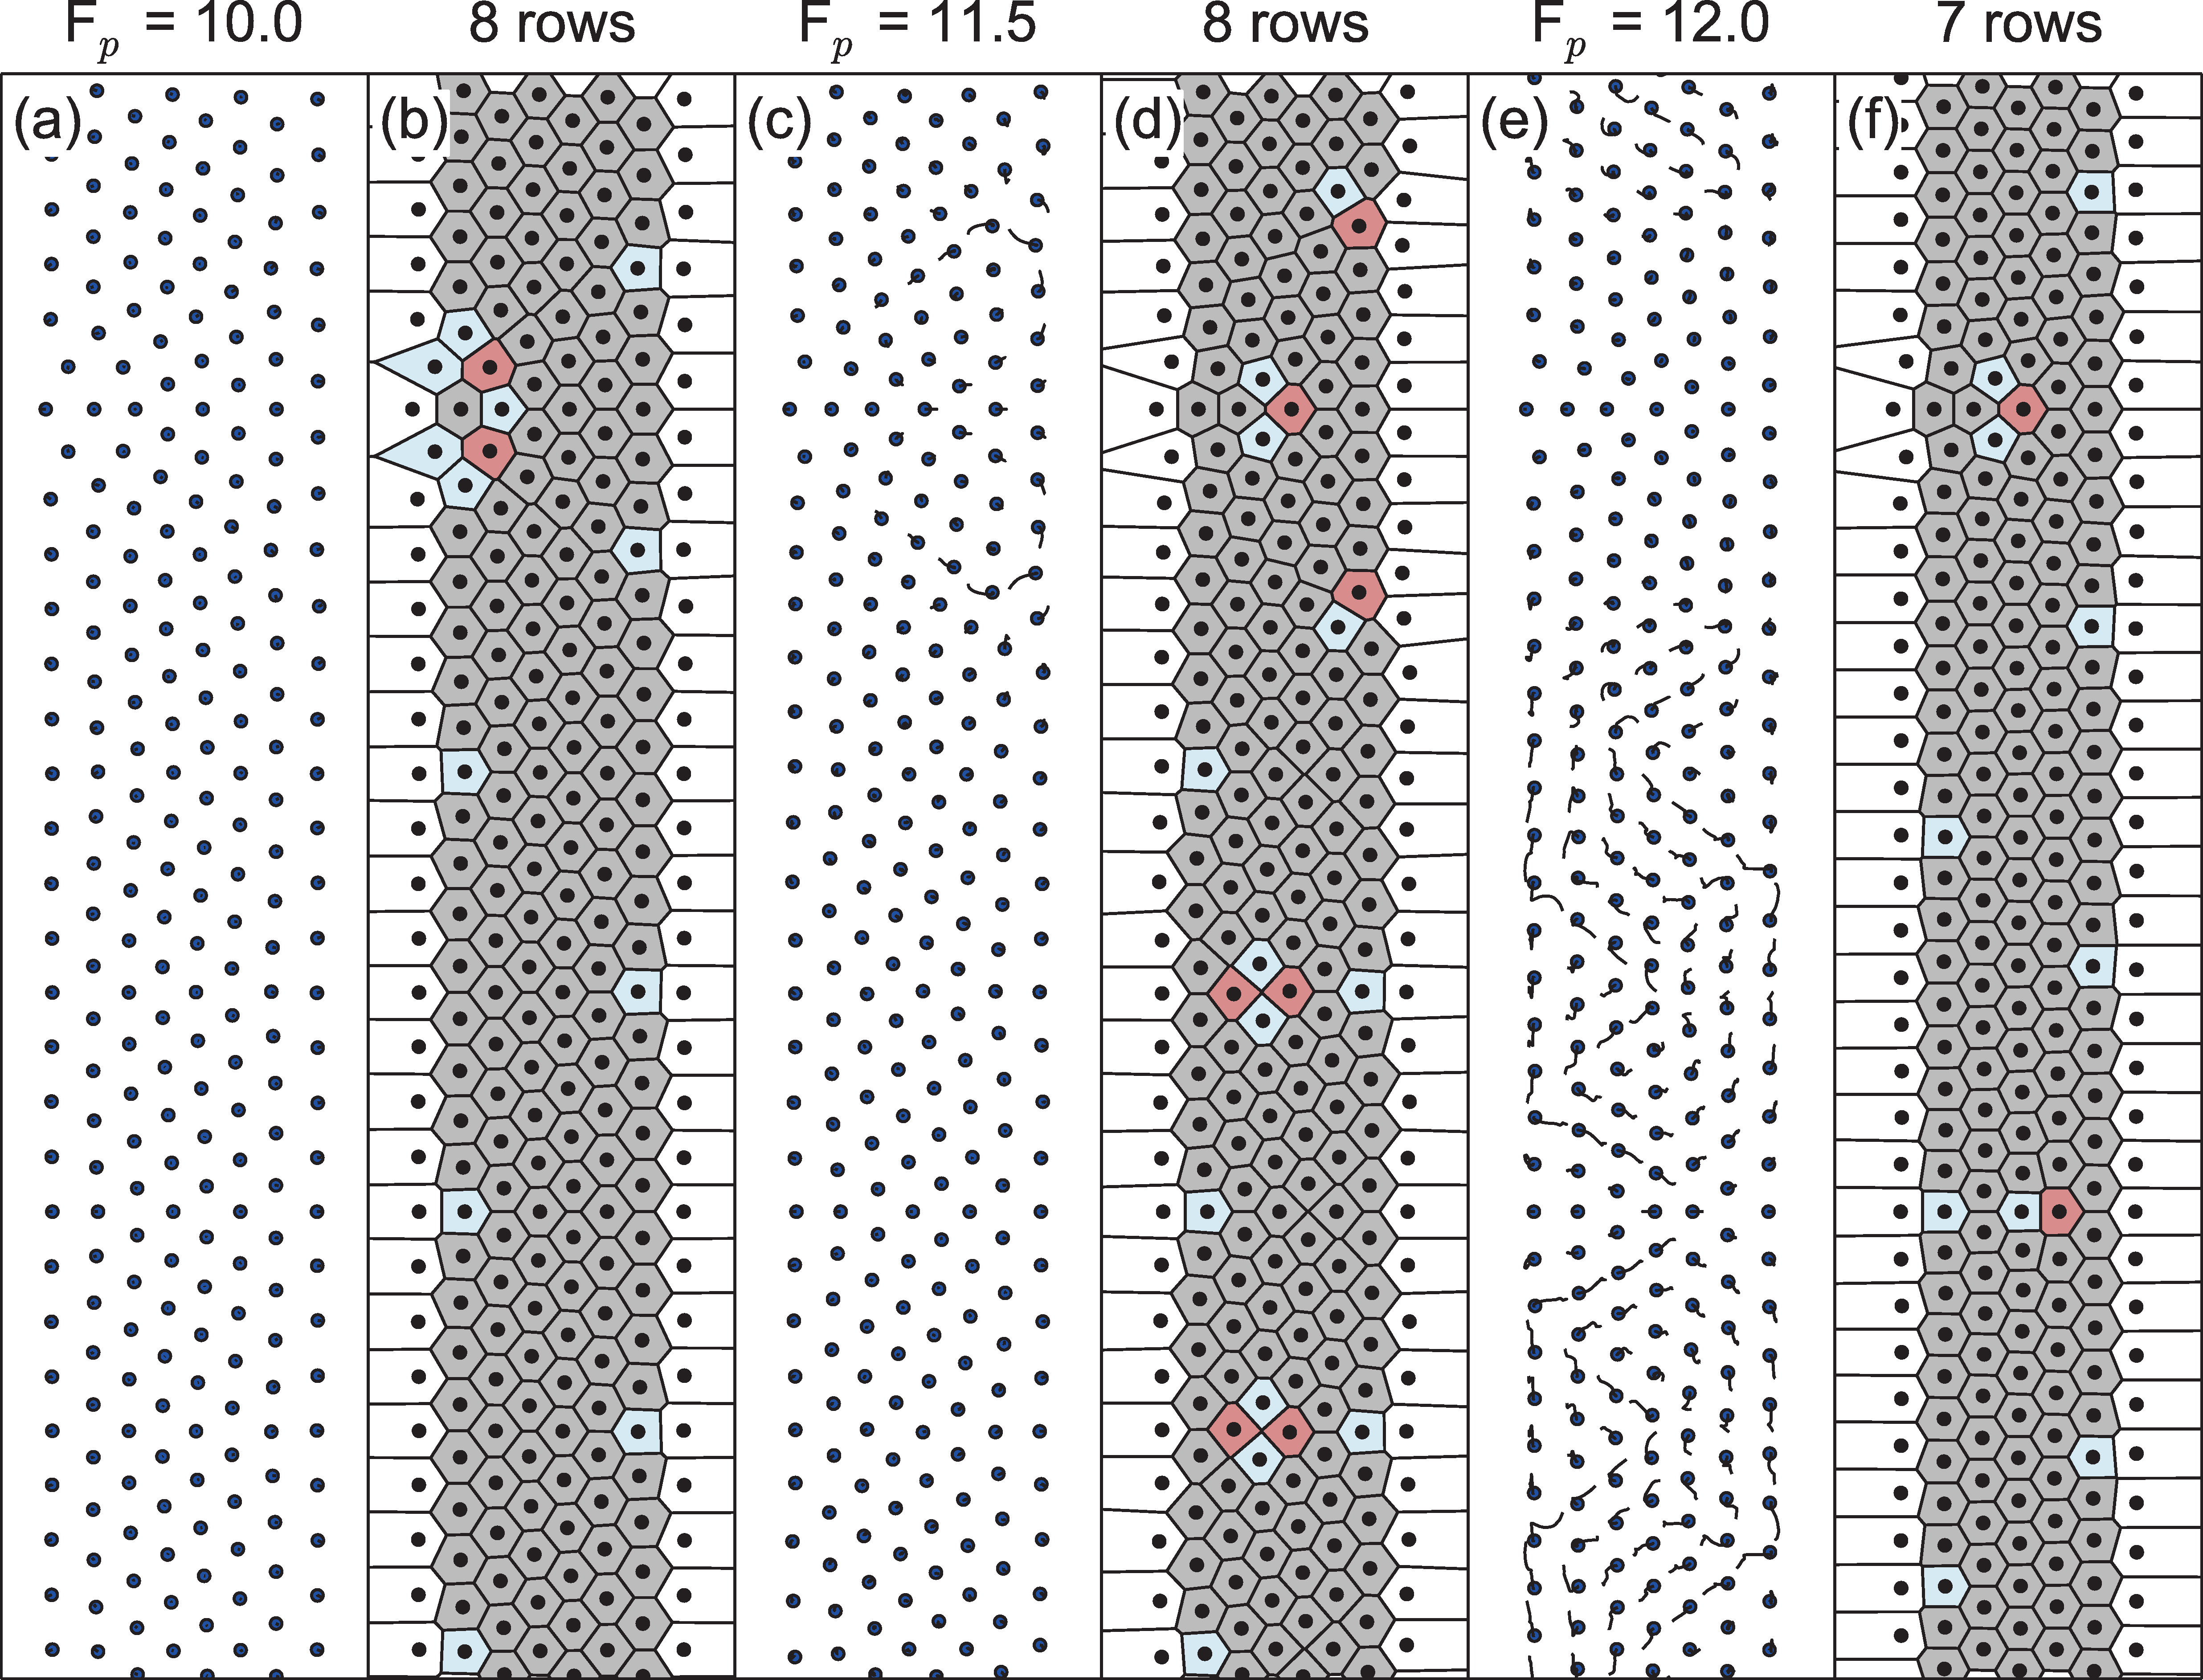
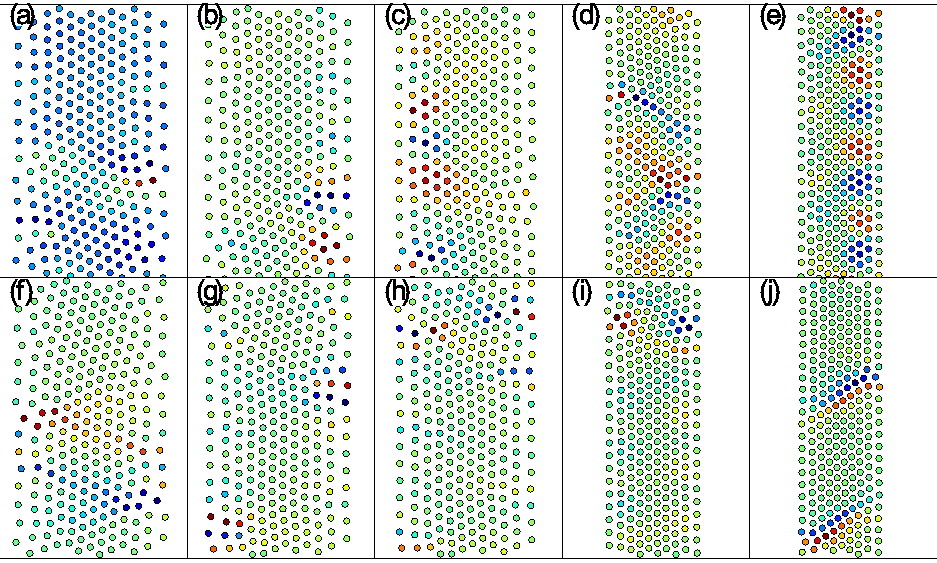
Physical Review E 93, 062607 (2016)

Avalanches, Plasticity, and Ordering in Colloidal Crystals Under Compression

D. McDermott1,2, C. J. Olson Reichhardt1, and C. Reichhardt1

1Theoretical Division, Los Alamos National Laboratory, Los Alamos, New Mexico 87545, USA
2Department of Physics, Wabash College, Crawfordsville, Indiana 47933, USA

(Received 14 July 2015; revised manuscript received 9 May 2016; published 13 June 2016)

Using numerical simulations we examine colloids with a long-range Coulomb interaction confined in a two-dimensional trough potential undergoing dynamical compression. As the depth of the confining well is increased, the colloids move via elastic distortions interspersed with intermittent bursts or avalanches of plastic motion. In these avalanches, the colloids rearrange to minimize their colloid-colloid repulsive interaction energy by adopting an average lattice constant that is isotropic despite the anisotropic nature of the compression. The avalanches take the form of shear banding events that decrease or increase the structural order of the system. At larger compression, the avalanches are associated with a reduction of the number of rows of colloids that fit within the confining potential, and between avalanches the colloids can exhibit partially crystalline or anisotropic ordering. The colloid velocity distributions during the avalanches have a non-Gaussian form with power law tails and exponents that are consistent with those found for the velocity distributions of gliding dislocations. We observe similar behavior when we subsequently decompress the system, and find a partially hysteretic response reflecting the irreversibility of the plastic events.
I. INTRODUCTION
II. SIMULATION AND SYSTEM
III. COMPRESSION
Velocity distributions
IV. ROW REDUCTION TRANSITIONS
V. DECOMPRESSION AND HYSTERESIS
VI. DISCUSSION
VII. SUMMARY
References


I.  INTRODUCTION

Collectively interacting colloidal particles are often used as model systems to investigate various features of equilibrium and non-equilibrium phenomena [1]. Due to their size scale, colloidal particles provide the advantage that microscopic information on the individual particle level can be directly accessed, something which is normally difficult or impossible in smaller scale systems such as nanoparticles, molecules, or atoms [2,3]. Additionally, there are various methods such as optical techniques [4,5] for controlling colloidal ordering and manipulating individual colloids. Examples of phenomena that have been studied with colloids include two-dimensional melting transitions [6,7], solid-to-solid phase transitions [8], glassy dynamics [3], commensurate and incommensurate phases [9,10,11,12], depinning behaviors [13,14,15,16], self-assembly [17,18], and dynamic sorting [19,20,21]. It is also possible to use colloids to study plastic deformation under shear in crystalline [22] or amorphous [23] colloidal assemblies. In crystalline materials, plastic deformations develop via the motion of dislocations which often occur in bursts of activity or avalanches [24,25,26,27,28]. Certain studies that may be difficult to undertake in other systems become feasible to perform with colloidal systems, such as observations of changes in the particle configurations and dynamics during compression. The relative softness of charge-stabilized colloidal assemblies makes it possible to perform compressional studies over a wide range of parameters and packing densities. In recent experiments, Varshney et al. [29] demonstrated that it is possible to create a quasi-two-dimensional colloidal raft system confined between two barriers, and to then compress or decompress the raft in order to dynamically change the packing density. In these experiments the colloid-colloid interaction was more complex than a simple repulsion, so that transitions from a loose-packed amorphous solid to a much denser but still amorphous solid were observed; however, during the compression, various plastic rearrangements occurred that produced hysteresis across the compression and decompression cycle [29].
There are also many examples of systems that undergo order-disorder transitions, including assemblies of repulsive particles in quasi-one-dimensional (1D) geometries such as a confinement between two walls. As the distance between the walls or the number of particles within the confining geometry changes, structural transitions occur that are associated with changes in the number of rows of particles that fit between the walls. When an integer number of rows can fit, the system is ordered, while for an incommensurate number of rows the system is disordered. Specific systems in which such effects have been studied include hard disks [30,31], Wigner crystals [32,33,34,35,36,37], particles with logarithmic interactions [38], colloidal systems [39,40,41,42,43,44], dusty plasmas [45,46,47], trapped ions [48,49,50], and superconducting vortices confined in strips [51,52].
Transitions in ordering under quasi-1D confinement have also been studied in the context of magnetically interacting particles, where the particle-particle interactions can be tuned using the magnetic field [53], as well as for Janus particles [54]. The different symmetries of the commensurate and incommensurate particle arrangements can strongly affect the melting and diffusion of the particle lattice under thermal fluctuations [55,56,57,58]. There have also been studies of binary particle assemblies in anisotropic traps [59,60,61] as well as the dynamics of particles flowing through quasi-1D arrays where the number of rows of particles that can move through a channel or constriction strongly affects the nature of the flow patterns [62,63,64,65,66]. For higher dimensional models of particles in anisotropic traps, order-disorder transitions can occur in one, two, or three dimensions [67,68,69]. Many of these studies focused on the equilibrium configurations that are obtained by varying the anisotropy of the confinement. It would be interesting to understand the nonequilibrium dynamics of how the particle lattice structure dynamically changes as the anisotropy of the confining potential is changed as a function of time.
It should be possible to create a two-dimensional (2D) system of repulsively interacting colloids that tend to form a triangular lattice, confine the system by barriers or an anisotropic trapping potential that can be dynamically changed to compress the colloidal assembly in one direction, and observe how the configuration changes under compression as the colloids rearrange in order to minimize the repulsive colloid-colloid interactions. For example, in numerical studies of confined charged particles in anisotropic traps, the particle configuration changes as a function of the trap width [70,71,72]. In simulations of hard disks confined by hard walls, variations of the packing density produce transitions due to strain from crystalline to smectic ordering [30,31]. In experiments on ion trapping systems where the ions are confined in a quasi-one-dimensional potential with a tunable strength, structural changes in the ion configuration were observed as the assembly was compressed and decompressed, such as a transition from a single row of ions to a zig-zag or kink state [73,74]. It should also be possible to create dynamical confining potentials or barriers for dusty plasma crystals [75].
In this work we numerically study a 2D system of colloids with long-range Coulomb repulsive interactions placed in a quasi-one-dimensional confining potential such that as the depth of the potential is increased, the colloidal assembly is compressed in one direction. Since the colloids can minimize their interaction energy by adopting a triangular ordering with equal lattice spacing in all directions, the colloids adjust their positions to make the local lattice structure as isotropic as possible during compression. Colloidal motion occurs both through slow elastic distortions and via abrupt avalanches in which plastic rearrangements occur. During the avalanche events, the average distance between nearest neighbor colloids increases. Dislocations can be created or annihilated at the sample surface during the plastic events, causing the colloids to move along shear bands. For high compression, we find that avalanches are associated with reductions of the number of rows of colloids that fit in the confining potential. Between the row reduction events, the colloids can adopt partial crystalline or anisotropic order. We also find that the colloid velocity distribution during the avalanche events is non-Gaussian with a power-law tail, and that the exponents are consistent with those observed for velocity distributions in 2D dislocation systems for the motion of individual or interacting dislocations [70,76,77]. Under decompression, we observe a similar set of dynamics and find some hysteresis between the compression and decompression cycles; however, there are no large-scale hysteretic effects since the particle-particle interactions are purely repulsive.
Fig1.png
Figure 1: (Color online) Under compression of an ordered triangular lattice, achieved by increasing Fp, the particle motion occurs through both slow elastic distortions as well sudden plastic events or avalanches that are associated with spikes or jumps in the following quantities: (a) N−1dE/dFp, the change in the particle configuration energy, vs Fp. (b) 〈dm〉, the average distance between nearest-neighbor particles, vs Fp. Inset: a blowup of the main panel showing that plastic events are associated with increases in 〈dm〉. (c) Ekin, the total kinetic energy of the system, vs Fp. (d) P6, the fraction of bulk six-fold coordinated particles, vs Fp. The gray dashed line across all panels corresponds to the event illustrated in Fig. 2.

II.  SIMULATION AND SYSTEM

We consider a two-dimensional assembly of colloidal particles interacting repulsively via a long-range Coulomb potential. We employ periodic boundary conditions in both the x- and y-directions for a system of size Lx ×Ly. We examine two simulation boxes, rectangular and square, in order to compare the dynamics when the annealed sample is an ordered triangular crystal (Ly=L=36.5 a0; Lx=L/1.097) versus a slightly distorted triangular crystal containing defects (Ly = Lx = L), where a0 is a dimensionless unit of length. Both samples contain N=256 colloids and a single trough potential which produces a force FPi = Fpcos(2πxi/Lx)x. As Fp is increased, the particles are forced closer together in the x-direction. The dynamics of a single colloid i are obtained by integrating the following overdamped equation of motion:
η d Ri

dt
= Ftoti = − N

ij 
V(Rij) + FPi  .
(1)
Here η is the damping constant, Ri(j) is the position of particle i(j), Rij = |RiRj|, and the particle-particle interaction potential is V(Rij) = q2E0/Rij, where E0 = Z*2/4πϵϵ0a0, q is the dimensionless interaction strength, Z* is the effective charge of the colloid, and ϵ is the solvent dielectric constant. We treat the long-range image interactions using a real-space Lekner summation method [78]. Lengths are measured in units of a0, time in units of τ = η/E0, and forces in units of F0 = E0/a0. We increase Fp in small increments of 0.001 over the range Fp=0 to 10 in the first part of the work, and in increments of 0.01 from Fp=0 to 100 in the second part of the work. For both force compression rates, the force is held constant at each value for a time ∆t = 2000 τ. During each increment we measure the total kinetic energy of the system Ekin=[1/2] ∑iNt=t0t0+∆t |vi (t)|2 along with the changes in the particle-particle interaction energy E=∑iNjiNV(Rij), the total energy of the system Etot=E+∑iNFpsin(2πxi/Lx), local ordering P6=N−1i=1Nδ(zi−6), where zi is the coordination number of particle i obtained from a Voronoi tessellation, and 〈dm〉 = N−1iNdmi, where dmi is the spacing between particle i and its nearest neighbor as identified from a Voronoi tessellation. We do not include particles along the sample edges in our measurement of P6 since they may have local order corresponding to six-fold coordinated particles without having six nearest neighbors.
Fig2.png
Figure 2: (Color online) The particle positions (colored dots) in the potential as an initially ordered triangular particle assembly is compressed along the x direction by increasing Fp. White particles are stationary, blue particles are slowly moving, and red particles are moving the most rapidly. (a) A highly anisotropic state at Fp = 3.10. (b) Plastic dislocation formation and depinning at Fp = 3.15. (c) Large scale motion at Fp = 3.20. (d) An isotropic nearly crystalline state at Fp = 3.25. See [81] for a movie of the entire compression sequence.

III.  COMPRESSION

In Fig. 1 and Fig. 2 we highlight behavior of an initially ordered triangular lattice under compression. In Fig. 1(a) we plot the change in the energy of the particle configuration N−1dE/dFp versus Fp. Figure 1(b) shows the corresponding 〈dm〉, the average spacing between nearest-neighbor particles, Fig. 1(c) shows the total kinetic energy Ekin, and Fig. 1(d) shows the fraction of six-fold coordinated bulk particles P6. In Fig. 2 we plot the particle positions and instantaneous velocity vectors which correspond to the gray dashed line in Fig. 1. Figure 3 shows particle positions and velocities for an initially slightly distorted triangular lattice during compression, which has behavior similar to that illustrated in Fig. 1 but with more noise in the measures (not shown).
For either initial condition, we find two distinct types of behaviors as the system compresses. Elastic distortions occur in the smoothly changing portions of dE/dFp and 〈dm〉, in the same regions where Ekin is close to zero. Sudden plastic events or avalanches are associated with peaks in dE/dFp, jumps in 〈dm〉, spikes in Ekin, and steps in P6. The particle configuration energy E increases with increasing Fp as the repulsively interacting colloids are forced together, which accounts for the overall positive value of dE/dFp. The cusp in dE/dFp near Fp = 1.0 appears when Fp becomes large enough that the particles can no longer spread to cover the entire sample but instead segregate into the bottom of the potential, with a particle-free region appearing at the potential maximum that becomes wider with increasing Fp. Once several major avalanches have occurred, there is no significant difference in the dynamics of the system regardless of whether it was prepared in an ordered or slightly distorted triangular lattice.
Fig3.png
Figure 3: (Color online) The particle positions (colored dots) in the potential as an initially slightly distorted triangular lattice is compressed along the x direction by increasing Fp. Colors are the same as in Fig. 2. (a) At Fp = 2.0, the motion is predominantly elastic. (b) At Fp = 2.5, an avalanche occurs in the form of shear bands. (c) At Fp = 4.8 the avalanche activity is more localized. (d) At Fp = 6.6 only elastic motion occurs. (e) At Fp = 7.2 there is a large avalanche. (f) At Fp = 8.0 there is very little net motion, but arrows indicate that groups of particles move collectively over very short distances. Arrow color is chosen to provide contrast, not indicate physical properties. See [82] for a movie of the entire compression sequence.
Fig4.png
Figure 4: (Color online) Particle velocities, indicated by arrows, and curl, indicated by color, where red is strong negative curl and blue is strong positive curl as shown on the color bar. (a) At Fp=4.71 there is a single moving dislocation during defect depinning. (b) Fp=4.80. (c) Fp=7.18. (d) Fp=7.20.
Fig5.png
Figure 5: (Color online) Velocity distributions P(|V|) with log binning plotted on a log-log scale during an entire row reduction transition. (a) P(|V|) for the 10-9 row reduction transition (blue) for 4.58 ≤ Fp ≤ 4.95 and for the 9-8 row reduction transition (red) for 7.17 ≤ Fp ≤ 7.24. Dashed lines indicate power law fits to the velocity tails with exponents τ = 2.32±0.01 for the 10-9 transition and τ = 2.31±0.02 for the 9-8 transition. (b) P(|Vinst|) taken over short time periods at Fp = 4.71 (blue), 4.80 (black), 7.18 (red), and 7.20 (green), corresponding to the illustrations in panels (a-d). Only the Fp = 4.71 curve has sufficient data in the tail region to perform a power law fit, which has exponent τ = 2.12 ±0.02
The spikes in dE/dFp generally have negative values, indicating that they are associated with drops in the configuration energy. The plastic events are also associated with an increase in the average spacing between nearest-neighbor particles, as shown in Fig. 1(a,b) where negative spikes in dE/dFp correlate with positive jumps in 〈dm〉. The inset in Fig. 1(b) shows a blowup of the plastic event near Fp = 3.2 to better highlight the discrete nature of the jumps in 〈dm〉. Since the colloid-colloid interactions are repulsive, the configurational energy increases under compression as the particles elastically approach each other along the compressed direction, while during the plastic avalanches, the closest spacing between particles increases so that the configurational energy is reduced. In Fig. 1(c) the peaks in Ekin indicate that significant particle motion only occurs during the avalanches. The initial configuration is a perfect lattice, so initially P6=1 in Fig. 1(d). Spikes and steps in P6 occur when dislocations, which have fivefold or sevenfold rather than sixfold coordination, are created or annihilated during an avalanche. A sharp drop to P6=0.92 appears when the first dislocations form in the system. For Fp < 2.2, compression proceeds uniformly with increasing Fp and the particles change configurations relatively rapidly, producing noisy signals in P6 and Ekin. For Fp ≥ 2.2, free particle rearrangements are suppressed and P6 exhibits a series of steps separated by jumps corresponding to avalanche events.
In the avalanches illustrated in Fig. 2 and Fig. 3, red particles move significantly during the compression increment, white particles are motionless, and blue particles experience little motion. In Fig. 2 we show the behavior in a sample prepared in an ordered triangular lattice, highlighting a major avalanche at Fp ≈ 3.2. In Fig. 2(a), the sample is highly anisotropic at Fp = 3.10. In Fig. 2(b), plastic dislocation formation and depinning occur at Fp = 3.15. In Fig. 2(c) we observe large scale motion at Fp = 3.20. Finally, in Fig. 2(d), at Fp = 3.25 there is a healing back to an isotropic crystal structure. The avalanche can be seen clearly in the measures of Fig. 1 where there are large sudden spikes in the energy measures, an increase in the average interparticle spacing, and a large increase in the number of sixfold-coordinated particles. Figure 2 illustrates a full row reduction transition, which occurs when the outside rows have roughly the same number of colloids. We also observe other small scale avalanches that lead to the thinning of the outer rows due to the shape of the soft confining potential. The dynamics of the edge thinning, illustrated in Fig. 2(a) and Fig. 3(a), can be observed in the Supplementary movies [81]. These small scale avalanches are triggered by a competition between particle-particle interaction energy and the spatially varying substrate potential. Such small particle rearrangements were not observed in simulations of hard disks compressed by hard walls since the walls constrain the edge particle locations [30,31].
Figure 3(a) shows the state near Fp = 2.0 in a sample prepared with an initially slightly distorted triangular lattice for an interval in which there are no spikes or jumps in the quantities plotted in Fig. 1, indicating that the particles are undergoing elastic motion. Here the particles are arranged in twelve vertical rows. The avalanche near Fp=2.5 is shown in Fig. 3(b) where the particles transition from twelve to eleven vertical rows. Here, motion occurs in localized bands, indicative of a shear banding effect. These bands generally form zig-zag patterns, and there are also regions undergoing local rotation. Figure 3(c) illustrates another avalanche interval near Fp = 4.8, where similar shear banding motion appears. In this case, there is considerable motion of the particles on the outer edges of the sample and the particles transition from ten to nine vertical rows. Figure 3(d) shows another elastic region near Fp = 6.6 where there is little motion. Near Fp = 7.2, a large plastic event occurs, as illustrated by the bands of motion in Fig. 3(e), as the system transitions from nine to eight rows. For 7.2 < Fp < 10, the system behaves elastically, as shown in Fig. 3(f) for Fp = 8.0 where little motion occurs. Further compression of the system beyond Fp=10 is described in Section IV.

  Velocity distributions

We next examine histograms of the particle velocities at different values of Fp over which row reduction transitions occur. In Fig. 4(a-d) we highlight with arrows the velocities |V|=√{Vx2+Vy2} of each particle in the system, averaged over ten subintervals of δFp=0.01, and also show the local vorticity which is measured using the curl ω = ∇×v. At Fp=4.71 in Fig. 4(a), there is an avalanche event associated with regions of strong positive and negative curl, where defect depinning occurs at the sample edge. Figure 4(b) shows that at Fp=4.8 there is a small amount of motion in the system but no strong curl events. The rearrangements at Fp=7.18 and Fp=7.20 are shown in Fig. 4(c,d), respectively, where there are regions of negative rotation separated by regions of positive rotation, and the particles move in bands. The corresponding E in these force regions, shown at points (iii) and (v) in Fig. 1(a), has large negative spikes, characteristic of systematic particle rearrangements.
In intervals where there are no plastic events, the motion is elastic and is confined in the compression direction. The velocity distributions in these intervals are wider in the x-direction than in the y-direction but are very sharply peaked. In contrast, during intervals containing avalanches, the velocity distributions in the x- and y-directions are almost the same and have a strongly non-Gaussian broad tail. In Fig. 5(a) we plot the velocity distribution P(|V|) on a log-log scale for the range 4.58 < Fp < 4.95, during which a large avalanche occurs. Following the power law fitting procedure described in Ref. [79], we bin the data logarithmically and obtain a minimum value, Vmin, for best fitting the distribution tail by calculating the minimal Kolmogorov-Smirnov distance. The dashed line in Fig. 5(a) is a power law fit to P(|V|) ∝ |V|−τ with τ = 2.32 ±0.01. In the range 4.58 ≤ Fp ≤ 4.95, there is a transition from a mostly triangular lattice with 10 vertical rows of particles to another mostly triangular lattice with 9 vertical rows of particles, and the system is partially disordered during the avalanche event that occurs during this transition. Figure 5(a) also shows P(|V|) for the interval 7.17 ≤ Fp ≤ 7.24 during which there is a transition from 9 vertical rows of particles to 8 vertical rows. In this case, Vmin is larger and τ = 2.31 ±0.02.
We note that the form of the distribution depends on the time over which we average the velocities during an avalanche. In Fig. 5(b) we show the distribution functions for instantaneous velocities P(|Vinst|) obtained at Fp=4.71, 4.8, 7.17, and 7.2, showing that the characteristics of the short-time velocity distributions can vary. We fit a power law to the event at Fp=4.71 and find an exponent of τ = 2.12 ±0.02.
Fig6.png
Figure 6: (Color online) A heightfield plot of P(|V|) vs Fp, where, as indicated by the scale bar, light values of |V| occur with high frequency while blue (dark) values of |V| occur with low frequency. The total height of each vertical column indicates the maximum range of |V| for that value of Fp. The maximum value of this range gradually increases with increasing Fp.
Previous studies of sheared crystalline materials showed that avalanches are associated with the motion of dislocations [24,25,26,27,28,70,76,77], and that various quantities such as the dislocation velocities are power-law distributed in the avalanche regime. We consider the particle velocities instead of the dislocation velocities in our system; however, due to the partial crystalline order of our sample, avalanches are generally associated with the motion of dislocations. In the dislocation dynamics studies, the high velocity tails of the velocity distributions can be fit with power law exponents of τ = −2.5 [70] and −3.0 [76]. Recent computational and theoretical work showed that in 2D, a single dislocation has a power-law distributed velocity with τ = −2, while when collective effects are important, larger exponents of τ = −2.4 appear [77]. In our case, as dislocations move through the system, individual particles temporarily translate along with the dislocations, so that over sufficiently short time windows the overall form of the velocity distributions of the particles and the dislocations should be similar. It is difficult to extract the exact exponents for our system due to the finite width of the sample and the fact that some avalanches are associated with only one moving dislocation while others contain multiple moving and interacting dislocations. The width of the distribution is also dependent on the packing fraction. As the particle density increases, the maximum possible particle velocity also increases. Since the motion is dominated by the flow of dislocations, this increase in the maximum possible particle velocity does not scale with the increased interparticle force, but instead is related to the inter-dislocation force which includes both attractive and repulsive terms. Thus the maximum particle speed increases with increasing dislocation density. This is shown in Fig. 6 where we plot a color height map of P(|V|) versus Fp for intervals of δFp=0.1, highlighting the maximum extent of the high-velocity tails of the distributions. As Fp increases, the particle packing density increases and the maximum achievable particle velocity also increases significantly.
Fig7.png
Figure 7: (Color online) N−1dE/dFp and P6 vs Fp for a system subjected to a maximum compression of Fp = 100. The density of avalanches is much lower for Fp > 10 than in the Fp < 10 regime already discussed, and the avalanches at higher Fp are associated with a partial or complete reduction in the number of rows of particles in the system.
Fig8.png
Figure 8: (Color online) (a) Particle locations in a portion of the sample at Fp=10 showing that there are eight rows of particles. (b) The corresponding Voronoi tessellation indicates strong triangular ordering. Polygon colors indicate the coordination number of the particle at the center of the polygon: 4 (dark blue), 5 (light blue), 6 (grey), or 7 (red). (c) Particle locations and trajectories in a portion of the sample during an avalanche event at Fp = 11.5. (d) The corresponding Voronoi tessellation shows the formation of dislocations has destabilized the system. (e) Particle locations and trajectories in a portion of the sample at Fp = 12.0 where there are now seven rows of particles. (f) The corresponding Voronoi tessellation shows a higher degree of triangular ordering.
Fig9.png
Figure 9: (Color online) (a) Particle locations and trajectories in a portion of the sample at Fp=39, where there are six rows of particles. (b) The corresponding Voronoi tessellation with the same coloring convention as in Fig. 8. (c) Particle locations and trajectories in a portion of the sample after an avalanche at Fp=39.5. There are now five rows of particles. (d) The corresponding Voronoi tessellation shows the increased local particle ordering.
Fig10.png
Figure 10: (Color online) (a) Particle locations and trajectories in a portion of the sample at Fp=80, where there are five rows of particles. (b) The corresponding Voronoi tessellation with the same coloring convention as in Fig. 8. (c) Particle locations and trajectories in a portion of the sample after an avalanche at Fp=85. There are now four rows of particles. (d) The corresponding Voronoi tessellation.

IV.  ROW REDUCTION TRANSITIONS

In Fig. 7 we plot simultaneously the derivative of the total energy dEtot/dFp and P6 versus Fp as the sample is compressed all the way to Fp=100. The density of avalanche-induced peaks is much smaller for Fp > 10 than for Fp < 10, while the avalanche jumps at higher Fp values clearly coincide with sharp changes in P6. In general, plastic avalanche events that occur for Fp > 10 are associated with a partial or complete reduction of the number of rows of particles that fit across the potential well.
In Fig. 8 we illustrate the row reduction transition which occurs between Fp = 10 and Fp=12 via a plastic avalanche event, as indicated by the spikes in Ekin and dEtot/dFp. In Fig. 8(a) we show the particle positions in a portion of the sample at Fp=10, with the corresponding Voronoi tessellation indicating the coordination number of each particle plotted in Fig. 8(b). Here, eight rows of particles fit across the potential well and the system has significant triangular ordering as indicated by the Voronoi tessellation. The system also contains edge defects, indicated by the light blue five-sided Voronoi polygons, where the edges buckle to accommodate changes in the lattice spacing. In Fig. 8(c,d), we illustrate the particle positions, trajectories, and Voronoi tessellation at Fp=11.5. Since a small avalanche event occurs at this value of Fp, small motions of the particles are visible in the trajectories. The Voronoi tessellation shows that the motion occurs close to dislocation pairs located next to the sample edges, where the particle configurations are less stable. At Fp=12 a larger avalanche occurs, as illustrated by the correlated bands of particle motion in Fig. 8(e) and the Voronoi tessellation in Fig. 8(f). The local ordering increases during this avalanche, as shown in Fig. 8. Similar events occur at higher Fp values, where jumps in P6 indicate that dislocations have formed or healed.
Fig11.png
Figure 11: (Color online) Hysteretic response measurements in the system initially prepared in a slightly distorted triangular lattice. Blue curves are obtained during the initial increasing sweep of Fp, and gray curves are from the decreasing sweep in which Fp is reduced back to zero. (a) P6 vs Fp. (b) ρx vs Fp.
Fig12.png
Figure 12: Images illustrating the hysteretic behavior of the sample shown in Fig. 11(c) over the range Fp=1.5 to Fp=4.0. Particle positions are colored by Vx, and are scaled within each image to maximize the features. Blue particles have relatively large negative Vx, green particles move slowly, and red particles have relatively large positive Vx. In (a-e) the system is being compressed while in (f-j) the system is being decompressed. (a,f) At Fp = 1.5 there are roughly 13 rows of particles that are not fully oriented along the y axis. (b,g) At Fp = 1.6 there is a mixture of vertical and diagonal rows of particles, accommodated by edge dislocations. There are 13 rows of particles during compression in panel (b), while there are only 12 rows of particles during decompression in panel (g). (c,h) A similar mixture of vertical and diagonal particle rows appears at Fp = 1.7. (d,i) At Fp = 3.2 the rows have become fully vertical, and there are 11 rows during compression but only 10 during decompression. (e,j) At Fp = 4.0, there are 10 rows during compression and 9 rows during decompression.
Fig13.png
Figure 13: (Color online) P(|V|) for the compressed system from Fp=3.0 to 3.2 (blue circles) and Fp=4.0 to 4.2 (black circles) and the decompressing system from Fp=4.2 to 4.0 (green circles) and Fp=3.2 to 3.0 (red circles). The heavy tailed distributions for the compressed system from Fp=3.0 to 3.2 and the decompressed system from Fp=4.2 to 4.0 are fit to the power laws indicated by the dashed blue and green lines, respectively; the other P(|V|) curves lack similar heavy tails.
In some cases, the number of rows is not reduced uniformly through the entire system in a single avalanche; instead, in a system with n rows, a portion of the system collapses to n−1 rows during one avalanche event, and then at a slightly higher value of Fp a second avalanche event completes the row reduction process. A multi-step row reduction process of this type is illustrated in Fig. 9, where we show the particle positions and trajectories along with the Voronoi tessellation near the Fp = 40 avalanche in Fig. 7 during which the number of rows decreases from six to five. The Voronoi tessellation in Fig. 9(b) shows that at Fp=39 there are two competing structural phases: rhomboidal ordering with six rows of particles, and triangular ordering with five rows of particles. Edge defects occur in the triangularly ordered region, as in Fig. 8, but not in the rhomboidal region. In Fig. 9(c,d) at Fp = 39.5, the transition to five rows of particles is completed. The outer rows of particles tend to slide past their neighboring rows in Fig. 9(c), while there are small diagonal particle trajectories in the sample bulk corresponding to the glide of dislocations. In Fig. 9(d), alternating edge defects are distributed along the entire sample length but are not uniformly spaced, causing the system to continue to undergo small relaxations with increasing Fp that increase the ordering to P6=0.91 when Fp=40.
For 40 < Fp < 80, the system retains five rows of particles; however, there are still avalanche events associated with shifts between different partially crystalline five-row structures. We observe a high degree of ordering of the bulk particles, reaching P6 = 0.97 in the range 65 < Fp < 70, before the system undergoes a row reduction transition just above Fp = 80. To illustrate the row reduction from five to four rows, we plot the particle locations, trajectories, and Voronoi tessellation in Fig. 10(a,b) at Fp = 80. There are two buckled regions in which only four rows of particles span the system, while the rest of the sample remains five rows wide, indicating that row reduction avalanches occur incrementally at high compressions. In the range 80 < Fp < 85, several small avalanches occur that reduce the amount of the sample that contains five rows. In Fig. 10(c,d) we show the particle positions, trajectories, and Voronoi tessellation at Fp = 85. Here there are four rows of particles and defects condense into pairs spaced along the sample length. No further row reductions occur up to Fp=100.

V.  DECOMPRESSION AND HYSTERESIS

To explore hysteretic effects, once the system is fully compressed to Fp = 10, we gradually decompress the sample by decrementing Fp back to zero, using the same sweep rate for Fp as during the original compression. We find that, just as during compression, under decompression the system undergoes combinations of slow elastic distortions interspersed with sudden avalanche rearrangement events. See [83] for a movie of the entire decompression sequence. In Fig. 11(a) we plot P6 versus Fp for the compression and decompression cycles in a sample where the maximum compression value is Fp=10. Figure 11(a) shows that the P6 curves for compression and decompression overlap completely above Fp  ∼ 8.5 where there are no avalanche events, indicating that the system is behaving reversibly. Avalanche events are completely suppressed during the decompression until Fp has decreased to Fp=6.0, where the first large dip in P6 occurs. During this event, a number of dislocations enter the system and the average spacing between the colloids increases. In general we observe fewer plastic events during the decompression cycle than during compression; however, the plastic events that do occur during decompression tend to be larger. Two large plastic decompression events appear at Fp = 4.0 and Fp=2.6, marked by dips in P6. We find no systematic trend in the hysteresis such as P6 always being higher for one direction of the compression cycle. Instead, the plastic avalanches occur at different values of Fp for each driving direction, indicating the irreversibility associated with the plasticity in this system. The lack of systematic hysteresis is different from the behavior observed for compression-decompression cycles in colloidal raft experiments [29]. In those experiments, the particle-particle interactions had both repulsive and attractive components, so that during the initial compression the particles could be captured by the attractive portion of the interparticle potential. In contrast, in our system all of the particle-particle interactions are smoothly repulsive. Simulations of applied strain on hard disks confined by hard walls produce reversible plastic deformations [30]. This differs from our system since the soft particles and soft confining potential we consider permit density variations at the sample edges which lead to different barriers for dislocations to move toward or away from the edges.
Figure 11(b) shows ρx, a scalar measure that examines the symmetry in compression force about the center of the trough,
ρx = 1

Lx Ly
N

i 


j < i 
|(

F
 

ij 
)x| (

r
 

ij 
)x
(2)
plotted versus Fp for both compression and decompression. Here |Fij| is the absolute value of the interparticle force between particles i and j and rij is their relative separation. There is no significant difference between the compression and decompression values of ρx over the range Fp ≥ 8.0, but we find significant hysteresis for Fp < 8.0. For Fp < 1.8, the ρx signal is noisy under both compression and decompression. At very low Fp, the particles are spread out across the entire sample, with no gap. At Fp=0.9, a particle-free gap opens at the location of the potential maximum, and the particles form rows that are rotated by a finite angle from the y direction, as shown in Fig. 12(a,f). This diagonal ordering reduces the energy of the system by minimizing the compression of the lattice, but when Fp ≥ 1.8 the small energy advantage is lost and the particles transition to a vertical row structure of the type shown in Fig. 12(d,i) that is aligned with the direction of the confining potential.
For 1.8 < Fp < 8.0, ρx remains hysteretic but is no longer noisy; instead, the curve is smooth with distinct jumps, indicating the hysteresis in the value of Fp at which the number of rows in the sample is reduced during compression or increased during expansion. The row transitions are marked by labeled arrows in Fig. 11(b), where we observe an average offset of ∆Fp  ∼ 0.7 between the reduction in the number of rows from n to n−1 upon compression and the increase in the number of rows from n−1 to n upon decompression, with the transition during compression falling at a higher value of Fp. For example, the 11-10 transition during compression occurs at Fp = 3.2 while the 10-11 transition during decompression occurs at Fp = 2.7. Despite the fact that the number of vertical rows of particles differs by one between compression and decompression, there is a negligible difference in the total width of the particle assembly. This indicates that the interparticle separation during compression is smaller overall, particularly in the x-direction, than that of the decompressing system. During decompression, the particle velocity distributions in the elastic regimes and during avalanches have the same features described above for compression.
In Fig. 12(a-j) we show differences in the formation and motion of defects during compression and decompression at the same applied Fp. In Fig. 12(a-e) the system is being compressed, while in Fig. 12(f-j) it is being decompressed. We color the particles by Vx, the component of their velocity in the x-direction, to illustrate that under compression, multiple defects typically form on one side of the system prior to an avalanche burst. In contrast, during the decompression, pairs of dislocations form on opposing sides of the system permitting larger avalanches to occur. At Fp = 1.5, shown in Fig. 12(a,f), there are roughly 13 rows of particles that are not oriented along the y axis. In Fig. 12(b,g) at Fp = 1.6, there is a mixture of vertical and diagonally oriented rows of particles accommodated by edge dislocations. There are 13 rows of particles during compression in Fig. 12(b), but only 12 rows during decompression in Fig. 12(g). Similar structure appears for Fp = 1.7 in Fig. 12(c,h). At Fp = 3.2 in Fig. 12(d,i), the rows of particles are essentially vertical, and there are 11 rows of particles during compression in Fig. 12(d) but only 10 rows during decompression in Fig. 12(i). In Fig. 12(e,j) at Fp = 4.0, the compressing state has 10 rows of particles while the decompressing state has only 9 rows.
Figure 13 shows the log-scale plot of P(|V|) during the compression and decompression cycles over the range 3.0 < Fp < 3.2 and 4.0 < Fp < 4.2. Under compression for 3.0 < Fp < 3.2 the velocity distributions are clearly non-Gaussian, and the power-law fit of P(|V|) gives an exponent of τ = −3.18 ±0.08. The motion is elastic under compression for 4.0 < Fp < 4.2, and the velocity distributions are much sharper and lack a heavy tail. In contrast, during decompression over the range 4.2 > Fp > 4.0, the tail of the distribution can be fit to a power law with an exponent of τ = −2.06 ±0.01. The velocity distribution of the elastic decompression regime 3.2 > Fp > 3.0 is quite similar to that found for elastic compression from 4.0 < Fp < 4.2.
Fig14.png
Figure 14: The locations of peaks in the Fx (red open circles) and Fy (black closed circles) curves for ten realizations of the simulation. (a) Samples that were thermally annealed prior to compression and then subjected to a compression rate of δFp = 0.01. (b) Samples that were thermally annealed prior to compression and then subjected to a compression rate of δFp = 0.001. (c) Samples that were not thermally annealed prior to compression and then subjected to a compression rate of δFp=0.001.
Our general results, particularly for confinement forces Fp > 10, are not sensitive to initial conditions or compression rate. In Fig. 14 we plot the locations of the peaks in Fx and Fy versus Fp for ten different realizations of our system, each initialized with a different random seed. Here Fx and Fy are the average transient force response of a single probe particle i in the two directions Fx=∑t=t0t0+∆tFtoti(t) ·x and Fy=∑t=t0t0+∆tFtoti(t) ·y, where Ftoti(t) is the total force on the selected particle at time t. The samples in Fig. 14(a,b) were annealed from a high temperature prior to compression, while the samples in Fig. 14(c) were compressed starting from a randomly produced configuration of particles. The compression rate is δFp=0.01 in Fig. 14(a) and δFp=0.001 in Fig. 14(b,c). There is a high density of peaks below Fp = 10, and the specific peak locations in this regime tend to vary from run to run since, for low Fp, the particles are more widely spaced and are better able to sample different configurations as they are compressed. At compressions of Fp=10 and above, the samples exhibit distinct coincident avalanches at forces Fp ≈ 12, 20, 38, 80, indicating the emergence of well-defined energy barriers for particle rearrangements that do not vary significantly from realization to realization.

VI.  DISCUSSION

We have studied the behavior of athermal particle assemblies. Inclusion of a finite temperature would introduce thermal noise that would affect the onset and magnitude of the large scale particle rearrangements. Particles could be thermally excited out of metastable states, triggering avalanches at reduced compression values. The importance of such thermal effects would depend on the compression rate, and they could be minimized in experiment by performing the compression at a rate faster than the thermal excitation timescale.
We simulate overdamped particles to obtain behavior typical for colloidal particles where inertial effects are negligible. In a dusty plasma, however, inertial effects may play a key role. It would be interesting to examine how avalanche behavior under compression changes in a dusty plasma, since recent studies indicate that addition of inertia can cause a system to switch to a different universality class [80]. We expect that inclusion of inertia would also modify the avalanche statistics.
We consider a soft long-ranged repulsive Coulomb particle-particle interaction potential, but in experiments charge screening and steric effects can be important. At low densities, colloids with a screened Coulomb interaction should show the same behavior we observe. At high densities, when steric interactions begin to dominate, jamming of the type described in Refs. [30,31] would arise and could alter the dynamics. Previous simulations [30,31] of hard disks confined by hard walls produce crystalline and smectic particle arrangements similar to those we observe. Defect-mediated transitions between such states, occurring through avalanches, should be a very generic behavior of a compressed packing.
If our confining potential were replaced with hard walls of the type used in Refs. [30,31], the long-range Coulomb interactions between our particles would cause particles to accumulate along the walls. Such effects have been observed in simulations of particles confined in circular hard wall geometries [36]. Thus, while we observe qualitative similarities between compression via our soft optical trap-like confinement and hard wall compression, the quantitative differences are significant and would be an interesting direction for future study.

VII.  SUMMARY

We have numerically investigated a monodisperse assembly of long-range repulsively interacting colloids undergoing anisotropic dynamical compression in a trough potential. The compression tends to distort the particle lattice anisotropically, so in order to maintain a more isotropic local structure, the particles undergo a series of large-scale avalanche rearrangements in which the average spacing between neighboring particles increases. The avalanches take the form of local shear banding events in which dislocations can be created or annihilated near the edge of the sample. During the plastic events, the particle velocity distributions are non-Gaussian with power law tails that have exponents ranging from τ = −1.9 to τ = −2.5. This is consistent with the velocity distributions found for individual or collectively interacting dislocations during avalanche events. For larger compressions, the avalanches are generally associated with row reduction events during which the number of rows of colloids that fit inside the trough is partially or completely reduced by one. After these avalanche events, the colloids can exhibit partial crystalline or smectic type structures. During decompression, we observe similar avalanche behaviors; however, the avalanche events do not occur at the same values of substrate strength, indicating the occurrence of irreversible behavior. This system could be experimentally realized by confining colloids or other charged particles such as dusty plasmas in anisotropic traps where the barriers or the trap width can be changed dynamically.

ACKNOWLEDGMENTS

This work was carried out under the auspices of the NNSA of the U.S. DoE at LANL under Contract No. DE-AC52-06NA25396. The work of DM was supported in part by the U.S. DoE, Office of Science, Office of Workforce Development for Teachers and Scientists (WDTS) under the Visiting Faculty Program (VFP).

References

[1]
C.A. Murray and D.G. Grier, Am. Sci. 83, 238 (1995).
[2]
J. Crocker and D.G. Grier, J. Colloid Interface Sci. 179, 298 (1996).
[3]
E.R. Weeks, J.C. Crocker, A.C. Levitt, A. Schofield, and D.A. Weitz, Science 287, 627 (2000).
[4]
D.G. Grier, Nature 424, 810 (2003).
[5]
R.P.A. Dullens and C. Bechinger, Phys. Rev. Lett. 107, 138301 (2011).
[6]
K. Zahn, R. Lenke, and G. Maret, Phys. Rev. Lett. 82, 2721 (1999).
[7]
S. Deutschländer, A. M. Puertas, G. Maret, and P. Keim, Phys. Rev. Lett. 113, 127801 (2014).
[8]
J.A. Weiss, D.W. Oxtoby, D.G. Grier, and C.A. Murray, J. Chem. Phys. 103, 1180 (1995).
[9]
C. Bechinger, M. Brunner, and P. Leiderer, Phys. Rev. Lett. 86, 930 (2001).
[10]
C. Reichhardt and C.J. Olson, Phys. Rev. Lett. 88, 248301 (2002).
[11]
M. Brunner and C. Bechinger, Phys. Rev. Lett. 88, 248302 (2002).
[12]
P. Tierno, Soft Matter 8, 11443 (2012).
[13]
T. Bohlein, J. Mikhael, and C. Bechinger, Nature Mater. 11, 126 (2011).
[14]
J. Hasnain, S. Jungblut, and C. Dellago, Soft Matter 9, 5867 (2013).
[15]
A. Vanossi, N. Manini, and E. Tosatti, Proc. Natl. Acad. Sci. (USA) 109, 16429 (2012).
[16]
D. McDermott, J. Amelang, C.J. Olson Reichhardt, and C. Reichhardt, Phys. Rev. E 88, 062301 (2013).
[17]
Q. Chen, S.C. Bae, and S. Granick, Nature 469, 381 (2011).
[18]
S.C. Glotzer and M.J. Solomon, Nature Mater. 6, 557 (2007).
[19]
P.T. Korda, M.B. Taylor, and D.G. Grier, Phys. Rev. Lett. 89, 128301 (2002).
[20]
M.A. Tahir, L. Gao, L.N. Virgin, and B.B. Yellen, Phys. Rev. E 84, 011403 (2011).
[21]
M. Balvin, E. Sohn, T. Iracki, G. Drazer, and J. Frechette, Phys. Rev. Lett. 103, 078301 (2009).
[22]
P. Schall, I. Cohen, D.A. Weitz, and F. Spaepen, Science 305, 1944 (2004).
[23]
P. Schall, D.A. Weitz, and F. Spaepen, Science 1895, 21 (2007).
[24]
M.C. Miguel, A. Vespignani, S. Zapperi, J. Weiss, and J.R. Grasso, Nature (London) 410, 667 (2001).
[25]
M. Zaiser, Adv. Phys. 55, 185 (2006).
[26]
F.F. Csikor, C. Motz, D. Weygand, M. Zaiser, and S. Zapperi, Science 318, 251 (2007).
[27]
P. Moretti, B. Cerruti, and M.-C. Miguel, PLOS One 6, e20418 (2011).
[28]
E.K.H. Salje and K.A. Dahmen, Ann. Rev. Condens. Matter Phys. 5, 233 (2014).
[29]
A. Varshney, A. Sane, S. Ghosh, and S. Bhattacharya, Phys. Rev. E 86, 031402 (2012).
[30]
D. Chaudhuri and S. Sengupta, Phys. Rev. Lett. 93, 115702, (2004)
[31]
D. Chaudhuri and S. Sengupta, J. Chem. Phys. 128, 4702 (2008).
[32]
G. Piacente, I.V. Schweigert, J.J. Betouras, and F.M. Peeters, Phys. Rev. B 69, 045324 (2004).
[33]
G. Piacente, G.Q. Hai, and F.M. Peeters, Phys. Rev. B 81, 024108 (2010).
[34]
A.D. Klironomos and J.S. Meyer, Phys. Rev. B 84, 024117 (2011).
[35]
J.E. Galván-Moya and F.M. Peeters, Phys. Rev. B 84, 134106 (2011).
[36]
J.E. Galván-Moya, K. Nelissen, and F.M. Peeters, Phys. Rev. B 86, 184102 (2012).
[37]
J.E. Galván-Moya, V.R. Misko, and F.M. Peeters, Phys. Rev. B 90, 094111 (2014).
[38]
S.W.S. Apolinario, B. Partoens, and F.M. Peeters, Phys. Rev. E 72, 046122 (2005).
[39]
R. Haghgooie and P.S. Doyle, Phys. Rev. E 72, 011405 (2005).
[40]
A.V. Straube, A.A. Louis, J. Baumgartl, C. Bechinger, and R.P.A. Dullens, EPL 94, 48008 (2011).
[41]
D. Wilms, S. Deutschländer, U. Siems, K. Franzrahe, P. Henseler, P. Keim, N. Schwierz, P. Virnau, K. Binder, G. Maret, and P. Nielaba, J. Phys.: Condens. Matter 24, 464119 (2012).
[42]
A.V. Straube, R.P.A. Dullens, L. Schimansky-Geier, and A.A. Louis, J. Chem. Phys. 139, 134908 (2013).
[43]
T. Dessup, T. Maimbourg, C. Coste, and M. Saint Jean, Phys. Rev. E 91, 022908 (2015).
[44]
L.Q. Costa Campos and S.W.S. Apolinario, Phys. Rev. E 91, 012305 (2015).
[45]
T.E. Sheridan and K.D. Wells, Phys. Rev. E 81, 016404 (2010).
[46]
K.-A. Liu and L. I, Phys. Rev. E 82, 041504 (2010).
[47]
A. Radzvilavicius, O. Rancova, and E. Anisimovas, Phys. Rev. E 86, 016404 (2012).
[48]
S. Fishman, G. De Chiara, T. Calarco, and G. Morigi, Phys. Rev. B 77, 064111 (2008).
[49]
A. del Campo, G. De Chiara, G. Morigi, M.B. Plenio, and A. Retzker, Phys. Rev. Lett. 105 075701 (2010).
[50]
M. Mielenz, J. Brox, S. Kahra, G. Leschhorn, M. Albert, T. Schaetz, H. Landa, and B. Reznik, Phys. Rev. Lett. 110, 133004 (2013).
[51]
E. Bronson, M.P. Gelfand, and S.B. Field, Phys. Rev. B 73, 144501 (2006).
[52]
J.J. Barba and J. Albino Aguiar, J. Phys.: Conf. Ser. 150, 052015 (2009).
[53]
J.E. Galván-Moya, D. Lucena, W.P. Ferreira, and F.M. Peeters, Phys. Rev. E 89, 032309 (2014).
[54]
M. Sobrino Fernández, V.R. Misko, and F.M. Peeters, Phys. Rev. E 89, 022306 (2014).
[55]
S.W.S. Apolinario, B. Partoens, and F.M. Peeters, Phys. Rev. E 74, 031107 (2006).
[56]
D. Lucena, W.P. Ferreira, F.F. Munarin, G.A. Farias, and F.M. Peeters, Phys. Rev. E 87, 012307 (2013).
[57]
J.-B. Delfau, C. Coste, and M. Saint Jean, Phys. Rev. E 87, 032163 (2013).
[58]
J.-B. Delfau, C. Coste, and M. Saint Jean, Phys. Rev. E 87 062135, (2013).
[59]
Y. Liu and L.Y. Chew, J. Phys.: Condens. Matter 19, 356213 (2007).
[60]
W.P. Ferreira, J.C.N. Carvalho, P.W.S. Oliveira, G.A. Farias, and F.M. Peeters, Phys. Rev. B 77, 014112 (2008).
[61]
I.R.O. Ramos, W.P. Ferreira, F.F. Munarin, and F.M. Peeters, Phys. Rev. E 90, 062311 (2014).
[62]
G. Piacente and F.M. Peeters, Phys. Rev. B 72, 205208 (2005).
[63]
N. Kokubo, T.G. Sorop, R. Besseling, and P.H. Kes, Phys. Rev. B 73, 224514 (2006).
[64]
P. Henseler, A. Erbe, M. Köppl, P. Leiderer, and P. Nielaba, Phys. Rev. E 81, 041402 (2010).
[65]
D. G. Rees, H. Totsuji, and K. Kono, Phys. Rev. Lett. 108, 176801 (2012).
[66]
A.A. Vasylenko and V.R. Misko, Biophys. Rev. Lett. 9, 349 (2014).
[67]
S.W.S. Apolinario, B. Partoens, and F.M. Peeters, Phys. Rev. B 77, 035321 (2008).
[68]
M.A. Lohr, A.M. Alsayed, B.G. Chen, Z. Zhang, R.D. Kamien, and A.G. Yodh, Phys. Rev. E 81, 040401R (2010).
[69]
L.G. D'yachkov, M.I. Myasnikov, O.F. Petrov, T.W. Hyde, J. Kong, and L. Matthews, Phys. Plasmas 21, 093702 (2014).
[70]
O. Rancova, E. Anisimovas, and T. Varanavicius, Phys. Rev. E 83, 036409 (2011).
[71]
L.G. D'yachkov, M.I. Myasnikov, O.F. Petrov, T.W. Hyde, J. Kong, and L. Matthews, Phys. Plasmas 21, 093702 (2014).
[72]
W.P. Ferreira, J.C.N. Carvalho, P.W.S. Oliveira, G.A. Farias, and F.M. Peeters, Phys. Rev. B 77, 014112 (2008).
[73]
K. Pyka et al., Nature Commun. 4, 2291 (2013).
[74]
S. Ulm et al., Nature Commun. 4, 2290 (2013).
[75]
G. Morfill and A. Ivlev, Rev. Mod. Phys. 81, 1353 (2009).
[76]
P.D. Ispanovity, I. Groma, G. Györgyi, F.F. Csikor, and D. Weygand, Phys. Rev. Lett. 105, 085503 (2010).
[77]
F. Jafarpour, L. Angheluta, and N. Goldenfeld, Phys. Rev. E 88, 042123 (2013).
[78]
J. Lekner, Physica A 176, 485 (1991); N. Grønbech-Jensen, G. Hummer, and K.M. Beardmore, Mol. Phys. 92, 941 (1997).
[79]
A. Clauset, C.R. Shallzi, and M.E.J. Newman, SIAM Rev. 51(4), 661 (2007); J. Alstott, E. Bullmore, and D. Plenz, PLoS ONE 9, e85777 (2014).
[80]
K.M. Salerno, C.E. Maloney, and M.O. Robbins, Phys. Rev. Lett. 109, 105703 (2012).
[81]
See Supplemental Material at http://link.aps.org/supplemental/10.1103/PhysRevE.93.062607 for the intially ordered triangular lattice under compression, the initially slightly distorted triangular lattice under compression, and the decompression of the initially slightly distorted triangular lattice.


File translated from TEX by TTHgold, version 4.00.
Back to Home