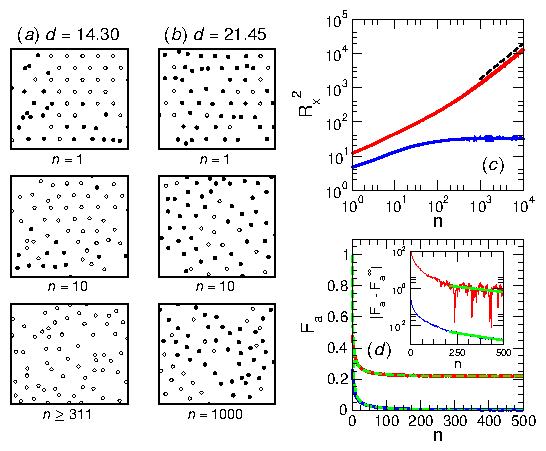
 Figure 1: (a,b) Images of particle positions in a portion of the sample
in the skyrmion limit with αm/αd=1. Filled circles are `active'
particles that do not return to the same position after each drive cycle, and
open circles are inactive particles that move reversibly.
(a) A reversible state at d=14.30 after n=1, 10, and 311 cycles, from top
to bottom.
(b) An irreversible state at d=21.45 after n=1, 10, and 1000 cycles, from
top to bottom.
(c) The mean square particle displacement in the x direction, Rx2, vs
cycle number n for d=14.30 (blue) and d=21.45 (red).
The dashed line is a fit to Rx2 ∝ n.
(d)
The fraction Fa of active particles vs n for d=14.30 (blue) and d=21.45 (red).
The dashed lines
are fits to Eq. (4).
The standard error of Fa is on the order of 10−3. The inset shows |Fa−Fa∞| for the same values of d as in the main plot, but the d=21.45 (red) curve has been translated vertically to avoid overlap. At long times, Fa exponentially decays with n. The solid green lines are guides to the eye.
|


