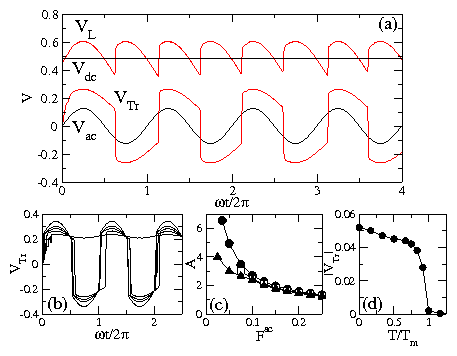
 Figure 4:
(a) VTr(t) (thick lower line) and VL(t) (thick upper line),
with the analytic values of Vac(t) (thin lower line)
and Vdc(t) (thin upper line) shown for comparison.
VL and Vdc have been shifted up by 0.2 for presentation purposes.
Time is given in units of 2π/ω.
Here B/Bϕ=2.0, Fac=0.125, and Fdc=0.28.
(b) Time series of VTr for a system with
B/Bϕ=1.77, Fdc = 0.28, and varied ac drive amplitude of
Fac=0.15, 0.1, 0.075, 0.05, 0.035, and 0.02, from
top to bottom on the positive response side.
(c) The amplification factor A versus Fac
for samples at Fdc = 0.28 with B/Bϕ = 1.61 (filled circles),
2.0 (open squares), and 2.11 (filled triangles).
(d) |VTr| vs T/Tm at B/Bϕ = 2.0
and Fdc = 0.3.
|
