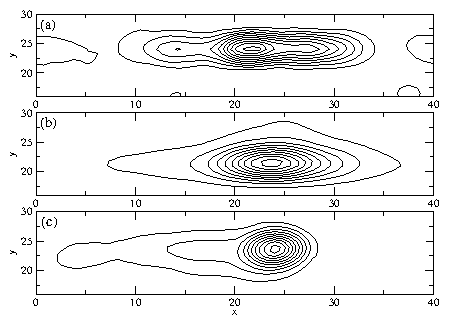
 Figure 4: Contour plot of ―v2
as a function of position relative to the
driven particle. The lowest contour is normalized to
5% of the maximum of ―v2,
and each contour represents a 10% increase.
The system size is 48×48, and the
driven particle position is fixed to (24,24).
|
