Physical Review E 82, 051306 (2010)

Fluctuations, Jamming, and Yielding for a Driven Probe Particle in Disordered Disk Assemblies

C.J. Olson Reichhardt and C. Reichhardt

Theoretical Division, Los Alamos National Laboratory, Los Alamos, New Mexico 87545, USA

(Received 11 August 2009; revised manuscript received 18 June 2010; published 24 November 2010)

Using numerical simulations we examine the velocity fluctuations and velocity force curve characteristics of a probe particle driven with constant force through a two-dimensional disordered assembly of disks which has a well defined jamming point J at a density of ϕJ = 0.843. As ϕ increases toward ϕJ, the average velocity of the probe particle decreases and the velocity fluctuations show an increasingly intermittent or avalanchelike behavior. When ϕ is within a few percent of the jamming density, the velocity distributions are exponential, while when ϕ is less than a percent away from jamming, the velocity distributions have a power law character with exponents in agreement with recent experiments. The velocity power spectra exhibit a crossover from a Lorentzian form to a 1/f shape near jamming. We extract a correlation length exponent ν which is in good agreement with recent shear simulations. For ϕ > ϕJ, there is a critical threshold force Fc that must be applied for the probe particle to move through the sample which increases with increasing ϕ. The velocity force curves are linear below jamming, while at jamming they have a power law form. The onset of the probe motion above ϕJ occurs via a local yielding of the particles around the probe particle which we term a local shear banding effect.
I. INTRODUCTION
II. SIMULATION
III. VELOCITY FLUCTUATIONS BELOW JAMMING
A. Power Spectra
B. Driving Rate Dependence
C. Estimation of the Correlation Length Scale Exponent ν
D. Velocity-Force Curves
IV. THRESHOLD AND YIELDING ABOVE JAMMING
V. SUMMARY
References


I.  INTRODUCTION

When a disordered assembly of particles with short-range steric interactions becomes dense enough that the particles begin to overlap, a transition occurs from an unjammed state where the system easily flows or acts like a liquid to a jammed state where the system resists shear and shows a solid-like response. Liu and Nagel proposed a general phase diagram for disordered particle assemblies where a transition into a jammed state occurs as a function of several different variables including increasing density, decreasing external forcing, or decreasing temperature [1]. At `Point J' on this phase diagram, jamming occurs for increasing density at zero stress and zero temperature [2]. There is growing evidence that point J has the properties of a critical point with diverging length scales on both sides of the jamming transition [2,3,4,5,6,7,8,9,10,11,12,13,14,15]. Point J has been well studied in the particular system of two-dimensional, finite range repulsive frictionless bidisperse disks with a radii ratio of 1:1.4 [2,3,10,12,14]. The bidispersity is necessary to prevent the system from crystallizing. Simulations show that the jamming density ϕJ ≈ 0.84, and experimental realizations of this system also give a similar jamming density [15,16]. Systems that exhibit jamming include granular media [2,17], colloids [15], and emulsions [18,19].
One aspect of jamming that has been less well studied is the dynamical response as point J is approached. If point J is a critical point, it could have strong effects on the dynamical response of the system to global or local forcing and may result in the appearance of intermittent or avalanche behavior. In the numerical work of Drocco et al. [3], the velocity fluctuations of a single probe particle driven with constant force showed signs of increasing intermittency and avalanche characteristics as ϕ approached ϕJ. More recent experimental work in which a single probe particle was driven at constant force through a granular packing also indicates that the velocity fluctuations become increasingly intermittent as ϕJ is approached [16]. These results suggest that proximity to point J will strongly affect the dynamics and may result in the appearance of critical properties.
The velocity and force characteristics of a locally driven particle have already been used as a probe of the yielding and dynamical properties of a two-dimensional disordered colloid system, where a finite threshold force must be applied before the particle can be set in motion [20,21]. Experiments and simulations of three-dimensional disordered colloidal systems have shown that a threshold force for motion appears when the density is high enough for a glass transition to occur [22,23], while for jamming in two dimensions a finite threshold force is also expected to appear above the jamming transition. Drag effects in granular systems have been studied by moving a large obstacle through the granular media [24,25]. Geng and Behringer analyzed the fluctuations of a probe particle held fixed in a two-dimensional system while the remaining grains were driven past [26], and found that the force fluctuations have intermittent characteristics and are exponentially distributed. Here we show that the velocity force curves change from linear below jamming to a power law form at jamming. The power law exponent is close to the exponent measured in studies of the inverse viscosity versus shear stress for sheared granular media [10]. The velocity force curves above jamming show a change in curvature at the transition from a pinned to a moving phase. The onset of motion of the probe particle above jamming has properties more consistent with elastic depinning, rather than the plastic depinning observed at jamming.
In this work we examine the velocity fluctuations of a probe disk driven with constant force through a two-dimensional bidisperse system of disks as the density of the system passes through point J. As ϕJ is approached from below, the velocity fluctuations show increasingly intermittent properties characterized by large bursts of motion. The average probe particle velocity initially decreases linearly with increasing ϕ; however, within a few percent of the jamming density, the average velocity falls to zero in a nonlinear manner. The velocity fluctuations are exponentially distributed when ϕ is within several percent of the jamming density, while within one percent of ϕJ the velocity fluctuations have a non-exponential distribution which can be fit with a power law. The velocity power spectra below jamming have a Lorentzian form with a 1/ω2 behavior at high frequencies that is similar to the results found in the slow drag experiments of Ref. [26]; however, very close to jamming the low frequency response exhibits a 1/ω behavior. The local rearrangements of disks near the probe particle increase in spatial extent as the jamming transition is approached from below.
For ϕ < ϕJ, the probe particle is always able to move through the sample for arbitrarily small driving forces. In contrast, for ϕ > ϕJ, there is a finite threshold force Fc required to move the probe particle. Above the threshold force, progress of the probe particle is made possible by yielding of the surrounding particles that occurs via local plastic rearrangements of the disks near the moving probe particle. The appearance of a finite driving threshold in the jammed phase is similar to recent numerical studies of dense colloidal systems where a threshold force appeared in sufficiently dense samples [23]. We find that the threshold force increases with increasing ϕ. The velocity fluctuations at drives just above the yielding transition Fc have a nonexponential distribution, while at higher drives the velocity fluctuations become exponentially distributed. When the probe particle moves, it creates local rearrangements or a local shear banding.
In very recent experimental work on driving a probe particle through a two-dimensional disordered assembly of grains at constant force [27,16], several of the results we report here have been confirmed. These include the increasingly intermittent velocity fluctuations experienced by the probe particle as jamming is approached, the power-law form of the velocity distributions at jamming with an exponent between 2.7 and 3.5, and the formation of a permanent wake behind the dragged particle for densities below jamming. The experiments also demonstrate an increasing nonlinearity in the velocity-force curves as the jamming density is approached, and show that the curves can be fit to an exponential form. We find power-law velocity-force curves close to jamming with exponents that are in good agreement with the analogous quantities measured in shearing simulations. Finally, we provide many new predictions including the existence of 1/f velocity fluctuation power spectra at and above the jamming transition and 1/f2 spectra below the transition, and show that the the velocity-force curves change the nature of their curvature above jamming.

II.  SIMULATION

We simulate a two-dimensional bidisperse system of N disks of size L ×L with periodic boundary conditions in the x and y directions. The particles are modeled as repulsively harmonically interacting disks of radii RA or RB with a size ratio RA:RB of 1.4:1. The ratio of A and B particles is 50:50. The initial disk packing is obtained by placing the disks in non-overlapping locations and then shrinking all disks, adding a few additional disks, and reexpanding all disks while thermally agitating the disks. This process is repeated until the desired density is obtained. After the disk configuration is generated, we select a single disk and drive it with a constant force FD=FDx. The motion of an individual disk i at position ri is governed by the following overdamped equation:
η dri

dt
=

ij 
k(Reff−|rij|) rij

|rij|
Θ(Reff−|rij|) + FDi
Here Θ is the Heaviside step function, rij = rirj, and Reff = Ri+Rj, where Ri and Rj are either RA or RB depending on the type of each disk. We take the spring constant k = 200 and the damping constant η = 1.0. The driving term FiD=FDx is applied to only one disk and we extract the instantaneous velocities of all disks. In this work, L = 60 and the jamming density is ϕJ ≈ 0.843, corresponding to approximately N=2600 disks. The ability to experimentally realize a system where the probe particle velocity can be examined under a constant driving force has recently been demonstrated [16].

III.  VELOCITY FLUCTUATIONS BELOW JAMMING

Fig1.png
Figure 1: (Color online) Images of the system at different densities where the probe particle (open red circle) is driven 2/5 of the way through a disordered sample of bidisperse disks. The smaller disks are light colored (filled green circles) and the larger disks are dark colored (filled blue circles). Black lines indicate the trajectories of the disks that have moved. (a) ϕ = 0.13, (b) ϕ = 0.323, (c) ϕ = 0.55, and (d) ϕ = 0.81.
In Fig. 1 we show snapshots of the system at different densities of ϕ = 0.13, 0.323, 0.55, and 0.81, with the probe particle highlighted. The trajectories of all grains are drawn over the time required for the probe to cross 2/5 of the sample. The larger disks are dark colored, the smaller disks are light colored, and the overall disk arrangement is disordered. For each of these densities, the probe particle leaves an empty space behind it after pushing the other disks out of the way. This empty space is most clearly visible in Fig. 1(c). The appearance of an empty trail behind the probe particle generally occurs for any density below ϕJ since there is no pressure in the system that could force the surrounding particles back into the empty space.
Fig2.png
Figure 2: (a) The average velocity 〈V〉 of the probe particle vs ϕ for FD = 0.025. At low densities, 〈V〉 varies linearly with ϕ, and a small change in the slope appears near ϕ = 0.5. 〈V〉 goes to zero at the jamming density ϕJ = 0.843, indicated by the letter J. (b) A detail of 〈V〉 vs ϕ from (a) showing that 〈V〉 does not start to fall rapidly until ϕ is within three percent of ϕJ.
To construct velocity histograms for different densities at fixed driving force, we perform a series of simulations at increasing values of ϕ and acquire a time series of the instantaneous probe particle velocity in the direction of the drive, V(t). The average velocity during a complete simulation lasting τ time steps is 〈V〉 = τ−1iτV(ti). Our system contains no quenched disorder and therefore in the jammed state the velocity of the driven particle does not drop to zero; instead it reaches the value Vjam=FD/N [3] since the probe particle is now pushing all of the disks in the system. When the system reaches this velocity we say that it is jammed, and in our plots of 〈V 〉 we subtract Vjam to indicate that there is zero net velocity difference between the probe particle and the background disks in the jammed state. We also note that in the jammed state, there are no velocity fluctuations since all of the disks and the probe particle are moving at the same fixed velocity. In Fig. 2(a) we plot 〈V〉 vs ϕ for a system with FD = 0.025. Here 〈V〉 monotonically decreases with ϕ and goes to zero at ϕJ = 0.843, a jamming density which is in agreement with other studies [12,14].
Figure 2(a) shows that there is a change in the slope of 〈V 〉 with increasing ϕ near ϕ = 0.5, with a slightly steeper slope for ϕ < 0.5 and a more gentle slope for ϕ > 0.5. In addition, 〈V〉 changes from a roughly linear decrease with increasing ϕ over most of the range of ϕ to a much more rapid nonlinear decrease for ϕ > 0.82. When ϕ < 0.5, the probe particle alternates between free motion unimpeded by any disks and occasional collisions during which the probe particle entrains one of the background particles and pushes it over some distance. We show later that this alternation between different types of motion appears as a clear feature in the velocity distributions. For ϕ > 0.5, the probe particle spends most of its time pushing one or more particles but the number of entrained particles remains small. The distance over which the probe particle drags individual background disks varies widely due to interactions among the dragged disks which create random fluctuations for the dragged disk closest to the probe particle. For ϕ > 0.82, the induced motions in the background packing become increasingly collective, and even disks which are far away from the probe particle can participate in the motion. In Fig. 2(b) we plot 〈V〉 versus ϕ close to jamming. The velocity decreases in a nonlinear fashion within three percent of the jamming density. Within less than one percent of ϕJ, the velocity curve is still nonlinear; however, the curvature of the slope of 〈V〉 versus ϕ changes sign. In a later section we discuss how the velocity scales near jamming and how it can be related to a diverging correlation length.
Fig3.png
Figure 3: (a) V(t), the time trace of the probe particle velocity, at ϕ = 0.323 for FD = 0.025. Between collisions the probe particle moves at a velocity of V=0.025 due to the overdamped dynamics. (b) The histogram P(V) of the velocities for ϕ = 0.323 for ten different initial conditions at FD = 0.025. The peak at V = 0.025 corresponds to the collision-free portion of the particle motion, while the second peak near V=0.0125 corresponds to the times that the probe particle is pushing one extra particle which doubles the drag. All of the P(V) in this work are normalized such that the probabilities sum to one. (c) V(t) at ϕ = 0.55 and FD = 0.025. (d) P(V) for several realizations at ϕ = 0.55 and FD=0.025.
We next examine in detail the velocity distributions obtained from time series V(t) taken at fixed values of ϕ. In Fig. 3(a) we plot V(t) for a sample with ϕ = 0.323 and FD=0.025, the same system that was shown in Fig. 1(b). During this time period, the particle moved slightly more than halfway through the sample. Figure 3(a) shows that the probe particle often travels at the maximum possible velocity V=0.025, forming velocity plateaus that occur when the probe particle is not in contact with any other disks. Collisions with other disks reduce the velocity of the probe particle, and when the impact parameter of a collision is small enough, one or more of the background particles can be pushed over some distance by the probe particle, resulting in characteristic drops in V(t) of 50% or more as seen in Fig. 3(a).
In Fig. 3(b) we plot the distribution of the velocities P(V) for the system in Fig. 3(a) at ϕ = 0.323. To generate the histogram, we combine data from ten simulations in which the probe particle is randomly selected and then driven over a fixed distance. The results are unchanged if we use ten randomly generated packings since the variation in ϕJ from packing to packing is negligible for systems of this size. We normalize all P(V) curves such that the sum of the probabilities equals 1.0. There is a large peak in P(V) at V=0.025 in Fig. 3(b), corresponding to the plateaus in Fig. 3(a) generated during time periods when the probe particle moves freely without colliding with any background particles. A second peak in P(V) is centered at V=0.0125, which is half of the value of the free particle velocity. This peak corresponds to the time periods during which the effective drag on the probe particle is doubled since the probe particle is pushing one additional disk. A similar double peak feature in P(V) appears for all ϕ < 0.5, and as ϕ increases, the relative weights of the V=0.025 and V=0.0125 peaks change as more weight shifts to the lower peak. In Fig. 3(c,d) we plot V(t) and P(V) for a higher ϕ = 0.55. Here the weight at V = 0.025 is significantly reduced and the peak probability has shifted to V = 0.008. There is still a peak at V = 0.0125 which is now higher than the V=0.025 peak.
Fig4.png
Figure 4: V(t) for ϕ = 0.71 and FD=0.025, showing a more intermittent motion. (b) A blowup of one of the velocity pulses shows that the response is asymmetric in time.
Fig5.png
Figure 5: P(V) for ϕ = 0.71 and FD=0.025, showing a peak at low V near V = 0.037 with a long tail extending up to V = 0.025. (b) The same P(V) on a log-linear plot indicating that the tail has an exponential form.
For ϕ = 0.71, the system is sufficiently dense that the probe particle is rarely able to move freely without contacting other particles. The velocity V(t) is strongly intermittent and contains large spikes, as seen in Fig. 4(a). The closeup in Fig. 4(b) of one of the velocity spikes from Fig. 4(a) shows that the pulses have some temporal asymmetry where slow velocity increases are followed by sharper velocity drops. In Fig. 5(a), P(V) for ϕ = 0.71 has a maximum near V=0.00375 with a long tail ending at V = 0.025. The very small peaks near V = 0.0125 and V=0.025 are remnants of the type of dynamics responsible for the two-peak structure in Fig. 3(b) and Fig. 3(d). To show that the tail of P(V) has an exponential form for the largest velocities, we replot the data on a log-linear scale in Fig. 5(b). Since the velocity is bounded from above by the driving force, we find some deviations from a single exponential fit for V > 0.015 and a small peak at V=0.025. The intermittency and asymmetry of the velocity jumps at this density are very similar to the properties of the stress fluctuations in two-dimensional drag experiments near the jamming transition [26]. Since the experiments measured stress rather than velocity fluctuations, the time asymmetry of the stress jumps is reversed from the asymmetry that we find. The experiments of Ref. [26] also showed that the fluctuation distribution had a maximum with an exponential tail feature similar to that shown in Fig. 5(b).
Fig6.png
Figure 6: V(t) for ϕ = 0.807 and FD=0.025, where the motion is strongly intermittent. (b) A blowup of one of the velocity pulses showing the same temporal asymmetry found for ϕ = 0.71.
Fig7.png
Figure 7: (a) P(V) for ϕ = 0.807 at FD=0.025 has a peak at V = 0.0025 and a long tail. (b) The same P(V) on a log-linear scale, showing that the tail has an exponential form.
At ϕ = 0.807, Fig. 6(a) shows that there is a more pronounced intermittency in V(t). Here, even the highest velocity spikes always fall below V=0.025, indicating that the probe particle is always in contact with the surrounding particles and never moves freely. The strong velocity intermittency is similar in appearance to the stress fluctuations measured in shear experiments [28]. The blowup of a velocity spike in Fig. 6(b) reveals that the same time asymmetry observed for velocity spikes at ϕ = 0.71 persists at this density. In Fig. 7(a) we plot P(V) for ϕ = 0.807, where the peak probability is shifted to a lower velocity V=0.0025. The pronounced velocity tail has an exponential form, as seen in the log-linear plot in Fig. 7(b). The maximum density ϕ ≈ 0.77 studied in the dragging experiments of Ref. [26] is close to the ϕ = 0.807 density presented in Fig. 7. The exponential distribution of the avalanche events measured in the experiment is very similar to the P(V) distribution shown in Fig. 7(a). It is likely that frictional forces between the grains were responsible for limiting the upper density accessible in the experiments of Ref. [26]. Such frictional forces are absent in our system.
Fig8.png
Figure 8: V(t) close to jamming at ϕ = 0.8414 and FD=0.025. Here V drops almost to zero between the velocity spikes.
We find the same type of exponential tail in the velocity distribution as that shown in Fig. 7(b) for higher densities ϕ up to within two percent of ϕJ. At densities even closer to ϕJ, there is pronounced intermittency of V(t) and the velocity drops almost to zero between velocity bursts, as shown in Fig. 8 for ϕ = 0.8414 which is within a fraction 0.998 of ϕJ.
Fig9.png
Figure 9: (Color online) P(V) at FD=0.025 for ϕ = 0.823, 0.833, 0.8395, 0.8414, and 0.8427, from lower left to upper left. Dashed line: power law fit of ϕ = 0.8427 with α = −2.75. For ϕ = 0.823 and ϕ = 0.833, P(V) has an exponential form.
Fig10.png
Figure 10: (Color online) P(V) at FD=0.025 within 2 grains of the jamming density for different sample sizes. Light solid line: L=9; light dashed line: L=12; heavy dot-dashed line: L=21; heavy dashed line: L=30; and heavy solid line: L=42.
In Fig. 9 we plot P(V) for ϕ = 0.823, 0.833, 0.8395, 0.8414, and 0.8427 on a log-log scale. For ϕ = 0.823 and 0.833, the distributions fit well to an exponential form, but the quality of the exponential fit degrades for ϕ = 0.8395 and 0.8414. Very close to jamming P(V) crosses over to as power law form, as illustrated by the fit in Fig. 9 to the ϕ = 0.8427 curve with an exponent of α = −2.75. This power law form persists as the sample size changes, as shown in Fig. 10 for samples of size ranging from L=9 to L=42, but the range of velocities that can be accessed is reduced in the smaller systems. If point J is a critical point as suggested in recent studies, then there should be power law divergence of various quantities as ϕJ is approached and the dynamical response should also reflect the critical properties. In general, critical phenomena or critical fluctuations should only appear within about 1 percent of the critical point or closer, which is consistent with our observations. We note that the power law exponent α = −2.75 which fits our data close to jamming is comparable to results obtained for recent experimental studies of granular slip systems where the energy is released in avalanche events distributed with power law exponents of −2.8 [29]. Further, in recent driven probe particle experiments, the velocity distributions become sharper as the jamming density of 0.84 is approached and show power law exponents ranging from −2.5 to −3.0 [27].
Several factors limit how closely we can approach ϕJ. These include the fact that we are applying a finite but small drive of FD=0.025 to our probe particle. Ideally, it would be best to use a vanishingly small drive, but smaller drives would require prohibitively long simulation times to obtain adequate velocity statistics. Another issue is that for densities close to ϕJ, it possible that the probe particle can undergo a transient motion over some distance before reaching a jammed state. This effect was noted in the work of O'Hern et al. who found that although the distribution of possible jammed configurations peaks around ϕ = 0.844, the peak has a finite width for any system of finite size [2].
Velocity fluctuations with power law distributions have also been observed in chute flow systems, where three regimes are identified as a function of density: a low density free-falling regime, a narrow liquid-like regime, and a high density solid or glassy regime [30]. In the liquid-like regime, the velocities can be fit to a power law with exponents of −2.4 to −3.7. Even though the chute flow system is three-dimensional, one possible interpretation of our two-dimensional results is that our low density regime is similar to the free-falling regime, while the liquidlike, glassy, or solid regimes could correspond to the regime just before jamming where we find power law velocity distributions.
It is interesting to ask why power law features of the type shown close to jamming in Fig. 9 were not observed in the slow drag experiments of Ref. [26]. In the experiments the jamming density fell at a ϕ significantly lower than our ϕJ, probably due to frictional effects. Although the experimental system is jammed, this jammed state does not appear to have the same critical properties that are associated with the frictionless grains at ϕJ = 0.843. This implies that the concept of critical jamming may be limited to certain types of jamming models and that criticality at point J may occur only in the frictionless limit.
Fig11.png
Figure 11: Black lines: trajectories followed by the particles as the probe particle moves halfway through the system at FD = 0.025. The entire sample is shown. (a) ϕ = 0.129. (b) ϕ = 0.323 (c) ϕ = 0.807. (d) ϕ = 0.8414.
In Fig. 11 we plot the trajectories of the particles as the probe moves halfway through the sample. In Fig. 11(a,b) at ϕ = 0.129 and 0.323, the main trajectory of the probe particle appears as a continuous line. Only small, highly localized perturbations of the surrounding particles appear near the probe particle. For ϕ = 0.807 in Fig. 11(c), the perturbation in the direction transverse to the drive extends much further from the probe particle, with motion occurring for particles that are up to nine lattice constants away from the driven particle. Here the trajectories of the surrounding particles are very short and do not intertwine. For ϕ = 0.8414 in Fig. 11(d), the maximum extent of the perturbations transverse to the drive is only slightly larger than at ϕ = 0.807; however, the perturbations ahead of the probe particle in the driving direction are much more extended. In addition, the motion of the surrounding particles takes two different forms. The first type of motion consists of particles following straight trajectories. It is the primary form of motion found for lower ϕ. The second type of motion involves particles which move in larger circular trajectories that intertwine with the trajectories of other particles. These trajectories are associated with plastic deformations in which some of the surrounding particles move around one another. Similar plastic rearrangements of the surrounding particles caused by the motion of a probe particle were observed in a charged colloidal media [20]. In the colloidal system, the driven particle moved only if the drive was larger than some threshold, while the motion in Fig. 11(d) occurs for any drive and the threshold for motion is zero. The plastic deformation trajectories that we observe are similar to topological changes or T1 events. We showed in Fig. 2(b) that 〈V〉 does not develop a nonlinear dependence on ϕ until ϕ > 0.825. Since we only observe the intersecting plastic trajectories for ϕ > 0.825, it is possible that the nonlinearity in 〈V〉 may be associated with the onset of plastic motion.

A.  Power Spectra

The power spectrum of the velocity fluctuations is given by
S(ω) =

V(t) eiωtdt
2
 
.
In the slow drag experiments of Ref. [26], the force fluctuations showed an ω−2 behavior at high frequencies with a knee or roll off to a flat spectrum at low frequencies. The roll off frequency shifted to lower frequencies with lower rotation rates. The ω−2 behavior persisted for increasing densities and there was no clear signature in the power spectrum of the fluctuations just before jamming. In our system, the frequency range is limited by the inverse of the time required for the particle to transverse half of the system, so we can access lower frequencies at higher densities when the probe particle moves more slowly.
Fig12.png
Figure 12: (Color online) The power spectra S(ω) of V(t) at constant FD = 0.025 for (a) ϕ = 0.484, (b) ϕ = 0.71, (c) ϕ = 0.823 and (d) ϕ = 0.841. For (a-c) the high frequencies have a ω−2 form indicated by a solid line. A fit to a Lorentzian is indicated by a dashed line in (b) and a similar fit can be performed for (a,c). For ϕ = 0.841 in (d), a Lorentzian can no longer be fit and a low frequency ω−1 feature appears.
In Fig. 12(a,b,c) we plot S(ω) for ϕ = 0.484, 0.71, and 0.823. We find that for ϕ < 0.84 S(ω) has the same features seen in the experiment of Ref. [26], including an ω−2 behavior at high frequency and a knee feature at lower frequencies. As indicated in Fig. 12(b), the power spectra can be fit to a Lorentzian form,
S(ω) ∝ S0ω02

ω20 + ω2
.
Here ω0 is the crossover frequency at the knee and S0 is the spectral power along the flat portion of the spectrum below the knee. The Lorentzian fit can be interpreted as indicating the emergence of a characteristic time scale, such as the average time between collisions or an average time between the large velocity bursts. In general, as ϕ increases we find that the knee feature shifts to lower frequencies.
Fig13.png
Figure 13: (Color online) The power spectra S(ω) of V(t) for ϕ = 0.8427 at FD = 0.025 taken over a longer time interval than the spectra in Fig. 12. At jamming, shown here, the low frequency velocity fluctuations have a ω−1 noise signature rather than the ω−2 form found below jamming.
In Fig. 12(d) we plot S(ω) for ϕ = 0.841 in the regime where the velocity histograms have a power law form. The spectrum is no longer Lorentzian but has a 1/ω shape at low frequencies along with the persistent 1/ω2 feature at higher frequencies. In Fig. 13 we plot S(ω) at ϕ = 0.8427 using a significantly longer time window than in Fig. 12 in order to show that the 1/ω spectral signature persists to low frequencies. The appearance of 1/ω noise indicates that the fluctuations are scale-free, consistent with a critical phenomenon. If we were able to acquire very long time traces to access even lower frequencies, the low frequency 1/ω noise power would be higher than the noise power in the flat portion of the Lorentzian found at lower densities, implying that the low frequency noise power may diverge as the jamming transition is approached. A divergence in the noise power at generic second order phase transitions has recently been proposed [31] and is consistent with our results. We also note that a peak in the low frequency noise power associated with the onset of 1/ω noise has been observed in two-dimensional systems at disordering transitions [32].
The slow drag experiments of Ref. [26] may not have been able to access the true critical properties of point J since the fluctuations were examined at a lower ϕ than the expected ϕJ. The drag experiments of Albert et al. [24] also produced Lorentzian type power spectra. We note that this was in a three-dimensional system where frictional effects may also have been relevant.
It would be interesting to see whether a crossover from Lorentzian to 1/ω noise occurs experimentally as jamming is approached. In Ref. [33], where a probe particle was pushed from the bottom of a packing of rodlike particles, a transition from 1/ω2 noise to 1/ω noise was correlated with a transition from stick-slip type motion to the motion of a solid plug. Although this result is consistent with our results, the experimental system is somewhat different in that there are no particle rearrangements in the solid plug state and the noise is produced by friction effects with the wall.
Fig14.png
Figure 14: (Color online) (a) P(V) at ϕ = 0.8414 for FD = 0.025, 0.125, and 0.5, from left to right. (b) P(V) at ϕ = 0.8427 for FD = 0.06, 0.125, and 0.25, from left to right.

B.  Driving Rate Dependence

We next examine how the velocity fluctuations vary with the magnitude of the driving force FD on the probe particle. In Fig. 14 we plot P(V) at ϕ = 0.8414 for FD = 0.025, 0.125, and 0.5. For FD = 0.125 there is a peak in P(V) at V = 0.015 which shifts to V=0.1 for FD = 0.5. The tail of the distribution shifts to higher V for increasing FD and can be fit to a power law for all the FD values shown; however, the range of the fit progressively decreases with increasing FD and is fairly small for FD=0.5. This suggests that the critical fluctuations are most prominent in the limit of small driving forces.
In Fig. 14(b) we plot P(V) on a log-log scale at FD=0.06, 0.125, and 0.25 for a system with ϕ = 0.8427 which is within 0.001 of the jamming density. At this density, for FD < 0.06 it is difficult to obtain enough statistics for a histogram due to the very long simulation times required to move the particle a significant distance through the packing. In addition, when the system is this close to the jamming density, the probe particle jams in some cases before it moves halfway through the system. By comparison, at the jamming density the probe particle almost aways jams instantly. Fig. 14(b) shows that P(V) has a power law form for the lowest drive of FD = 0.06. The data can be fit with an exponent of α = −2.7 over a range of two decades, while if we use only data with V > 0.03, a fit with α = −3.1 is better. Although we cannot more firmly establish the exact exponent for a power law fit, Fig. 14(b) indicates that the distributions do not fit well to a purely exponential form.

C.  Estimation of the Correlation Length Scale Exponent ν

In Ref. [3], a measurement of the number of disks pushed by the probe particle was used to obtain the exponent of a diverging correlation length,
ξ ∝ (ϕJ − ϕ)−ν .
(1)
The resulting value of ν was between 0.6 and 0.7. Other estimates of the exponent for the same two-dimensional disk system give ν = 0.71 ±0.12 [2], ν = 0.6 [10], and ν = 0.57 [14]. More recent quasistatic shearing simulations [34] produced higher estimates of ν = 0.8 and ν = 1.0, and the authors argue that the exponent is sensitive to the exact value of ϕJ, which may explain why the exponents in Refs. [3,10] are somewhat smaller. We note that it is not clear that a pushed disk will produce the same correlation exponent as shearing studies, since for the pushed disk the jamming emanates from a single point. In both cases, however, there is a direction defined either by the shear direction or by the driving direction of the pushed disk. References [3] and [10] both employed about 1200 particles, with reported values of ϕJ=0.8395 in the driven probe particle system of Ref. [3] and ϕJ=0.8415 in the shearing simulation of Ref. [10]. The system in Ref. [12] contained about 2500 particles and had a higher jamming density of ϕJ=0.8433. In the present work we have a comparable number of particles N ≈ 2600 and we find ϕJ = 0.8427 in agreement with Ref. [12]. More recent shearing simulations with larger systems than in Ref. [10] are also consistent with the higher value of ϕJ = 0.843 and give ν = 0.8 [34], so we believe a value of ϕJ = 0.843 is reasonably accurate.
Fig15.png
Figure 15: (Color online) (a) Circles: 〈V〉 vs |ϕJ − ϕ|/ϕJ for FD = 0.025. Straight line: power law fit with α = 2.0. (b) Circles: 〈V〉 vs |ϕJ − ϕ|/ϕJ for FD = 0.125. Straight line: power law fit with α = 1.75.
In Fig. 2(b), the velocity 〈V〉 drops nonlinearly to zero as ϕ increases toward ϕJ and the curvature in 〈V〉 also changes very near jamming. We can estimate ν based on the scaling behavior of 〈V〉 as the jamming transition is approached. At ϕ = 0, the probe particle moves with a free velocity of V0. At nonzero ϕ, the velocity of the probe particle decreases according to 〈V〉 ∝ V0/Nm, where Nm is the number of other disks that are being pushed along by the probe particle. If the pushed particles are within a disklike jammed area of radius ξ that surrounds the probe particle, then NmJξ2. If ξ ∝ (ϕJ − ϕ)−ν, then the velocity should scale as 〈V〉 ∝ V0J − ϕ). From the velocity versus ϕ curves we can fit 〈V〉 ∝ (ϕJ − ϕ)α, giving ν = α/2. In Fig. 15(a) we plot 〈V〉 vs |ϕJ −ϕ|/ϕJ for FD = 0.025 along with a fit of α = 2.0, which gives ν = 1.0. Figure 15(b) shows the same plot for FD=0.125 where we obtain α = 1.75 and ν = 0.875. These values are within the range of the estimates of ν from the quasistatic shearing simulations of Ref. [12]. We note that other theoretical studies have found ν = 0.5 [5,6,8]; it is not clear that these isostatic studies should produce the same exponents as the sheared or driven probe systems. Although our scaling range is too small to give a definitive value for ν, our results along with the other simulations [3,10,12,14] are consistent with ν > 0.5. It is possible that there is more than one diverging length scale near jamming. From the images of the particle displacements near jamming in Fig. 11, there appear to be two different modes of displacements of the surrounding particles: the small displacements that extend in front of the driven particle and the plastic deformations that occur further from the probe particle. It may be that there is a different length scale associated with each of these two types of motion.
Fig16.png
Figure 16: (Color online) 〈V〉 vs FD (dark curves) and dV〉/dFD vs FD (light curves) at (a) ϕ = 0.483 and (b) ϕ = 0.807. In this regime, the velocity-force curves are linear.

D.  Velocity-Force Curves

We next examine the average velocity 〈V〉 versus FD for varied ϕ. At ϕ = 0 in the absence of other disks, the overdamped dynamics we employ cause the velocity of the probe particle to vary linearly with the applied force, VFD. For ϕ well below ϕJ, collisions with other particles reduce the probe particle velocity and increase the effective viscosity; however, the velocity-force curves remain linear as shown in Fig. 16 for ϕ = 0.483 and ϕ = 0.807. The plots of dV〉/dFD in Fig. 16 are consistent with a linear velocity-force relationship.
Fig17.png
Figure 17: (Color online) 
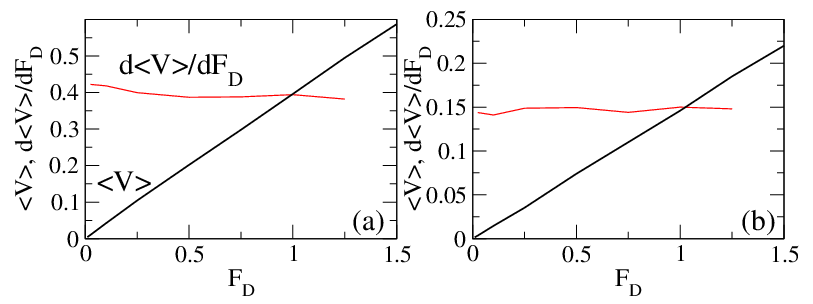
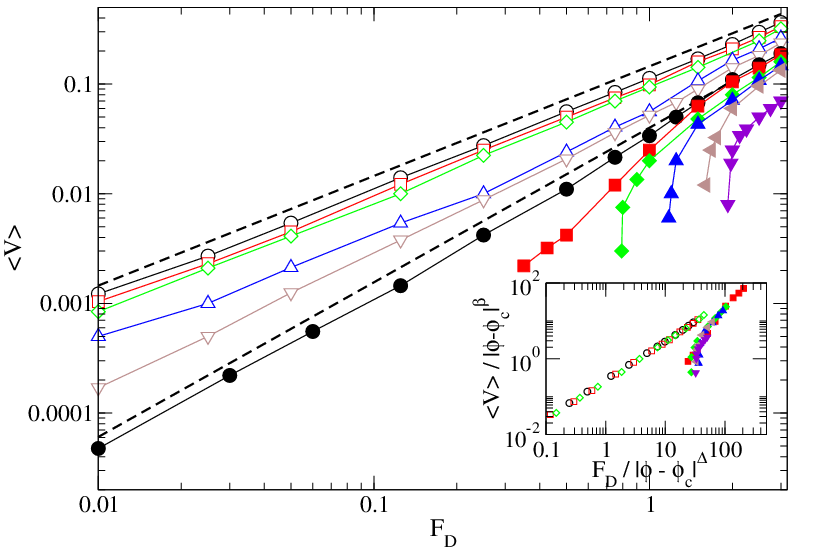
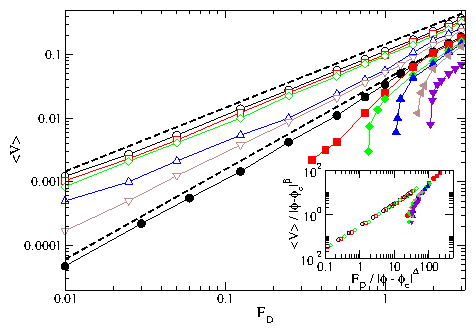
〈V〉 vs FD on a log-log scale for ϕ = 0.833 (open circles), 0.836 (open squares), 0.8386 (open diamonds), 0.8406 (open up triangles), 0.8414 (open down triangles), 0.8427 (filled circles), 0.8432 (filled squares), 0.8438 (filled diamonds), 0.844 (filled up triangles), 0.8453 (filled left triangles), and 0.8464 (filled down triangles). Upper dashed line: a linear fit showing that for ϕ = 0.833, the velocity of the probe increases linearly with the external drive. Lower dotted line: a power law fit with an exponent of 1.41 for ϕ = 0.8427. For ϕ > 0.8427 the probe particle remains pinned for small but nonzero values of FD until FD exceeds the critical force FC. The value of FC increases with increasing ϕ for ϕ > 0.8427. Inset: Scaling plot of 〈V〉/|ϕ−ϕc|β versus FD/|ϕ−ϕc| for the same data with β = 0.7 and ∆ = 0.496.
Very close to jamming the velocity-force curves become nonlinear with a power law form. In Fig. 17 we plot 〈V〉 versus FD for a range of values 0.833 ≤ ϕ ≤ 0.8464 spanning the jamming transition. At ϕ = 0.833 the velocity-force curve is still linear, as indicated by the upper dashed line. In contrast, for ϕ = 0.843 the velocity-force curve has a power law form, as shown by the lower dashed line which is a fit with an exponent of 1.41. For ϕ > 0.8427 the curves trend downward since the probe particle becomes jammed. In this regime, it is possible for the probe particle to depin and begin to move again when FD exceeds a critical driving force FC. Fig. 17 shows that FC becomes nonzero above the jamming transition and increases with increasing ϕ.
The closest experimental realization of our system is the work in Ref. [16] where a probe particle is driven through a two-dimensional assembly of grains. One difference between the experiments in Ref. [16] and our simulations is that the experiment contains an additional vibration to induce a fluidized state. In the experiment, linear velocity-force curves appear at low densities, while closer to jamming the velocity-force curves are nonlinear at low drives and cross over to a linear form at high drives. This crossover shifts to higher values of FD as the jamming transition is approached. In the nonlinear regime, the data in Ref. [16] was fit to 〈V〉 ∝ exp(FD) rather than to a power law; however, the range of the data is sufficiently small that it does not rule out a power law fit. Additionally, it is possible that the applied vibrations induce activation dynamics that are not present in our work. Despite these differences, the onset of nonlinear velocity-force curves and increased intermittency close to jamming found in Ref. [16] are consistent with our results.
The results in Fig. 17 are similar to the inverse shear viscosity versus shear stress plots obtained in granular shearing simulations [10], where a power law fit with an exponent of β/∆ = 1.375 was demonstrated. This is close to the exponent of 1.41 we find in Fig. 17. In the inset of Fig. 17 we show a scaling fit of the data to the form 〈V〉/|ϕ−ϕc|β versus FD/|ϕ−ϕc| where we take β = 0.7 and ∆ = 0.496, giving a ratio β/∆ = 1.41 in agreement with the exponent shown in the main panel of Fig. 17. The power law form of the velocity-force curves at jamming is a further indication that jamming is a critical phenomena and that the criticality can be observed through various transport measurements including the velocity of a single driven probe particle. It would be interesting to perform more detailed probe experiments near jamming in order to measure the power law velocity-force behavior that we predict.
We note that a power law fit to the velocity force curves has been associated with criticality at the onset of motion in other two-dimensional systems. In particular, there are extensive studies of the plastic depinning of particle assemblies driven over rough landscapes in systems ranging from colloidal particles moving over disordered substrates [35,36], vortices in type-II superconductors [37], and generalized models of particle motion over quenched disorder [38]. In these systems, the velocity response can be fit to the form
V ∝ (FDFC)β,
(2)
where FC is the threshold force that must be applied for motion to occur. For ϕ < ϕJ, we find FC = 0; however, velocity-force curves with nonlinear scaling can still occur even in the absence of a threshold. In the collective depinning systems, exponents of β = 1.5 to β = 2.25 are generally observed.
Fig18.png
Figure 18: Velocity-force curves 〈V〉 vs FD. (a) At ϕ = 0.8427, the depinning force is zero. (b) At ϕ = 0.8464, a finite force is needed to depin the probe particle. The curvature changes from (a) to (b).

IV.  THRESHOLD AND YIELDING ABOVE JAMMING

The curvature of the velocity-force curve near the threshold for motion changes as the jamming transition is approached. To illustrate this, in Fig. 18(a,b) we plot 〈V 〉 versus FD for ϕ = 0.8427 and ϕ = 0.8464. At ϕ = 0.8427, a fit of the form 〈V〉 ∝ (FDFC)β gives β > 1.0, while for ϕ = 0.847 we find β < 1.0. Exponents β < 1 are usually associated with elastic depinning processes, such as the depinning of a single particle interacting with a sinusoidal or random substrate.
Fig19.png
Figure 19: FC vs ϕ showing the jammed and unjammed regions.
In Fig. 19 we plot the critical force FC vs ϕ over a range close to the jamming density ϕJ. Below jamming, FC is zero, and above jamming, FC increases with increasing ϕ. Well above ϕJ, FC depends roughly linearly on ϕ. The existence of a depinning threshold and the general shape of the FC vs ϕ curve are in agreement with recent three-dimensional colloid simulations in which a threshold for motion appears above a certain packing density [23]. In our system, the disks interact with a harmonic potential, making them soft enough that it is possible for the probe particle to squeeze between neighboring disks at densities above jamming. A similar yielding appears in shearing simulations performed above the jamming density [10,12]. For real granular systems with frictional effects and much stiffer interactions between particles, it would be difficult to move the probe particle through the system above the jamming density. In colloidal particles which have much softer interactions, it has been experimentally demonstrated that a measurable threshold force for motion exists [22].
Fig20.png
Figure 20: Particle trajectories during the time period required for the probe particle to move halfway through the system at a drive just above the depinning threshold FC. The entire sample is shown. (a) ϕ = 0.8439. (b) ϕ = 0.846.
In Fig. 20 we plot the particle trajectories for ϕ = 0.8439 and ϕ = 0.846 at a drive just above the depinning threshold. In each case, plastic deformations occur within a localized region. The trajectories qualitatively resemble those found below jamming at ϕ = 0.8414 [Fig. 11(d)]. Particles close to the driven particle move linearly over a small distance while particles further from the driven particle undergo intertwining plastic motion. One noticeable difference between Fig. 20 and Fig. 11(d) is that the spatial extent of the region perturbed by the driven probe is more limited above jamming, and it does not appear to grow rapidly in size as ϕ increases above ϕJ. The more localized nature of the motion above jamming suggests that in this regime, plastic distortions occur only near the driven probe while the remainder of the system acts rigidly elastic. We call this a local shear banding effect and find that the onset of motion or yielding above jamming is consistent with the behavior of a disordered elastic solid. A similar conclusion that the state above jamming is a disordered elastic solid was drawn from two-dimensional shearing simulations [12].
Fig21.png
Figure 21: (Color online) Velocity histograms P(V) above jamming at ϕ = 0.846 for FD = 1.725, 1.85, 4.0, and 6.0, from upper left to lower left.
We show the velocity distributions P(V) above jamming at ϕ = 0.846 for four different values of FD in Fig. 21. At FD = 1.725 and FD=1.85, P(V) has a broad form with non-exponential features. Attempts to perform a single power law fit for the higher values of V at these drives give only a limited fitting range with an exponent of −3.0. For the higher drives FD=4.0 and FD=6.0, P(V) still has a tail at high velocities, but it is not possible to fit the data with a power law form.
Fig22.png
Figure 22: (Color online) The power spectra S(ω) of the velocity time traces V(t) at ϕ = 0.846. (a) FD = 1.725, just above depinning. The solid line is a power law fit with α = −0.8. (b) FD = 6.0. A flat spectral signature appears at low frequencies.
In Fig. 22(a) we plot the power spectrum S(ω) of V(t) at ϕ = 0.846 for FD = 1.725, just above depinning. A power law fit to S(ω) ∝ ω−α gives α = 0.8 over a wide range of low frequencies and a small region of ω−2 dependence at high frequencies. The smallness of the ω−2 regime contrasts with the behavior of the spectra below jamming, where the ω−2 frequency dependence dominates over a large range until just below the jamming transition. In Fig. 22(b) we plot S(ω) at FD = 6.0, well above the depinning threshold. In this case, at low frequencies a white spectrum with α = 0 appears.

V.  SUMMARY

In summary, we numerically investigated the velocity fluctuations of a driven probe particle moving through a bidisperse assembly of disks in two dimensions. We consider the particular case of harmonically interacting disks with a 1:1.4 radius ratio. For a constant driving force on the probe particle, we find that the average probe velocity goes to zero continuously as ϕ approaches ϕJ from below and that the velocity fluctuations develop increasingly intermittent features close to ϕJ. The velocity distribution functions have long tails which fall off exponentially, similar to the force fluctuations observed in the slow drag experiments of Ref. [26]. The velocities very close to ϕJ are power law distributed, suggesting that the system is exhibiting fluctuations of a critical type. The exponent falls between −2.75 and −3.1, in agreement with recent experiments. Below ϕJ, the power spectrum of the velocity fluctuations has a Lorentzian form with a knee at a crossover frequency and an ω−2 behavior at higher frequencies, similar to the spectral signatures found in slow drag experiments [26]. Just below the jamming transition, the power spectrum changes shape and develops a 1/ω low frequency behavior.
The velocity-force curves are linear below jamming, but take a power law form close to jamming with an exponent of 1.4 that is close to the exponent of 1.5 often observed for plastic depinning. Above jamming, the probe particle depins only after a finite threshold force is applied. The threshold force increases with increasing ϕ. The velocity-force curves change curvature above jamming and have properties that are more consistent with elastic depinning than plastic depinning. The appearance of nonexponential velocity distributions, the onset of 1/ω noise and the development of power law velocity-force curves are all consistent with jamming having the signatures of a critical phenomenon, and also suggest that the onset of depinning of the probe particle shows criticality. From the velocity versus ϕ curves, we obtain an estimate for the correlation length exponent ν = 0.8−1.0, in agreement with recent studies [12,34] and somewhat larger than previous estimates [10,3].
We thank M. Hastings, L. Silbert, and S. Teitel for useful comments. This work was carried out under the auspices of the NNSA of the U.S. DoE at LANL under Contract No. DE-AC52-06NA25396.

References

[1]
A.J. Liu and S.R. Nagel, Nature (London) 396, 21 (1998).
[2]
C.S. O'Hern, L.E. Silbert, A.J. Liu, and S.R. Nagel, Phys. Rev. E 68, 011306 (2003).
[3]
J.A. Drocco, M.B. Hastings, C.J. Olson Reichhardt, and C. Reichhardt, Phys. Rev. Lett. 95, 088001 (2005).
[4]
L.E. Silbert, A.J. Liu, and S.R. Nagel, Phys. Rev. Lett. 95, 098301 (2005).
[5]
S. Henkes and B. Chakraborty, Phys. Rev. Lett. 95, 198002 (2005).
[6]
M. Wyart, L.E. Silbert, S.R. Nagel, and T.A. Witten, Phys. Rev. E 72, 051306 (2005).
[7]
J.M. Schwarz, A.J. Liu, and L.Q. Chayes, Europhys. Lett. 73, 560 (2006).
[8]
W.G. Ellenbroek, E. Somfai, M. van Hecke, and W. van Saarloos, Phys. Rev. Lett. 97, 258001 (2006).
[9]
T.S. Majmudar, M. Sperl, S. Luding, and R.P. Behringer, Phys. Rev. Lett. 98, 058001 (2007).
[10]
P. Olsson and S. Teitel, Phys. Rev. Lett. 99, 178001 (2007).
[11]
N. Xu, V. Vitelli, M. Wyart, A.J. Liu, and S.R. Nagel, Phys. Rev. Lett. 102, 038001 (2009).
[12]
C. Heussinger and J.-L. Barrat, Phys. Rev. Lett. 102, 218303 (2009).
[13]
T. Hatano, Phys. Rev. E 79, 050301(R) (2009).
[14]
D.A. Head, Phys. Rev. Lett. 102, 138001 (2009).
[15]
Z. Zhang, N. Xu, D.T.N. Chen, P. Yunker, A.M. Alsayed, K.B. Aptowicz, P. Habdas, A.J. Liu, S.R. Nagel, and A.G. Yodh, Nature (London) 459, 230 (2009).
[16]
R. Candelier and O. Dauchot, Phys. Rev. E 81, 011304 (2010).
[17]
C. Song, P. Wang, and H.A. Makse, Nature (London) 453, 629 (2008).
[18]
J. Brujic, C.M. Song, P. Wang, C. Briscoe, G. Marty, and H.A. Makse, Phys. Rev. Lett. 98, 248001 (2007).
[19]
H.P. Zhang and H.A. Makse, Phys. Rev. E 72, 011301 (2005).
[20]
M.B. Hastings, C.J. Olson Reichhardt, and C. Reichhardt, Phys. Rev. Lett. 90, 098302 (2003).
[21]
C. Reichhardt and C.J. Olson Reichhardt, Phys. Rev. Lett. 96, 028301 (2006).
[22]
P. Habdas, D. Schaar, A.C. Levitt, and E.R. Weeks, Europhys. Lett. 67, 477 (2004).
[23]
I. Gazuz, A.M. Puertas, Th. Voigtmann, and M. Fuchs, Phys. Rev. Lett. 102, 248302 (2009).
[24]
R. Albert, M.A. Pfeifer, A.-L. Barabasi, and P. Schiffer, Phys. Rev. Lett.  82, 205 (1999); I. Albert, P. Tegzes, B. Kahng, R. Albert, J.G. Sample, M. Pfeifer, A.-L. Barabási, T. Vicsek, and P. Schiffer, ibid.  84, 5122 (2000); D.J. Costantino, T.J. Scheidemantel, M.B. Stone, C. Conger, K. Klein, M. Lohr, Z. Modig, and P. Schiffer, ibid.  101, 108001 (2008).
[25]
R. Soller and S.A. Koehler, Phys. Rev. E 74, 021305 (2006).
[26]
J. Geng and R.P. Behringer, Phys. Rev. E 71, 011302 (2005).
[27]
R. Candelier and O. Dauchot, Phys. Rev. Lett, 103, 128001 (2009).
[28]
R.P. Behringer, D. Bi, B. Chakraborty, S. Henkes, and R.R. Hartley, Phys. Rev. Lett. 101, 268301 (2008).
[29]
K.E. Daniels and N.W. Hayman, J. Geophys. Res. 113, B11411 (2008).
[30]
J.J. Drozd and C. Denniston, Phys. Rev. E 78, 041304 (2008).
[31]
Z. Chen and C.C. Yu, Phys. Rev. Lett. 98, 057204 (2007).
[32]
C. Reichhardt and C.J. Olson Reichhardt, Phys. Rev. Lett. 90, 095504 (2003).
[33]
K. Desmond and S.V. Franklin, Phys. Rev. E 73, 031306 (2006).
[34]
S. Teitel (private communication).
[35]
C. Reichhardt and C.J. Olson, Phys. Rev. Lett. 89, 078301 (2002).
[36]
A. Pertsinidis and X.S. Ling, Phys. Rev. Lett. 100, 028303 (2008).
[37]
D. Domínguez, Phys. Rev. Lett. 72, 3096 (1994).
[38]
J. Watson and D.S. Fisher, Phys. Rev. B 55, 14909 (1997).
[39]
M. Dennin, J. Phys.: Condens. Matter 20, 283103 (2008).


File translated from TEX by TTHgold, version 4.00.

Back to Home