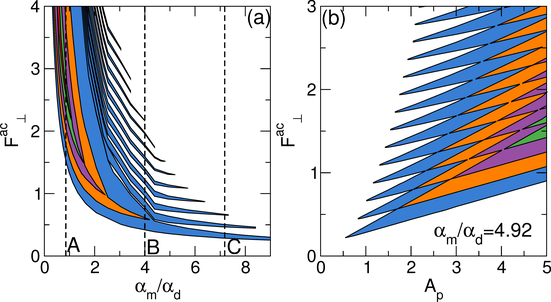
 Figure 6:
(a) A plot of Fac⊥ vs αm/αd
indicating all n=1 (blue) ratcheting regions, and the
inner envelopes of the n=2 (orange), 3 (purple), 4 (green), and 5 (red)
ratcheting regions.
The dashed lines marked A−C are the values of αm/αd
for which the velocity curves in figure 4 were obtained.
There is no ratchet effect at the overdamped limit of
αm/αd = 0, and the minimum ac amplitude required to
produce a ratchet effect decreases with increasing αm/αd.
(b) A plot of Fac⊥ vs Ap
for αm/αd = 4.92 indicating the ratcheting regions
with n=1 (blue), 2 (orange), 3 (purple), and 4 (green).
As the substrate strength increases, stronger ratchet effects appear.
|
