 Figure 1:
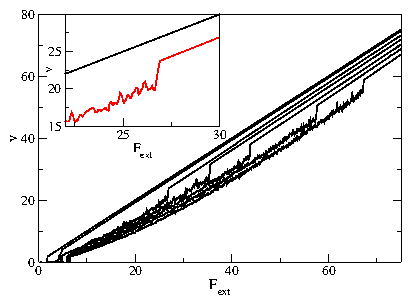
The velocity-force (v−F) curves for a single driven probe particle
in a system
with np = 0.85 and fp = 2.0 at
particle densities n = 0, 0.181, 0.292, 0.375, 0.484, 0.53,
and 0.59 (from top to bottom).
Inset:
The transition region for n = 0.375 (bottom)
along with the n = 0.181 curve (top).
|
