| |
|
|
|
Nv
∑
j=1
|
f0 K1 | ⎛
⎝
|
|ri − rj |
λ
| ⎞
⎠
|
|
^
r
|
ij
|
|
| |
and the force from pinning sites is
| |
|
|
Np
∑
k=1
|
|
fp
ξp
|
|ri − rk(p)| Θ | ⎛
⎝
|
ξp − |ri − rk(p) |
λ
| ⎞
⎠
|
|
^
r
|
ik
|
. |
| | (2) |
|
Here, Θ is the Heaviside step function,
ri (vi) is the location (velocity) of vortex i,
rk(p) is the location of pinning site k,
there are Np pinning sites and
Nv vortices,
∧rij=(ri−rj)/|ri−rj|,
∧rik=(ri−rk(p))/|ri−rk(p)|,
and we take η = 1.
We have taken advantage of the cut-off on the vortex interaction range to
parallelize our code. Using a one-dimensional domain decomposition, we
divide the sample into strips that are multiples of the interaction range
in width, place each strip on a separate node, and use message passing
techniques at the processor boundaries. Load balancing is simplified
by the repulsive nature of the interaction which tends to spread the vortices
evenly among the processors. With the flexible domain decomposition,
the number of processors can be varied without affecting the results.
Using roughly 104 hours on an IBM SP parallel computer,
we recorded more than 104 avalanches for each of
five combinations of np and fp.
A slowly increasing external field is modeled
by adding a single vortex to an unpinned region
along the sample edge whenever the system reaches mechanical
equilibrium [16,17,18,19] (we consider dynamical,
not thermal, instabilities).
This is analogous to adding a single grain of sand to a pile.
Most of these small field increases
result in only slight
shifts in vortex positions, but occasionally one or more vortices
become depinned, producing an avalanche.
We find that avalanche disturbances propagate as an uneven pulse, as seen
in Fig. 4 of Ref. [16].
Events
with longer lifetimes often contain more than one pulse of motion
(i.e., multiple oscillations in the total avalanche velocity)
[20].
By imaging individual avalanches in our samples,
we find that a chain of vortices is displaced in a typical event.
Each vortex in the chain is depinned, moves a
short distance, and comes to rest in a nearby pinning site. Vortices
outside the chain transmit stress by shifting very
slightly inside pinning sites,
but are not depinned.
Chain size varies from event
to event: in
some cases a chain spans the sample,
while in other events the chain
contains only three or four vortices.
In each case, although the disturbance may cross the sample, an individual
vortex does not. Thus, the time span of a typical avalanche is much
shorter than the time a single vortex takes to traverse the sample.
3. Channels
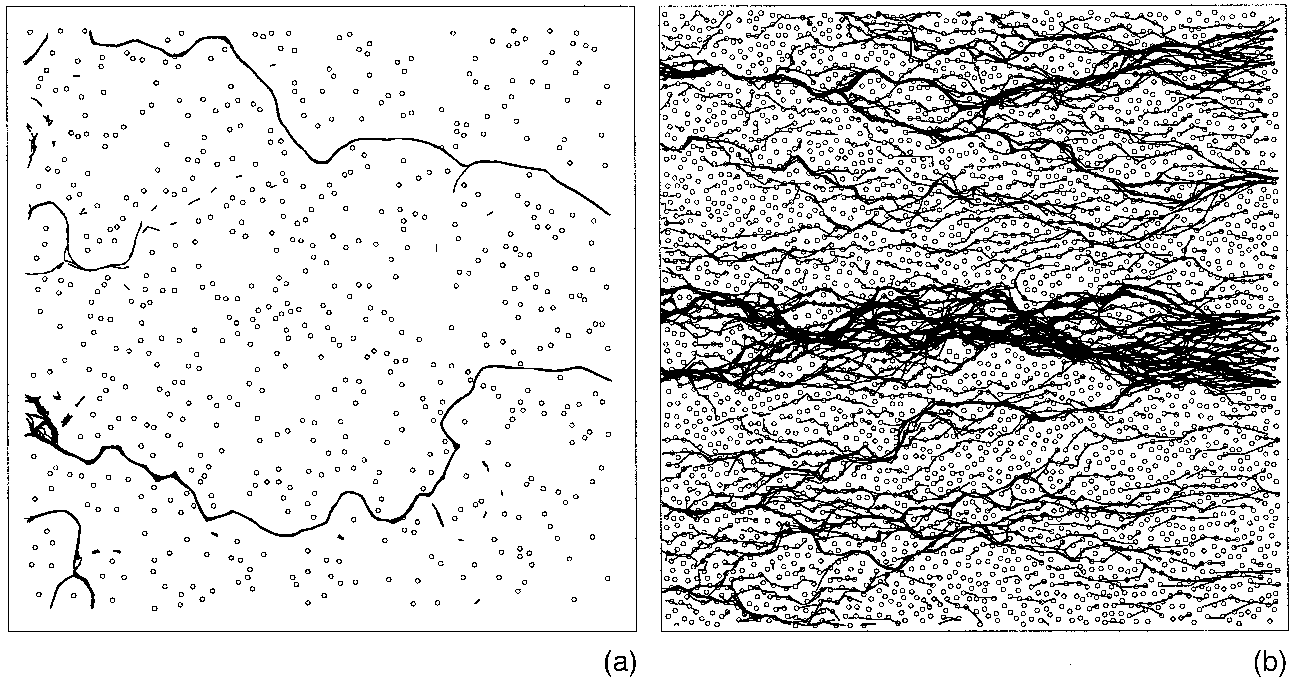
 Fig. 1:
Continuous
lines indicate the paths vortices follow
over an extended period of time covering many avalanches through two
24λ×26λ
samples with
fpmax=3.0f0 and different pinning densities:
(a) np=0.96/λ2 and
(b) np=5.93/λ2.
Open circles mark pinning sites.
The presence or absence of easy-flow channels is clearly dependent on
pin density. The channels present in (a) lead to avalanches with
characteristic sizes and lifetimes superimposed on
a broad distribution. Samples with
higher pinning density produce very broad distributions of
avalanche sizes.
Fig. 1:
Continuous
lines indicate the paths vortices follow
over an extended period of time covering many avalanches through two
24λ×26λ
samples with
fpmax=3.0f0 and different pinning densities:
(a) np=0.96/λ2 and
(b) np=5.93/λ2.
Open circles mark pinning sites.
The presence or absence of easy-flow channels is clearly dependent on
pin density. The channels present in (a) lead to avalanches with
characteristic sizes and lifetimes superimposed on
a broad distribution. Samples with
higher pinning density produce very broad distributions of
avalanche sizes.
|
When the pinning density is high, chains of moving vortices are equally likely
to form anywhere in the sample. As the pinning
density is lowered, vortices move only through well-defined
winding interstitial channels in which
vortices are weakly held in place only by the repulsion of other vortices
which sit in pinning sites.
To identify the cumulative pattern of flow channels for
different pinning parameters, in Fig. 1
we plot vortex trajectories with lines over the course of many avalanches.
A concentration of trajectory lines indicates a heavily-travelled region
of the sample. In Fig. 1a we show a
sample with low pinning density.
We see that all motion occurs through
narrow easy-flow interstitial channels. In these channels,
mobile interstitial vortices move plastically
[21,22,23,24,25] (note, in relation
to Ref. [25], that in our work, vortices are flux-gradient-driven, with no
artificial 'uniform force' applied to them)
around their strongly pinned neighbors
in a manner similar to that recently imaged
experimentally [10,11].
As the pin density increases, the
amount of interstitial pinning decreases and the
number of channels increases,
until at high pin densities (Fig. 1b),
there is no interstitial
flow and the vortices move only from pin to pin.
Here, where no well-defined easy-flow channel exists,
avalanches are spread evenly throughout the sample.
4. Avalanche lifetimes
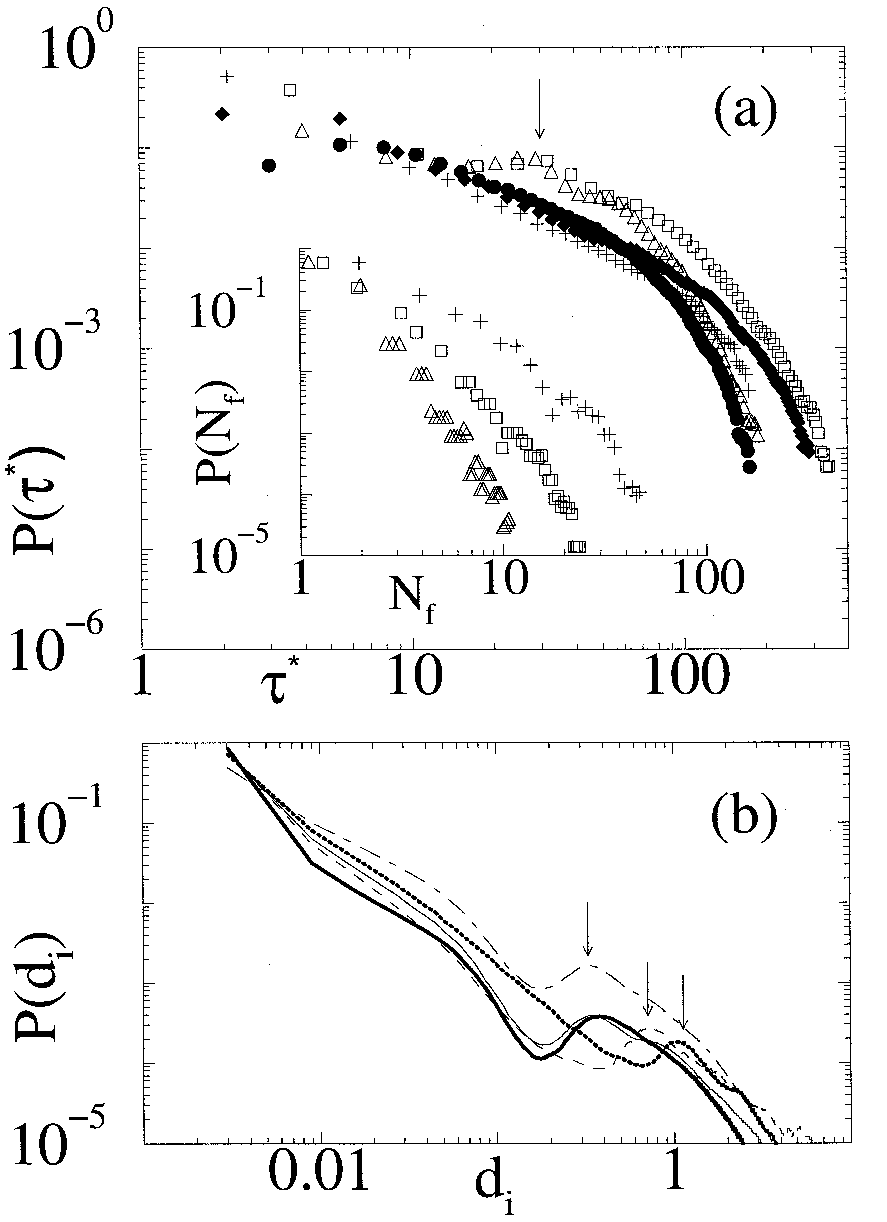
 Fig. 2:
Avalanche distributions: (a) lifetimes τ*;
(b) individual vortex displacements di.
Inset of (a);
number Nf of vortices falling off the edge of the sample.
Solid symbols refer to samples with high pin density
np=5.93/λ2, and differing pinning strengths:
plus signs (heavy solid line), fpmax=3.0f0;
filled diamonds (solid line), fpmax=1.0f0;
filled circles (dot-dashed line), fpmax=0.3f0.
Open symbols refer to samples with
fpmax=3.0f0 and
varying pinning densities:
plus signs (heavy solid line), np=5.93/λ2;
open squares (dashed line), np=2.40/λ2;
open triangles (heavy dotted line), np=0.96/λ2.
Fig. 2:
Avalanche distributions: (a) lifetimes τ*;
(b) individual vortex displacements di.
Inset of (a);
number Nf of vortices falling off the edge of the sample.
Solid symbols refer to samples with high pin density
np=5.93/λ2, and differing pinning strengths:
plus signs (heavy solid line), fpmax=3.0f0;
filled diamonds (solid line), fpmax=1.0f0;
filled circles (dot-dashed line), fpmax=0.3f0.
Open symbols refer to samples with
fpmax=3.0f0 and
varying pinning densities:
plus signs (heavy solid line), np=5.93/λ2;
open squares (dashed line), np=2.40/λ2;
open triangles (heavy dotted line), np=0.96/λ2.
|
We determine how the microscopic
pinning parameters affect avalanche size by finding
the total avalanche lifetime τ for each event. Since vortices
typically move, or 'hop', from pin to pin in samples with high
pinning density, a natural unit of time is the interval th a vortex spends
hopping between pinning sites, and so we use scaled lifetimes
τ*=τ/th. To find th, we assume that
each vortex hops
a distance dp = np−1/2, the average distance between
pinning sites, and that
the vortex speed vc is proportional to the depinning force,
where |fi| ≈ −fp.
This gives
| |
th= |
dp
vc
|
≈
ηfp−1 np−1/2.
, |
| | (4) |
|
The plot of P(τ*) in Fig. 2(a) for samples
with dense pinning shows that
in each case the distribution is very broad and can be written
as
over a range of τ*.
The form of P(τ*) changes noticeably when
the pinning density np
is reduced,
and an enhanced probability
for avalanches with a characteristic value
(arrow in Fig. 2a)
arises as a result of the appearance of easy-flow interstitial channels.
Many avalanches in these samples consist of a single sample-spanning
pulse of motion through one of these channels, seen in
Fig. 1a.
The estimated pulse lifetime produced by a straight channel is
where Nh is the number of vortices in the channel.
Since
where Lx
is the sample length, we find
which
gives a characteristic value of
| |
τ* = τest/th ≈ Lx√{nv}=26λ√{1.5/λ2} ≈ 30.
|
| | (9) |
|
This value
agrees well with the peak in the distribution of τ*,
indicated by an arrow in Fig. 2a.
5. Displacements
For all pin densities, only a small
fraction of the vortices move significantly while the rest
shift in pinning sites, as seen by considering
the distance di each vortex is displaced in an avalanche.
Vortices that hop from pin to pin create
a peak in P(di),
marked with arrows in Fig. 2b,
at
For those vortices that remain pinned and accumulate
stress in the vortex lattice,
di < dp, we can approximate the distribution
by
where ρ ∼ 1.4
for
all samples except ρ ∼ 1.2 for
[np=0.96/λ2, fpmax=3.0f0], and
ρ ∼ 0.9 for [np=5.93/λ2,
fpmax=0.3f0].
An analytical argument [16], sketched here,
predicts a similar ρ for all samples since
the distribution is generated only by pinned
vortices and is not
affected by the presence of easy-flow channels.
The addition of a vortex to the sample exerts a small additional force f on
an arbitrary vortex located a small distance r away (r << λ),
displacing this vortex a distance
| |
δu(r)=(f/η) δt ∼ K1(r/λ) ∼ 1/r.
|
| | (12) |
|
Since there
are
vortices a distance r from the
added vortex, we find
| |
ρ = −d lnδN / d lnδu=−(1/r)(−1/r)−1=1,
|
| | (14) |
|
in general agreement with our computed values of ρ,
6. Number of vortices leaving the sample
Altering the pinning parameters affects
the number of vortices Nf that exit the sample during an avalanche,
as shown in the plot of P(Nf) in the
inset of
Fig. 2a. If we approximate P(Nf)
for low Nf by the form
we find that
all samples with high pinning density, np=5.93/λ2,
have α ∼ 2.4. As np decreases, α
increases: α ∼ 3.4 for np=2.40/λ2 and
α ∼ 4.4 for np=0.96/λ2. When
all vortex motion occurs in an easy-flow interstitial
channel, α increases since the channel does not build up enough
stress to allow events with large Nf to occur. Smaller events continually
relieve the accumulated stress instead.
For example, with the small number of flux paths
in samples with np=0.96/λ2,
as in Fig. 1a, events with large Nf are rare, and α ∼ 4.4.
In samples with high pin density, even after the stress
in one vortex path has been depleted by a large avalanche, other areas
still contain enough stress to remain active in large and
small events while the depleted regions build up stress again.
This leads to a greater likelihood of large events and correspondingly smaller
values of α, α <~2.4.
7. Relation to experiment
Distributions similar to this high pin density case
have been obtained experimentally in
[7],
where values of α ranging from
are observed. The pinning density from grain
boundaries in the experimental sample is very high,
np ∼ 100/λ2,
so it is reasonable that the α values observed in [7]
are similar to the α values produced by our most densely
pinned samples. Broad distributions with
were also observed in [12],
in good agreement with both [7] and our results.
In addition, [12] finds a regime where avalanches of a
characteristic size occur, offering an experimental example
in which samples with a lower density of weaker pinning sites
produce narrower distributions, as we also observe.
8. Voltage noise power
Voltage noise power can be used to probe the interesting peak effect that
appears as an increase in the critical current with increasing applied
magnetic field. The resulting increase in noise power has been postulated
to result from plastic motion of the vortex lattice
[13]. We compare our simulation to experiment
by using the analog of an experimentally measured voltage signal,
the average vortex velocity
Our raw signal
vav,
seen in fig. 2 of Ref. [16],
strongly resembles experimentally observed voltages, as in
fig. 1 of Ref. [7].
To find the power spectra, we measure time in units of the
average time of flight tf of a single
vortex across the sample. Such units make it possible to compare our
work to experiments in which the time of flight is known.
For example, in Ref. [26] vortices
travelled 0.22 mm in about 7.2 ms.
Taking λ for YBCO to be λ=140 nm, the vortices in our
simulation travel the equivalent of 0.0036 mm, and if they are
considered to move at the same speed as the vortices of Ref.
[26], the time of flight
becomes tf ≈ 1.3 ms. In these units, the
spectra shown here range from 300 Hz to 3 MHz in frequency, so
the lower part of the frequency range may be compared with experiments.
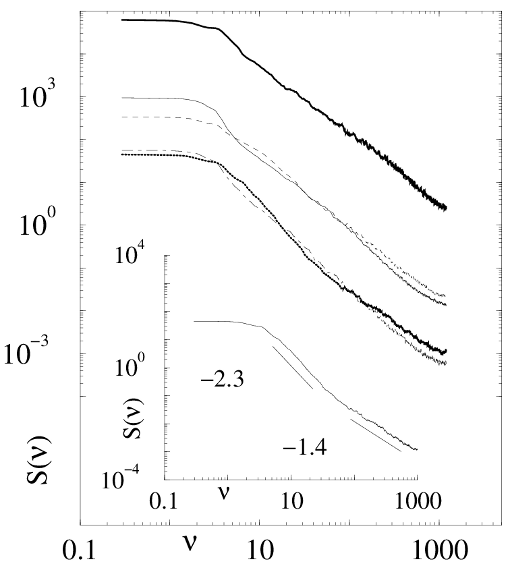 Fig. 3:
Voltage noise spectrum from each type of sample, with frequencies measured
in units of the inverse of the time of flight 1/tf.
Heavy solid line,
fpmax=3.0f0,
np=5.93/λ2;
solid line,
fpmax=1.0f0,
np=5.93/λ2;
dashed line,
fpmax=3.0f0,
np=2.40/λ2;
dot-dashed line,
fpmax=0.3f0,
np=5.93/λ2;
heavy dotted line,
fpmax=3.0f0,
np=0.96/λ2;
Each power spectrum was obtained from time series totalling 106
MD steps per sample. Inset: the spectrum of the voltage signal for a
sample with high pinning strength
fpmax=3.0f0 and low pinning density
np=0.96/λ2 has more than
one slope.
Fig. 3:
Voltage noise spectrum from each type of sample, with frequencies measured
in units of the inverse of the time of flight 1/tf.
Heavy solid line,
fpmax=3.0f0,
np=5.93/λ2;
solid line,
fpmax=1.0f0,
np=5.93/λ2;
dashed line,
fpmax=3.0f0,
np=2.40/λ2;
dot-dashed line,
fpmax=0.3f0,
np=5.93/λ2;
heavy dotted line,
fpmax=3.0f0,
np=0.96/λ2;
Each power spectrum was obtained from time series totalling 106
MD steps per sample. Inset: the spectrum of the voltage signal for a
sample with high pinning strength
fpmax=3.0f0 and low pinning density
np=0.96/λ2 has more than
one slope.
|
From the power spectra of
vav
for each of our samples, shown in Fig. 3,
it is clear that our simulated plastically moving vortex lattice produces
broad-band noise that changes in form in a manner consistent with
experiment [7,8].
The overall noise power in the simulations is reduced both as the pinning
density is reduced and as the pinning strength is lowered. For
frequencies ν ≤ 10-3, the spectrum is flat,
indicating that avalanches separated by times
≥ 103 MD steps are uncorrelated.
For ν ≥ 10-3, samples with a high density of pinning
sites produce spectra of the form
where β increases as the pinning strength decreases:
β=1.54 for fpmax=3.0f0,
β=1.66 for fpmax=1.0f0,
and β=1.93 for fpmax=0.3f0.
Since samples with stronger pinning effectively have a lower driving rate
than samples with weaker pinning, the change in slope appears consistent
with Ref. [7], where the slope
increased from
βexp(1)
∼ 1.5 to 2.0 as the driving rate increased.
The exponents observed here are also similar to those found by
Marley et al. [13], who
obtained exponents
βexp(2)
∼ 1.5 to 2.0 in the peak effect region near depinning
where plastic flow should be occurring.
The linear form of the spectra breaks down in samples with a lower
density of pinning sites, which have more correlated vortex motion due to
the presence of interstitial channels with typical avalanche
lifetimes
τ(102≤ν≤10-2).
This tends to produce a steeper slope in the power spectrum at low
frequencies
(10-3≤ν≤10-2). This is shown
in the inset of Fig. 3, where the spectra of these
samples have a region of relatively steep slope at lower frequencies and
a region with a more gentle slope at higher frequencies.
9. Conclusions
We have quantitatively shown how pinning determines the nature of vortex
avalanches. By using large-scale MD simulations, we observe pulses of
motion in chain-like disturbances through the sample. The presence or
absence of distinct channels for flow leads to a crossover from broad
distributions of avalanche size to characteristic sizes. Pinning strength
causes a transition between strongly plastic flow to mildly plastic,
'semi-elastic' flow. Lowering the pinning density causes the very broad
avalanche distributions to develop characteristic sizes, as well as
changing the nature of the voltage noise spectrum.
Acknowledgements
Computer services were provided by: the Maui High Performance Computing
Center, sponsored in part by the Phillips Laboratory, Air Force Materiel
Command, USAF, under cooperative agreement number F29601-93-2-0001;
and by the University of Michigan
Center for Parallel Computing, partially funded by NSF grant
CDA-92-14296. CO was supported by the NASA Graduate Student Researchers
Program.
References
- f
- Permanent address.
- [1]
- G.A. Held et al., Phys. Rev. Lett. 65 (1990) 1120.
- [2]
-
M. Bretz et al., Phys. Rev. Lett. 69 (1992) 2431.
- [3]
-
H.M. Jaeger, S.R. Nagel, R.P. Behringer, Rev. Mod. Phys. 68 (1996)
1259, and references therein.
- [4]
- K.L. Babcock,
R.M. Westervelt, Phys. Rev. Lett. 64 (1990)
2168.
- [5]
- B. Plourde, F. Nori,
M. Bretz, Phys. Rev. Lett. 71 (1993)
2749.
- [6]
-
O. Narayan, D.S. Fisher, Phys. Rev. B 49 (1994) 9469.
- [7]
- S. Field et al., Phys. Rev. Lett. 74 (1995) 1206.
- [8]
- R.J. Zieve et al., Phys. Rev. B 53 (1996) 11849.
- [9]
- O. Pla, F. Nori,
Phys. Rev. Lett. 67 (1991) 919.
- [10]
-
T. Matsuda et al., Science 271 (1996) 1393.
- [11]
-
F. Nori, Science 271 (1996) 1373.
- [12]
- E.R. Nowak et al.,
Phys. Rev. B 55 (1997) 11702.
- [13]
- A.C. Marley et al.,
Phys. Rev. Lett. 74 (1995) 3029.
- [14]
- P. Bak, C. Tang,
K. Wiesenfeld,
Phys. Rev. A 38 (1988) 364.
- [15]
- C.P. Bean, Rev. Mod. Phys.
36 (1964) 31.
- [16]
-
C.J. Olson et al.,
Phys. Rev. B 56, in press, available
in Ref. [20].
- [17]
-
C. Reichhardt et al., Phys. Rev. B 52 (1995) 10441.
- [18]
-
C. Reichhardt et al., Phys. Rev. B 53 (1996) R8898.
- [19]
-
C. Reichhardt et al., Phys. Rev. B 54 (1996) 16108.
- [20]
-
Brief vortex avalanche videos are available at
http://www-personal.engin.umich.edu/~nori
- [21]
-
R.D. Merithew et al., Phys. Rev. Lett.
77 (1996) 3197.
- [22]
-
M.C. Faleski, M.C. Marchetti, A.A. Middleton, Phys. Rev. B 54 (1996) 12427.
- [23]
-
H.J. Jensen et al., Phys. Rev. B 38 (1998) 9235.
- [24]
-
A.E. Koshelev, V.M. Vinokur, Phys. Rev. Lett. 73 (1994) 3580.
- [25]
-
N. Gronbech-Jensen, A.R. Bishop, D. Dominguez, Phys. Rev. Lett. 76 (1996)
2985.
- [26]
-
G. D'Anna et al., Phys. Rev. Lett. 75 (1995) 3521.
File translated from
TEX
by
TTHgold,
version 4.00.
Back to Home
|