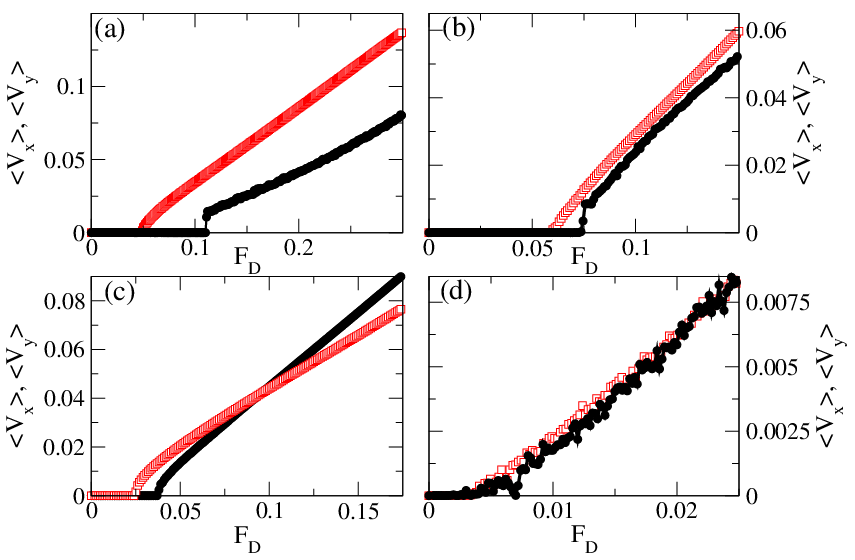
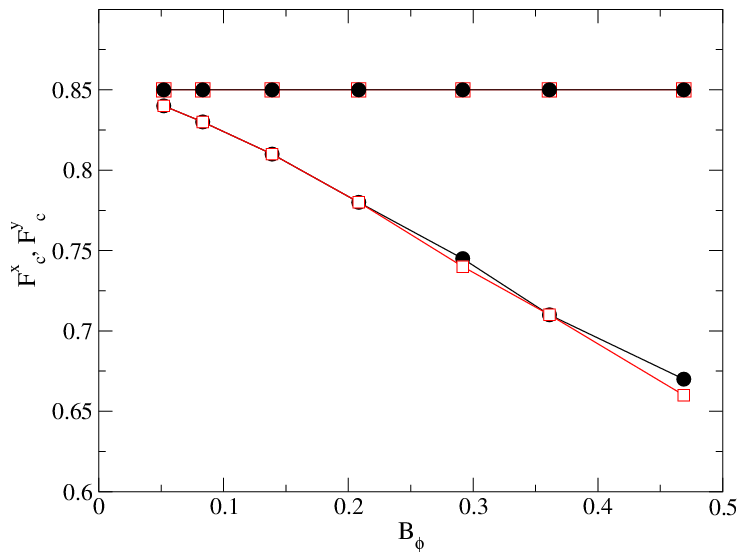
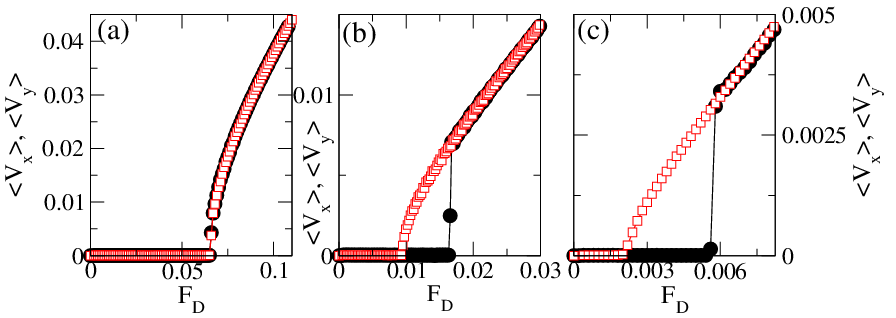
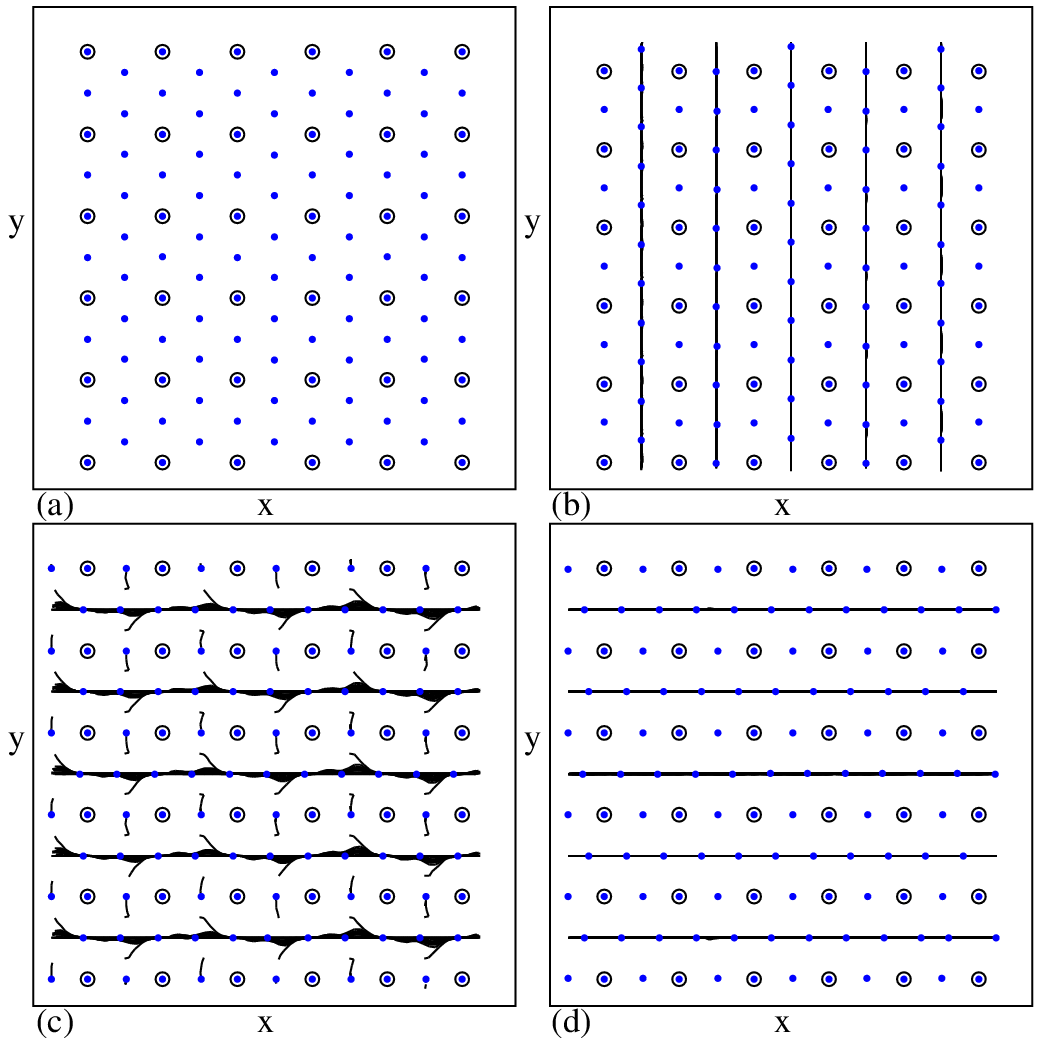
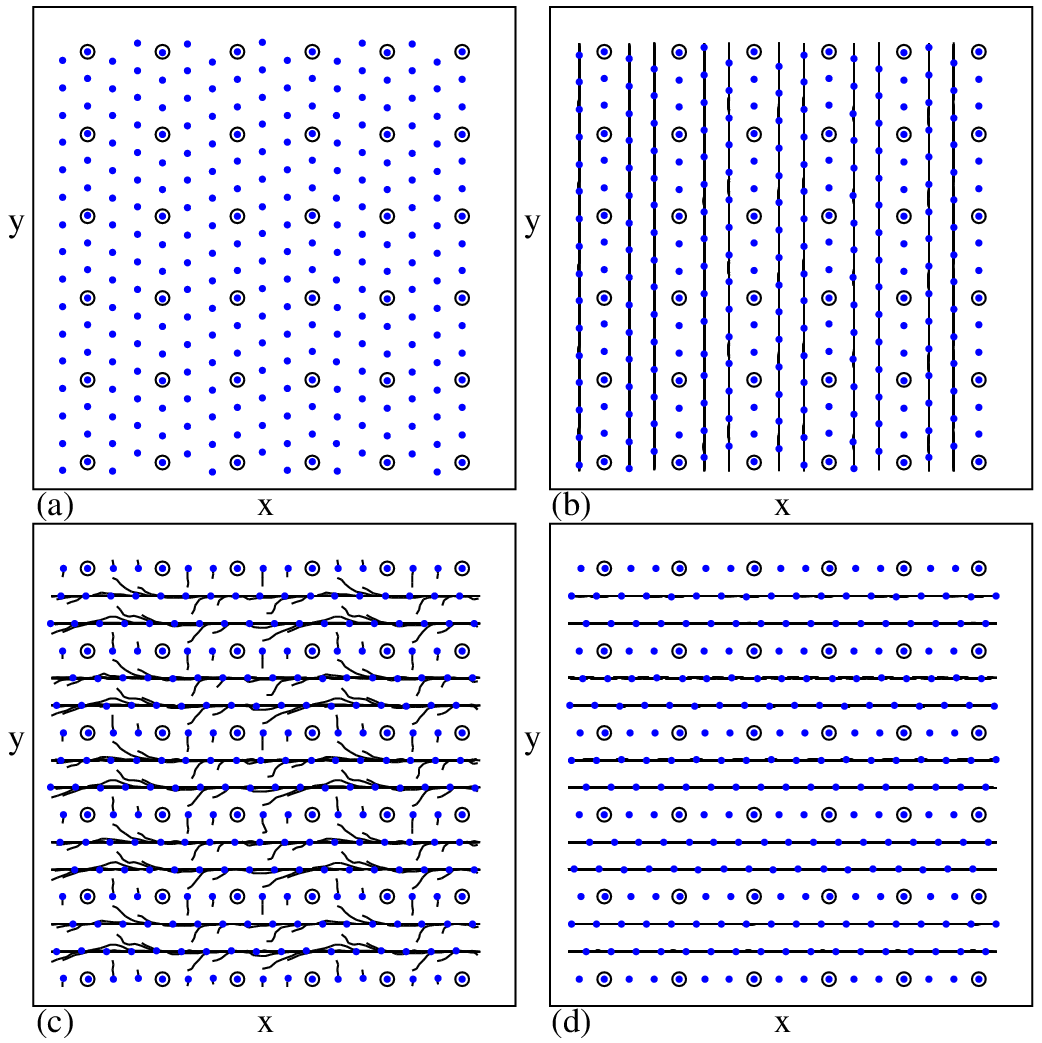
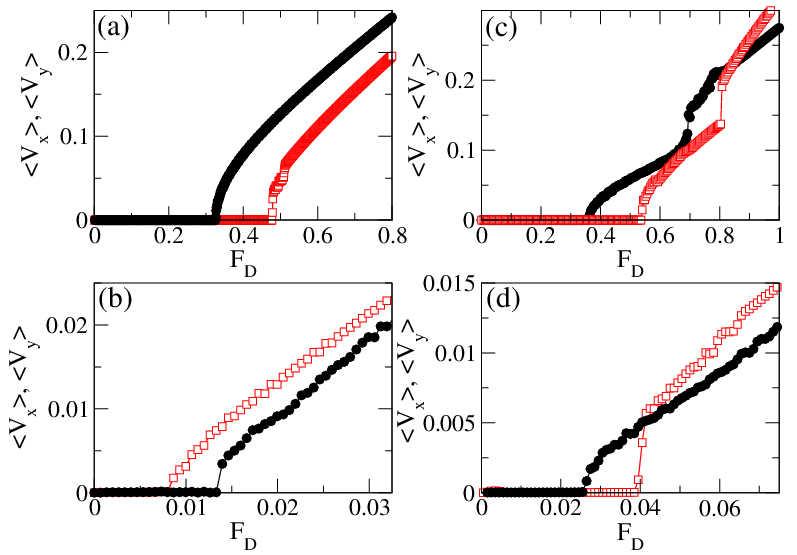
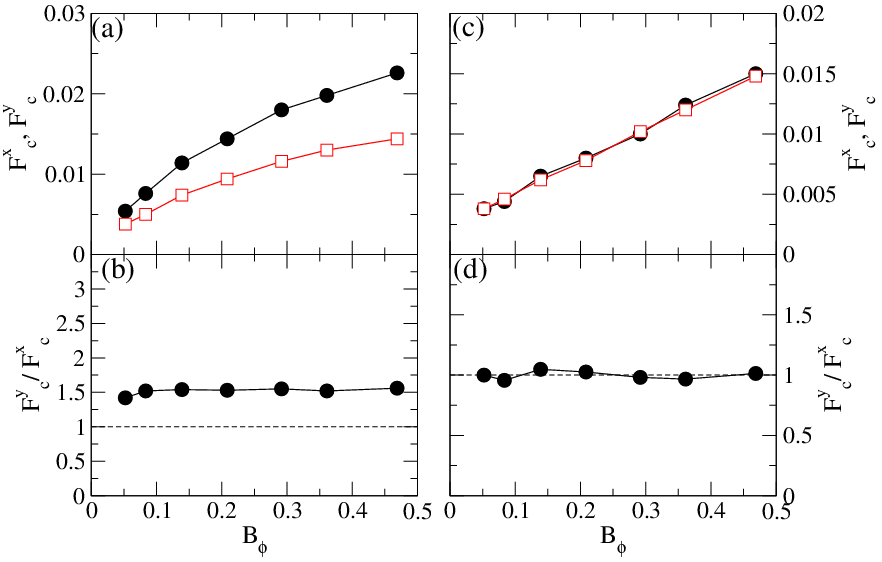
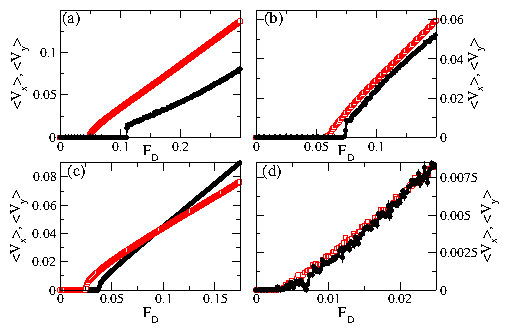
Physical Review B 79, 134501 (2009)

Transport Anisotropy as a Probe of the Interstitial Vortex State in Superconductors with Artificial Pinning Arrays

C. Reichhardt and C.J. Olson Reichhardt

Theoretical Division, Los Alamos National Laboratory, Los Alamos, New Mexico 87545, USA

(Received 19 November 2008; revised manuscript received 24 February 2009; published 1 April 2009)

We show using simulations that when interstitial vortices are present in superconductors with periodic pinning arrays, the transport in two perpendicular directions can be anisotropic. The degree of the anisotropy varies as a function of field due to the fact that the interstitial vortex lattice has distinct orderings at different matching fields. The anisotropy is most pronounced at the matching fields but persists at incommensurate fields, and it is most prominent for triangular, honeycomb, and kagomé pinning arrays. Square pinning arrays can also show anisotropic transport at certain fields in spite of the fact that the perpendicular directions of the square pinning array are identical. We show that the anisotropy results from distinct vortex dynamical states and that although the critical depinning force may be lower in one direction, the vortex velocity above depinning may also be lower in the same direction for ranges of external drives where both directions are depinned. For honeycomb and kagomé pinning arrays, the anisotropy can show multiple reversals as a function of field. We argue that when the pinning sites can be multiply occupied such that no interstitial vortices are present, the anisotropy is strongly reduced or absent.
I. INTRODUCTION
II. SIMULATION AND SYSTEM
III. ANISOTROPY IN TRIANGULAR PINNING ARRAYS
A. Effect of Pinning Strength
B. Weak Pinning Limit
C. Effect of Changing Bϕ
D. Anisotropy for B/Bϕ ≤ 1
E. Temperature Effects
IV. ANISOTROPY IN SQUARE PINNING ARRAYS
V. ANISOTROPY IN HONEYCOMB AND KAGOME PINNING ARRAYS
VI. SUMMARY
References


I.  INTRODUCTION

Vortices in superconductors interacting with artificial arrays of periodic pinning exhibit a wide range of commensurability and dynamical effects that can be observed readily in critical current, transport, and other bulk measurements [1,2,3,4,5,6,7,8,9,10]. Advances in lithography techniques permit the creation of pinning arrays in which the size, shape, and composition of the individual pinning sites and the global geometry can be well controlled [2,3,4,5,6,7,8,9,10,11,12,13,14]. Commensurability effects in these systems occur when the number of vortices equals an integer multiple of the number of pinning sites, resulting in peaks or anomalies in bulk measurements as a function of field. At the first matching field, there is one vortex per pinning site, and as the field is further increased, additional vortices can be located either at the pinning sites in the form of pinned multi-quanta vortices [3,4,15,16,17,18,19], or in the interstitial regions between the pinning sites. The interstitial vortices can be effectively pinned by the repulsive interactions from the vortices at the pinning sites, which create a caging potential [6,5,20,21,22,19,23,24]. It is also possible for mixed vortex pinning to occur in which the first few matching fields have only pinned multi-quanta vortices until the pinning sites are saturated, while for higher matching fields the additional vortices are located in the interstitial regions [3,6,13,15,16,19]. Conversely, it is also possible that interstitial vortices appear at the lower matching fields, but that as the vortex-vortex interactions increase at higher matching fields, multi-quanta vortices will begin to form at the pinning sites [19].
Interstitial vortex lattice crystals in square periodic pinning arrays have been observed directly with Lorentz microscopy, which revealed that there are several distinct types of interstitial vortex structures that have symmetries different from that of the triangular vortex lattice [6]. The same types of vortex structures have been produced in simulations of square pinning arrays [20,21], while simulations have also shown that similar vortex structures can form in triangular [20], rectangular [25,24], honeycomb [26], and kagomé pinning arrays [26,27]. Other numerical works indicated that a rich variety of composite lattices with multiple and interstitial vortex configurations are possible [22,19] and that new types of interstitial vortex configurations can occur for arrays of antipinning sites [28].
Vortex imaging experiments provide direct evidence for both multi-quanta vortex pinning and the formation of ordered interstitial vortex lattice structures [15,16]. Anomalies at matching fields found in bulk measurements occur for both multi-quanta vortex pinning and interstitial vortex pinning, so without direct imaging it can be difficult to determine whether multi-quanta or interstitial vortex pinning is occurring [18]. In some cases, the presence of interstitial vortices can only be inferred from the shapes and characteristics of the current voltage curves or from phase locking experiments [5,29]. It would be highly desirable to identify additional clear signatures in transport measurements that can distinguish between interstitial vortex pinning and multi-quanta vortex pinning and that can also reveal the types of vortex lattice symmetries that are present.
An anisotropic response was recently measured for the critical current applied in two perpendicular directions to a triangular pinning array in recent experiments and simulations [30,31]. The experiments were performed on several different samples and the same anisotropic response appeared in each one, while the anisotropy observed in the simulations agreed with that seen in the experiments, suggesting that the behavior is due to distinct intrinsic features of the vortex dynamics. The simulations show that the vortex flow patterns are different for the two directions of applied current, which could account for the anisotropic response. The anisotropy is particularly pronounced at the second matching field but is absent at the first matching field, which suggests that depinning of the interstitial vortices is responsible for the anisotropy. Interestingly, for lower temperatures the experiments showed that the critical current anisotropy vanished at both the first and second matching fields but persisted at the third matching field, suggesting that multi-quanta vortex pinning occurs at the second matching field at low temperatures. These results indicate that the presence of anisotropy can be a useful way to probe the interstitial vortex state and the type of vortex ordering that occurs at different matching fields.
The experiments and simulations of Refs. [30,31] only examined a triangular pinning array up to the third matching field. In this work we study anisotropic transport for a much wider range of fields and system parameters for triangular, square, honeycomb, and kagomé pinning arrays. For the triangular array we find a variety of distinct anisotropic behaviors due to the differing symmetries of the interstitial vortex lattice at different matching fields. For example, at certain matching fields the vortex lattice is disordered and the anisotropy vanishes. For honeycomb and kagomé pinning arrays, an even richer anisotropic behavior occurs due to the formation of vortex molecular crystal states [26] with additional rotational degrees of freedom, resulting in a series of reversals in the anisotropy as a function of field. Remarkably, we find that it is also possible for square pinning arrays to show anisotropic transport even though the two perpendicular directions of the pinning lattice are identical. This occurs at certain matching fields where a triangular vortex structure forms, such that one driving direction is oriented with the easy-shear direction of the vortex lattice. Anisotropic transport measurements for vortices in periodic pinning arrays have already been shown to be experimentally feasible, and experiments have been performed in which the current is injected in two directions for samples with rectangular pinning arrays or asymmetric pinning shapes, revealing anisotropic depinning thresholds [32,33,34]. Although our work is focused on superconducting vortices, our results should be general to the class of systems of particles interacting with periodic substrates where both pinned and interstitial particles are present. Examples of this type of system include colloidal particles in periodic pinning [35,36] and charged metallic balls [37].
Fig1.png
Figure 1: The pinning site locations (open circles) for (a) a triangular pinning array, (b) a square pinning array, (c) a honeycomb pinning array, and (d) a kagomé pinning array. The driving force is applied along y to determine the depinning force Fyc and along x to determine Fxc.

II.  SIMULATION AND SYSTEM

We consider a two-dimensional system with periodic boundary conditions in the x and y-directions of size L ×L. The magnetic field B is applied out of the plane in the z-direction, while Nv vortices and Np pinning sites are placed within the system for a vortex density of nv = Nv/L2 and a pinning density of np = Np/L2. The matching field Bϕ is defined as the field at which the number of vortices equals the number of pinning sites, Nv=Np. In Fig. 1 we show representative examples of the triangular, square, honeycomb, and kagomé pinning geometries used in this work, and indicate the x and y directions along which current is applied. The initial vortex positions are prepared by simulated annealing with no applied drive, and then the vortex velocities are measured in the presence of a driving force that is applied in the x direction. The driving force corresponds to the Lorentz force generated by an applied current, while the vortex velocities are proportional to the voltage response that would be measured experimentally. We repeat the simulation from the same initial vortex positions with the driving force applied in the y direction, and compare the velocity response 〈Vx〉 and 〈Vy〉 and the critical depinning force Fyc and Fxc for the two driving directions.
The time evolution of the vortex dynamics is governed by integrating Nv coupled overdamped equations of motion. The equation of motion for a single vortex i at position Ri is given by
η d Ri

dt
= Fvvi + Fvpi + FD + FTi .
(1)
Here the damping constant η = ϕ20d/2πξ2 ρN, where d is the sample thickness, η is the coherence length, ρN is the normal-state resistivity, and ϕ0 = h/2e is the elementary flux quantum. The vortex-vortex interaction force is
Fvvi = Nv

ji 
f0K1
Rij

λ

^
R
 

ij 
,
(2)
where K1 is the modified Bessel function, λ is the London penetration depth, the unit of force is f0 = ϕ20/2πλ3, Rij=|RiRj|, and Rij = (RiRj)/Rij. The vortex-vortex interaction force falls off sufficiently rapidly that a cutoff can be placed at Rij = 6λ. Use of a longer cutoff of Rij=12λ produces identical results. An additional short range cutoff is placed at Rij=0.1λ to avoid a divergence in the force. The pinning sites are modeled as attractive parabolic wells of radius Rp and strength Fp with Fvpi = ∑kNpf0FpRp−1Rik(p)Θ((RpRik(p))/λ)R(p)ik. Here R(p)k is the location of pinning site k, Rik(p)=|RiRk(p)|, Rik(p)=(RiRk(p))/Rik(p), and Θ is the Heaviside step function. The pinning sites are arranged in a triangular, square, honeycomb, or kagomé array. The external drive FD=FDx or FD=FDy is a constant force that is uniformly applied to all of the vortices. The thermal force FTi is used during the simulated annealing procedure and has the following properties: 〈FTi(t)〉 = 0 and 〈FTi(t)FTj(t)〉 = 2ηkB Tδijδ(tt). We decrement the temperature by 0.0002 every 1000 simulation time steps. After the initialization, the applied drive is imposed in increments of δFD = 0.1 every 103 simulation time steps. The velocity-force curves are obtained by averaging the velocity every 103 simulation time steps: 〈Vα〉 = Nv−1Nvi vi·α, where α = x, y. Here vi = dRi/dt. The critical depinning forces in the x and y directions, Fcx and Fcy, are determined by the criterion 〈Vα〉 = 0.001.
Fig2.png
Figure 2: The depinning forces Fxc (light line) and Fyc (dark lines) vs B/Bϕ for a triangular pinning lattice with Fp = 0.85, Rp = 0.35λ, and np = 0.0833/λ2. Inset: the same data showing a highlight of the region from 1.0 < B/Bϕ < 5.0. Open squares: Fxc; filled circles: Fyc.
Fig3.png
Figure 3: Velocity-force curves for driving in the x-direction, 〈Vx〉 (open squares), and in the y-direction, 〈Vy〉 (filled circles) for the triangular pinning lattice system in Fig. 2. (a) At B/Bϕ = 2, the slope dVy/dFD < dVx/dFD. (b) At B/Bϕ = 3, dVy/dFD=dVx/dFD. (c) At B/Bϕ = 4, dVx/dFD < dVy/dFD, resulting in a crossing in the velocity-force curves near FD = 0.1. (d) At B/Bϕ = 5, the depinning is isotropic.
Fig4.png
Figure 4: The ratio Fyc/Fxc vs B/Bϕ obtained from the system in Fig. 2. The dashed line indicates Fyc/Fxc=1. The depinning is strongly anisotropic at the matching fields B/Bϕ = 2, 3, 4, 9, and 12.

III.  ANISOTROPY IN TRIANGULAR PINNING ARRAYS

We first consider the depinning forces for the x and y-directions in the triangular pinning lattice illustrated in Fig. 1(a) with Fp=0.85, np=0.0833/λ2, and Rp=0.35λ. In Fig. 2 we plot Fcx and Fcy vs B/Bϕ along with a detail of the region from 1.0 < B/Bϕ < 5.0. In general Fcy > Fcx at most of the commensurate fields. The anisotropy at incommensurate fields is most pronounced for 1.0 < B/Bϕ < 3.0, as shown in the inset of Fig. 2. In previous simulations a similar anisotropy was observed for this range of fields [31]. For B/Bϕ > 3.0 both Fcx and Fcy are small, so it is difficult to determine whether the depinning is anisotropic at incommensurate fields. At the matching fields B/Bϕ=7, 9, and 12, where the depinning forces are high, Fcx and Fcy can be measured accurately. In Fig. 3 we plot representative velocity-force curves for driving in both the x and y directions at B/Bϕ=2, 3, 4, and 5. There is a clear anisotropy in the depinning force with Fcy > Fcx at B/Bϕ=2, 3, and 4 in Figs. 3(a,b,c), while at B/Bϕ = 5 in Fig. 3(d), the depinning is isotropic. This can be seen more clearly in the plot of the anisotropy Fyc/Fxc at the matching fields, shown in Fig. 4. The anisotropy is largest for B/Bϕ = 2, 4, and 9, weaker for B/Bϕ=3 and 12, and essentially absent at B/Bϕ=1, 5, 6, 7, 8, 10, and 11. Corresponding to this, there are no peaks in the depinning force at B/Bϕ=5, 6, 8, 10, and 11 in Fig. 2. At the fields with isotropic depinning Fcy/Fcx ≈ 1, the overall vortex lattice is disordered, while at the other matching fields where anisotropic depinning occurs, ordered vortex lattices form. Previous numerical work for triangular pinning arrays at fields up to B/Bϕ=9 showed the same features in the critical depinning force as well as the existence of disordered lattices at the matching fields B/Bϕ=5, 6, and 8 [20]. From a geometric construction, it can be shown that a triangular vortex lattice can be placed on a triangular pinning lattice at the integer matching fields N = m2 + n2 + nm, where n and m are integers [20]. This predicts the formation of triangular vortex lattices at fields with N = 1, 3, 4, 7, 9, and 12, in agreement with our observation of a peak in Fc at each of these fields. The geometric construction does not predict the formation of a triangular lattice at B/Bϕ = 2; however, a strong matching peak appears at this field both in Fig. 2 and in the previous work [20]. The peak at B/Bϕ=2 occurs due to the formation of an ordered honeycomb vortex lattice structure, rather than a triangular vortex lattice. In general, we expect to find a peak in the critical current at fields where a triangular or other ordered vortex lattice structure forms. Figures 2 and 4 also show that although there is a peak in Fc at B/Bϕ = 7, where a triangular vortex lattice forms, there is no anisotropy for this field and Fcy/Fcx ≈ 1.
Fig5.png
Figure 5: Vortex positions (black dots), pinning site locations (open circles), and vortex trajectories (black lines) for the triangular pinning lattice system in Fig. 2. (a) The vortices form a honeycomb configuration at FD = 0 and B/Bϕ = 2. (b) The vortex trajectories just above depinning for driving in the x-direction at B/Bϕ=2. The vortices channel between the pinning rows. (c) Vortex trajectories just above depinning for driving in the y-direction at B/Bϕ=2. The moving interstitial vortices wind around the occupied pinning sites. (d) The vortices form a triangular configuration at FD = 0 and B/Bϕ = 3. (e) The vortex trajectories just above depinning for driving in the x-direction at B/Bϕ=3 show an ordered interstitial flow of vortices between the pinning sites. (f) Vortex trajectories just above depinning for driving in the y-direction at B/Bϕ=3. Here the flow is disordered.
In order to explain the different degrees of anisotropy that appear at different fields, we analyze the vortex positions and trajectories for driving in the x and y directions. Figure 5(a) shows the ordered honeycomb vortex lattice structure that forms at FD=0 for B/Bϕ=2 on a triangular pinning lattice. When driven in the x-direction, the vortices can easily form slightly undulating channels of flow that pass between the filled pinning sites, as illustrated in Fig. 5(b). For driving in the y-direction, the pinned vortices act as barriers that prevent the formation of simple flow channels, and the interstitial vortices can only move by making significant excursions into the x-direction, as illustrated in Fig. 5(c) for a drive just above depinning. As a result, a larger external force is required to cause depinning in the y-direction, and Fcy > Fcx. The onset of motion in the y-direction is very sharp, as seen by the jump in the velocity-force curve in Fig. 3(a), and after a brief initial period of disordered motion, the vortex flow quickly organizes into the pattern shown in Fig. 5(c). We observe similar motions just above depinning in the x and y-directions at the incommensurate fields for 1.0 < B/Bϕ < 2.0; however, the presence of vacancies in the honeycomb vortex lattice causes certain rows of interstitial vortices to depin at a lower value of FD than at the commensurate fields. The velocity-force curves at B/Bϕ = 2.0 shown in Fig. 3(a) indicate that dVy/dFD < dVx/dFD, meaning that the vortex velocity has a lower slope as a function of increasing drive in the y-direction than in the x-direction, even though the same number of vortices are moving for either direction of drive. This difference is a result of the fact that the vortex motion for y-direction driving has much larger excursions transverse to the driving direction since the interstitial vortices must go out of their way to pass around the pinned vortices.
At B/Bϕ = 3 on a triangular pinning lattice, the overall vortex lattice ordering at FD = 0 is triangular, as shown in Fig. 5(d). The vortices move in slightly winding channels upon application of a drive in the x-direction, as seen in Fig. 5(e); these structures are similar to the channels that form at B/Bϕ=2 in Fig. 5(b). For depinning in the y-direction at B/Bϕ=3, the pinned vortices again create a barrier to the formation of simple channels of interstitial vortex flow; however, unlike the ordered and strongly winding channels that form at B/Bϕ=2, for B/Bϕ=3 the vortices move in a disordered fashion just above depinning, as illustrated in Fig. 5(f). An ordered flow state similar to that shown in Fig. 5(c) does not occur for B/Bϕ=3 until a much higher value of FD is applied. This result indicates that in addition to the anisotropy in Fyc/Fxc, there are also strongly different vortex velocity fluctuation characteristics for driving along the x and y-directions at B/Bϕ = 3. Narrow band noise signatures should arise from the synchronized vortex motion that occurs for driving along the x-direction, while for driving in the y-direction the velocities are more random and a broad band noise signature should appear. In mode-locking experiments, where an external ac drive is imposed along with an applied dc drive, Shapiro type steps would appear for the ordered motion along the x-direction, while Shapiro steps would be absent for driving along the y-direction. Shapiro steps could be induced for both driving directions at B/Bϕ = 2 since both vortex flow patterns show synchronized motion; however, some of the characteristics of the Shapiro steps might differ for the two directions since the meandering of the vortices is distinct in the x and y-directions.
Fig6.png
Figure 6: Vortex positions (black dots), pinning site locations (open circles), and vortex trajectories (black lines) for the triangular pinning lattice system in Fig. 2. (a) At FD = 0 and B/Bϕ = 4 a triangular vortex lattice forms. (b) The vortex trajectories just above depinning for driving in the x-direction at B/Bϕ=4. A portion of the interstitial vortices move in one-dimensional channels between the rows of pinning sites. (c) The vortex trajectories just above depinning for driving in the y-direction at B/Bϕ=4. The interstitial vortices flow in winding channels around the pinning sites. (d) At FD = 0 and B/Bϕ = 5, the vortex lattice is disordered. (e) The vortex trajectories just above depinning for driving in the x-direction at B/Bϕ=5. The vortex flow pattern is disordered. (f) Vortex trajectories just above depinning for driving in the y-direction at B/Bϕ=5. The same type of disordered flow pattern seen for x-direction driving appears for y-direction driving.
A triangular vortex lattice with a single row of interstitial vortices between each row of pinning sites forms for B/Bϕ = 4 at FD = 0, as shown in Fig. 6(a). Just above the depinning transition for driving in the x-direction, a portion of the interstitial vortices depin into the one-dimensional channels illustrated in Fig. 6(b). Here, one-third of the interstitial vortices remain immobile in the interstitial regions between pinning sites; these immobile interstitial vortices depin at a higher value of FD that is outside the range of driving forces shown in Fig. 3(c). For driving in the y-direction, all of the interstitial vortices depin simultaneously and flow in winding channels around the occupied pinning sites, as shown in Fig. 6(c). The velocity-force curves shown in Fig. 3(c) indicate that although Fcy > Fcx for B/Bϕ = 4, dVx/dFD < dVy/dFD. As a result, the two velocity-force curves cross near FD = 0.1. The slope dV/dFD is steeper for the y-direction driving since all the interstitial vortices take part in the motion, whereas for the x-direction driving, only 2/3 of the interstitial vortices are moving.
At B/Bϕ = 5 and FD=0 the vortex lattice is disordered, as seen in Fig. 6(d), and the depinning is isotropic. Figure 6(d,e) shows that the same type of disordered vortex motion occurs for depinning in both the x and y-directions. In general, we observe disordered flow states in both driving directions at the other matching fields where a disordered vortex lattice forms, including B/Bϕ = 6, 8, 10, and 11.
Fig7.png
Figure 7: Vortex positions (black dots), pinning site locations (open circles), and vortex trajectories (black lines) for the triangular pinning lattice system in Fig. 2. (a) At FD = 0 and B/Bϕ = 9, a triangular vortex lattice forms. (b) The vortex trajectories just above depinning for driving in the x-direction at B/Bϕ=9. Two rows of interstitial vortices move in one-dimensional paths between the rows of pinning sites while a portion of the interstitial vortices remain pinned. (c) The vortex trajectories just above depinning for driving in the y-direction at B/Bϕ=9. A combination of ordered and disordered flow occurs. (d) At FD = 0 and B/Bϕ = 12, a triangular vortex lattice forms which is aligned with the y direction. (e) The vortex trajectories just above depinning for driving in the x-direction at B/Bϕ=12. Three rows of interstitial vortices move between the rows of pinning sites. (f) Vortex trajectories just above depinning for driving in the y-direction at B/Bϕ=12 show the existence of disordered flow.
At B/Bϕ = 9, the depinning thresholds and velocity-force curves are very similar to those found for B/Bϕ = 4 since the triangular vortex lattices that form at these two fields have the same orientation. In Fig. 7(a), the vortex configuration at FD=0 for B/Bϕ=9 contains two rows of interstitial vortices between adjacent pairs of pinning rows, whereas at B/Bϕ=4, Fig. 6(a) shows that there is only one row of interstitial vortices between each pair of pinning rows. Just above the depinning transition for x-direction driving at B/Bϕ=9, Fig. 7(b) indicates that the two rows of interstitial vortices flow in one-dimensional channels between the pinning rows while two interstitial vortices remain trapped behind every pinning site so that 3/4 of the interstitial vortices are moving. This is similar to the x-direction depinning that occurs for B/Bϕ = 4, where a single row of interstitial vortices flows between each pair of pinning rows and a single interstitial vortex is trapped behind each pinning site. Just above the depinning transition for y-direction driving at B/Bϕ=9, shown in Fig. 7(c), all of the interstitial vortices are depinned and a combination of ordered and disordered vortex flow occurs. The velocity-force curves for driving in the x and y directions show a similar crossing at B/Bϕ=9 as that illustrated in Fig. 3(c) for B/Bϕ=4.
For B/Bϕ = 12, the vortex configurations and depinning dynamics are similar to those seen for B/Bϕ = 3. In Fig. 7(d) the FD=0 vortex configuration at B/Bϕ = 12 consists of a triangular lattice that is aligned with the y-direction. Since there is now an interstitial column of vortices that could depin and flow between adjacent columns of pinning sites, while there are no straight rows of interstitial vortices, it might be expected that Fcy < Fcx for this field. Instead, Fig. 4 shows that Fcy/Fcx ≈ 1.13, so the depinning is still easier in the x-direction than in the y-direction; however, the depinning anisotropy is much smaller than that which appears at B/Bϕ=3. Vortex motion just above depinning at B/Bϕ=12 for driving in the x-direction occurs in the form of three ordered winding rows passing between each pair of pinning rows, as shown in Fig. 7(e). This is similar to the motion at B/Bϕ = 3 shown in Fig. 5(e) where one winding row of interstitial vortices moves between the pinning rows. For depinning in the y-direction at B/Bϕ=12, Fig. 7(f) shows that the vortex trajectories are disordered in a manner similar to that found for y-direction depinning at B/Bϕ = 3, as seen in Fig. 5(f).
Fig8.png
Figure 8: Vortex positions (black dots), pining site locations (open circles), and vortex trajectories (black lines) for the triangular pinning lattice system in Fig. 2 at B/Bϕ=7. (a) At FD = 0, a triangular vortex lattice forms that is not aligned with the x or y axes but is tilted at an angle θ ≈ −78° to the x-axis. This ground state is two-fold degenerate since the vortex lattice could have been tilted at the opposite angle, θ ≈ +78°, to the x-axis. (b) The vortex trajectories just above depinning for driving in the x-direction. All of the interstitial vortices are moving. (c) The vortex trajectories just above depinning for driving in the y-direction. In this case a portion of the interstitial vortices remains pinned.
At B/Bϕ = 7, a peak in Fc occurs as shown in Fig. 2, but there is almost no anisotropy in the depinning thresholds, as seen in Fig. 4. Figure 8(a) illustrates that at this field for Fd = 0, a triangular vortex lattice forms which is not aligned with either the x or y directions, unlike the configurations found at B/Bϕ = 3, 4, 9, and 12, but is at an angle θ ≈ −78° to the x-axis. The vortices flow in ordered patterns just above depinning in both the x and y directions, as shown in Fig. 8(b,c). Since a portion of the interstitial vortices remain pinned just above depinning for driving in the y-direction, whereas all of the interstitial vortices are flowing for driving in the x-direction, dVy/dFD < dVx/dFD at B/Bϕ=7. The absence of the anisotropy at this field is likely due to the fact that the main symmetry axis of the triangular vortex lattice is not aligned with either the x or y directions, as is the case at the other matching fields which show anisotropy.
Fig9.png
Figure 9: Vortex positions (black dots), pinning site locations (open circles), and vortex trajectories (black lines) for the triangular pinning lattice system in Fig. 2 at B/Bϕ=7. A weak external driving force is applied at an angle in the positive x-y plane that induces a structural transformation in the vortex lattice between the two ground states, −78° shown in panel (a) and +78° shown in panel (d). During the transformation, illustrated in panels (b) and (c), the interstitial vortices shift in the positive y-direction by approximately one lattice constant and a domain wall traverses the system.
An interesting feature that we observe at B/Bϕ=7 which does not occur at the other matching fields we have investigated is a switching dynamics that can be induced within the pinned phase. This is illustrated in Fig. 9 where in the initial state, shown in Fig. 9(a), the vortex lattice is tilted at θ ≈ −78° to the x-axis. The ground state is twofold degenerate since it could also have been aligned at θ ≈ +78° to the x-axis. When a small driving force is applied to the ground state shown in Fig. 9(a) along +45° to the x-axis, a structural rearrangement of the vortices occurs accompanied by a domain wall that passes through the system from right to left, as shown in Fig. 9(b,c). The vortices move by approximately one lattice constant in the y-direction as the domain wall sweeps past, and in the final state the vortex lattice is tilted at θ ≈ +78° to the x-axis. The system can be switched back to −78° if an external drive is applied along −45° to the x-axis. We expect that for higher matching fields beyond the fields that we consider here, a switching effect will be present for matching fields containing two or more degenerate ground states where the vortex lattice could be arranged in several possible ways. The application of an external drive will lower the energy of one of the orientations.
Fig10.png
Figure 10: (a) Depinning threshold in the x-direction, Fxc (open squares), and y-direction, Fyc (filled circles), vs Fp for the triangular pinning lattice system in Fig. 2 at B/Bϕ = 2. (b) The corresponding anisotropy ratio Fyc/Fxc vs Fp. H: the honeycomb ordering illustrated in Fig. 11(a); PP: the partially pinned phase shown in Fig. 11(b) where a portion of the pinning sites are unoccupied and the depinning is plastic; DT: the distorted triangular phase seen in Fig. 11(c) where most pinning sites are unoccupied and the depinning is elastic. The three different phases are visible as features in the anisotropy. (c) The depinning thresholds Fxc and Fyc vs Fp for the same system at B/Bϕ = 3. (d) The corresponding anisotropy ratio Fyc/Fxc vs Fp.
Fig11.png
Figure 11: The vortex configurations for the triangular pinning lattice system at B/Bϕ=2 from Fig. 10(a,b) at FD = 0. (a) The pinned honeycomb lattice (H) at Fp = 1.0. (b) The partially pinned lattice (PP) at Fp = 0.5. A portion of the pinning sites are unoccupied and the vortices depin plastically. (c) The weak pinning regime at Fp=0.075 where a distorted triangular (DT) lattice forms and the depinning is elastic.

A.  Effect of Pinning Strength

We next study the effect of varying the pinning strength Fp on the anisotropy at the different fields. In Fig. 10(a) we plot Fyc and Fxc versus Fp for a sample with a triangular pinning lattice at B/Bϕ = 2, and in Fig. 10(b) we show the corresponding anisotropy ratio Fyc/Fxc. Since the pinning induces the honeycomb vortex lattice structure shown in Fig. 11(a) at this field, as Fp decreases the vortices shift into configuration that is closer to a triangular lattice. To accommodate this shift, some of the pinning sites are vacated with decreasing Fp. For Fp ≥ 0.85, the honeycomb lattice (H) structure is stabilized, all of the pinning sites are occupied, the anisotropy is fixed near Fyc/Fxc=2.5, and the depinning thresholds Fxc and Fyc do not change significantly with Fp. For 0.175 < Fp < 0.85, the pinning is not strong enough to stabilize the honeycomb lattice and a partially pinned (PP) lattice forms in which only some of the pinning sites are occupied, as illustrated in Fig. 11(b) for Fp=0.5. The depinning in this regime is still plastic with the interstitial vortices depinning first. There is a strong enhancement of the anisotropy in the PP phase, with Fyc/Fxc reaching values as large as 5. For Fp ≤ 0.175, the vortices form a distorted triangular (DT) lattice illustrated in Fig. 11(c) which becomes increasingly triangular with decreasing Fp. In the DT phase, only a small fraction of the pinning sites are occupied. Here the depinning transition is elastic and both the interstitial and pinned vortices depin simultaneously. The anisotropy of the depinning is lost and the critical depinning forces are isotropic in the DT phase. In general, Fyc and Fcx decrease with decreasing Fp; however, near the transition between the PP and DT phases, Fxc increases with decreasing Fp as the depinning changes from plastic to elastic. We believe that this effect is similar to the peak in the critical depinning force observed for periodic [38] and random arrays [39] above the first matching field when the vortex-vortex interaction strength is varied. For periodic pinning, Ref. [38] illustrated that the depinning force decreases with increasing vortex-vortex interaction strength since the system depins elastically and all of the vortices begin to move at the same time. For weak vortex-vortex interactions, the interstitial vortices depin easily and flow plastically past the vortices at the pinning sites, so the depinning force decreases with decreasing vortex-vortex interaction strength in this regime. Between these two extremes, a peak in the depinning force occurs. A similar effect is observed in vortex systems with very dilute random pinning arrays [39]. In Fig. 10(a) the vortex-vortex interaction strength is fixed; however, there is still a transition from elastic to plastic depinning. The peak appears only for x-direction driving, and this may be due to the existence of an easy shear mode in the x-direction which is absent for y-direction driving.
For B/Bϕ = 3, Fig. 10(c) shows that Fyc and Fxc saturate at large Fp, while Fig. 10(d) indicates that the anisotropy ratio also saturates at Fyc/Fxc = 1.24. For Fp < 0.25, the depinning threshold decreases rapidly with decreasing Fp as the system enters the elastic depinning regime. We note that since the vortex lattice at B/Bϕ=3 is triangular, there is no elastic energy cost for occupying the pinning sites and one-third of the vortices will always be located at the pinning sites for arbitrarily small Fp, unlike the situation at B/Bϕ=2. There is a very small peak in Fxc near the plastic-elastic depinning transition.
Fig12.png
Figure 12: (a) The depinning threshold in the x-direction, Fxc (open squares), and y-direction, Fyc (filled circles) vs Fp for the triangular pinning lattice system in Fig. 2 at B/Bϕ=4. (b) The corresponding anisotropy ratio Fcy/Fcx vs Fp. (c) Fcx and Fcy vs Fp for the same system at B/Bϕ=5. (d) The corresponding anisotropy ratio Fcy/Fcx vs Fp. Here the depinning is isotropic and a peak in the depinning thresholds occurs near the transition from the plastic to the elastic depinning regime.
Figure 12(a,b) shows the depinning thresholds Fcx and Fcy as a function of Fp for B/Bϕ = 4 along with the anisotropy ratio Fyc/Fxc. Both Fcx and Fcy saturate with increasing Fp, and the anisotropy for Fp > 0.25 is fixed at Fcy/Fcx=1.5. For Fp < 0.25, the depinning threshold decreases rapidly with decreasing Fp, and at the same time there is a drop in the anisotropy as the system passes from the plastic to the elastic depinning regime. In Fig. 12(c,d) we illustrate Fcx, Fcy, and Fyc/Fxc for B/Bϕ = 5, where the vortex lattice lattice is disordered. Here the depinning is isotropic for all values of Fp. A peak in the depinning thresholds occurs for both directions of driving near Fp = 0.25 at the transition between elastic and plastic depinning. For strong Fp the vortices at the pinning sites are distorted only slightly from the center of each pinning site, so the depinning of the interstitial vortices occurs with a fixed potential landscape created by the interaction with the pinned vortices. As Fp is reduced, the vortices within the pinning sites can distort further from the center of the pinning site when a driving force is applied, and the magnitude of these distortions can become nearly as large as the pinning radius near the plastic to elastic depinning transition. In this case, the potential landscape created by the pinned vortices may shift by a small amount and produce a high potential barrier which the interstitial vortices must overcome before depinning.
We observe the same general trends for B/Bϕ > 5, including a saturation of the anisotropy with increasing Fp and a crossover from plastic to elastic depinning at low Fp. For higher values of Fp and Rp, multiple vortices are trapped at each pinning site. In this case, the vortices form vortex molecular crystals within the pinning sites [40], which changes both the depinning threshold and the anisotropy. In general, the anisotropy is reduced when multiple vortex pinning is present. This means that the anisotropy is only observable in a regime where the pinning is strong enough to allow for plastic depinning or channeling of vortices between the pinning sites, but not strong enough to permit multiple vortices to occupy each pinning site.
Fig13.png
Figure 13: (a) The depinning threshold in the x-direction, Fxc (open squares), and y-direction, Fyc (filled circles) vs Bϕ for a triangular pinning lattice system with Fp = 0.85 and Rp = 0.35λ at B/Bϕ=2. The vortex lattice has honeycomb ordering at low Bϕ, but as Bϕ increases, the increasing strength of the vortex-vortex interactions causes some of the vortices to shift out of the pinning sites. (b) The corresponding anisotropy ratio Fyc/Fxc vs Bϕ. (c) Fxc (open squares) and Fyc (filled circles) vs Bϕ for the same system at B/Bϕ=3. Here the vortex lattice is triangular, as seen in Fig. 5(d), so as Bϕ increases the vortex-vortex interactions become stronger and increase the value of the interstitial vortex depinning threshold. (d) The corresponding anisotropy ratio Fyc/Fxc vs Bϕ.
Fig14.png
Figure 14: (a) The depinning thresholds Fxc (open squares) and Fyc (filled circles) vs Bϕ for a triangular pinning lattice system with Fp=0.85 and Rp=0.35λ at B/Bϕ=4. (b) The corresponding Fyc/Fxc vs Bϕ. (c) Fxc (open squares) and Fyc (filled circles) vs Bϕ for the same system at B/Bϕ=5. (d) The corresponding Fyc/Fxc vs Bϕ showing that the depinning is isotropic.

B.  Weak Pinning Limit

In the weak pinning limit, Figs. 10 and 12 show that the anisotropy ratio Fcy/Fcx generally decreases with decreasing pinning strength when the system makes a transition from plastic depinning of the interstitial vortices to elastic depinning of the entire lattice. Additionally, for sufficiently weak pinning an additional structural transition in the vortex lattice can occur, such as the triangular vortex lattice that forms for B/Bϕ = 2.0 when the pinning is too weak to impose the honeycomb structure shown in Fig. 5(a). Similar pinning-induced structural transitions to a triangular lattice at very weak pinning have been observed in systems with square or rectangular pinning arrays [23,41,42,43] and for metallic balls on periodic pinning arrays [37]. In a rectangular pinning lattice where the anisotropy is intrinsic to the lattice itself, we would expect the anisotropy ratio to be reduced substantially with decreasing pinning strength when a transition occurs to a configuration in which only a portion of the vortices are pinned.

C.  Effect of Changing Bϕ

We next examine the depinning thresholds and anisotropy at different matching fields for the triangular pinning lattice with fixed Fp = 0.85 but with increasing Bϕ, achieved by increasing the density of pinning sites np. The vortex-vortex interactions become more important for higher values of Bϕ. For B/Bϕ = 2, illustrated in Fig. 13(a,b), both Fxc and Fyc show a peak feature, while the anisotropy remains near Fyc/Fxc=2.0. The depinning thresholds increase with increasing Bϕ for low Bϕ due to the fact that the increasing strength of the vortex-vortex interactions raises the interstitial pinning barriers. The threshold does not continue to monotonically increase with increasing Bϕ since the vortex configuration at B/Bϕ=2 is a honeycomb lattice. As a result, the elastic energy cost of maintaining the honeycomb structure increases with increasing Bϕ, and for Bϕ > 0.2ϕ02, a portion of the vortices shift out of the pinning sites to form a distorted triangular lattice similar to that seen for low Fp in Fig. 11(c). This causes a drop in the depinning thresholds with increasing Bϕ. We expect similar behavior for other matching fields at which an ordered but non-triangular vortex lattice forms.
In Fig. 13(c) we plot Fxc and Fyc versus Bϕ for the same system with B/Bϕ = 3, and in Fig. 13(d) we show the corresponding Fyc/Fxc. At this matching field, the vortex lattice is triangular as seen in Fig. 5(d). Therefore, the vortex positions do not shift as Bϕ increases, unlike the case for B/Bϕ=2, and the depinning thresholds increase monotonically with increasing Bϕ. The anisotropy does not vary strongly with Bϕ. In Fig. 14(a,b) we show Fxc, Fyc, and Fyc/Fxc versus Bϕ for the same system at B/Bϕ = 4, where the vortex lattice is triangular as indicated in Fig. 6(a). The depinning thresholds increase monotonically with increasing Bϕ while the anisotropy remains constant at Fyc/Fxc ≈ 1.54. At B/Bϕ = 5, where Fig. 6(d) shows that the vortex lattice is disordered, the depinning thresholds are isotropic and increase monotonically with increasing Bϕ, as illustrated in Fig. 14(c,d). For any matching field B/Bϕ, if Bϕ is increased above the range of values considered here, multiple vortex pinning by the pinning sites eventually occurs when the vortex lattice constant a becomes of the order of the pinning radius Rp and very little distortion of the vortex lattice is required to shift the vortices into the pinning sites. The occurrence of multiple vortex pinning would alter both the depinning thresholds and the anisotropy.
Fig15.png
Figure 15: The depinning thresholds Fxc (open squares) and Fyc (filled circles) vs Bϕ for the system in Fig. 2 with Fp=0.85. Lower curves: B/Bϕ = 0.5, showing that the depinning is isotropic and monotonically decreasing with increasing Fp. Upper curves: B/Bϕ = 1.0, where Fc = Fp.

D.  Anisotropy for B/Bϕ ≤ 1

For B/Bϕ > 1, interstitial vortices are present and the depinning threshold is determined by the strength of the vortex-vortex interactions, provided that the pinning is strong enough to produce a plastic depinning transition. For B/Bϕ ≤ 1, the depinning threshold is controlled by a combination of the vortex-vortex interaction strength and the strength of the pinning sites. For a triangular pinning array at the matching and submatching fields of B/Bϕ = 1, 1/3, and 1/4, the vortex lattice is triangular and every vortex is trapped by a pinning site. In this case, the depinning thresholds are determined by the maximum force exerted by the pinning sites and are independent of the direction of the external drive, so the depinning is isotropic. This is in agreement with previous work, where an isotropic depinning threshold was observed for vortices in triangular pinning arrays at B/Bϕ=1 [30,31]. In Fig. 15 we plot Fxc and Fyc versus Bϕ at B/Bϕ = 0.5 and 1.0 for a system with Fp = 0.85. The depinning thresholds are isotropic for both fields, and at B/Bϕ=1, Fc = Fp as expected. At B/Bϕ = 0.5, the vortex lattice is disordered since a triangular vortex lattice cannot match the pinning array at this filling, as shown in Fig. 11(c) of Ref. [44]. Although all of the vortices are pinned, due to the disorder of the vortex structure, some vortices experience stronger vortex-vortex repulsion from neighboring vortices than other vortices, and as a result the vortex-vortex interactions do not cancel at B/Bϕ=0.5 as they do at B/Bϕ=1. This lowers the depinning thresholds and causes both Fxc and Fyc to decrease with increasing Bϕ due to the dependence of the depinning force on the vortex-vortex interaction strength. In general, we observe little or no anisotropy in the depinning thresholds for B/Bϕ < 1. If multiple vortex pinning occurs at B/Bϕ > 1, so that no interstitial vortices are present, we expect that the same type of depinning phenomena seen for B/Bϕ ≤ 1 will appear and there will be little anisotropy. This suggests that the appearance of anisotropic depinning forces and the existence of voltage-current curves with different values of dV/dFd in different directions are indicators of the presence of interstitial vortices in the system.
Fig16.png
Figure 16: (a) The depinning thresholds Fxc (open squares) and Fyc (filled circles) vs T/Tm for a triangular pinning lattice system with Fp=1.25 and B/Bϕ = 2. Here Tm is the temperature associated with the onset of vortex diffusion at FD = 0. (b) The corresponding anisotropy ratio Fyc/Fxc vs T/Tm. (c) Fxc (open squares) and Fyc (filled circles) vs T/Tm for the same system at B/Bϕ = 4. (d) The corresponding Fyc/Fxc vs T/Tm.

C.  Temperature Effects

We next consider how robust the anisotropy is to thermal fluctuations. We anneal the system down to a finite temperature and then measure the depinning forces in the x and y-directions. The temperature is given in terms of the melting temperature Tm at which the vortices begin to diffuse significantly and the system is in a molten state. In Fig. 16(a) we plot Fxc and Fyc versus T/Tm for a triangular pinning lattice system with Fp=1.25 at B/Bϕ = 2, and in Fig. 16(b) we show the corresponding anisotropy Fyc/Fxc. Both depinning thresholds monotonically decrease with increasing temperature and reach zero at T/Tm = 1.0. The anisotropy decreases with increasing temperature for low temperatures; however, just below the melting temperature, Fyc/Fxc passes through a peak. A similar trend is seen for B/Bϕ = 4, as shown in Fig. 16(c,d). These results indicate that the anisotropy should be robust against temperature. This agrees with the experiments in Ref. [31], which found that the anisotropy became more pronounced at higher temperatures. The enhancement of the anisotropy at higher temperatures could also result from the presence of weak random intrinsic pinning in the sample, which would reduce the magnitude of the anisotropy but which can be washed out by thermal fluctuations. Near the melting transition, any topological defects that are thermally induced in the vortex lattice couple to the external drive. For driving along the x-direction, those defects whose glide direction is along the x-axis are favored and produce weakly pinned regions. Due to the symmetry of the lattice, for y-direction driving the defects are unable to align with their glide direction along the y axis, and have a much smaller effect on the local pinning strength. As a result, Fcx is further depressed close to melting by the presence of the defects, while Fcy does not drop as dramatically, and this produces the peak in Fcy/Fcx near melting seen in Fig. 16.
Fig17.png
Figure 17: Vortex positions (black dots), pinning site locations (open circles), and vortex trajectories (black lines) just above depinning for a system with a square pinning array at Fp = 0.86, Rp = 0.35λ, and Bϕ = 0.0625ϕ02 at B/Bϕ=2. (a) y-direction driving. (b) x-direction driving. The same type of vortex motion occurs for both directions of drive.
Fig18.png
Figure 18: Velocity-force curves 〈Vx〉 vs FD for x-direction depinning (open squares) and 〈Vy〉 vs FD for y-direction depinning (filled circles) in the square pinning lattice system from Fig. 17. (a) B/Bϕ = 2, where the depinning is isotropic. (b) B/Bϕ = 4, with anisotropic depinning. (c) B/Bϕ = 12, with anisotropic depinning.
Fig19.png
Figure 19: The vortex positions (black dots), pinning site locations (open circles), and vortex trajectories (black lines) for the square pinning lattice system in Fig. 18 at B/Bϕ = 4. (a) The FD = 0 state where a triangular vortex lattice forms that is aligned in the y-direction. (b) The vortex trajectories just above depinning for driving in the y-direction, showing one-dimensional channels of vortices moving between adjacent columns of pinning sites. (c) The vortex trajectories just above depinning for driving in the x-direction. Here, every other column of vortices shifts in the y-direction so that every other vortex can join one-dimensional rows of vortices flowing between adjacent pinning site rows, while the remaining interstitial vortices are trapped between neighboring pinning sites. (d) The same as panel (c), but at a later time when the system has reached steady-state flow.

IV.  ANISOTROPY IN SQUARE PINNING ARRAYS

For square pinning arrays, we find that the depinning thresholds at most fields are isotropic. This is a result of the fact that the same type of vortex motion occurs in both directions for most fields, as illustrated for B/Bϕ=2 in Fig. 17. In Fig. 18(a) we show the isotropic velocity-force curves at B/Bϕ = 2 for x and y-direction driving. Since the perpendicular directions of the square pinning array are identical, unlike the perpendicular directions of the triangular pinning array, it is not surprising that most matching fields have the same depinning thresholds in both driving directions for the square array. Nevertheless, strongly anisotropic depinning occurs at B/Bϕ = 4 and 12, as shown in Fig. 18(b,c).
In Fig. 19(a) we plot the vortex positions and pinning site locations for B/Bϕ = 4, where anisotropic depinning occurs. Here a triangular vortex lattice that is aligned with the y-axis forms. Under y-direction driving, the interstitial vortices flow in one-dimensional channels between adjacent columns of pinning sites, as seen in Fig. 19(b) where 2/3 of the interstitial vortices have depinned. A simple channeling motion cannot occur for x direction driving, so Fxc is much higher than Fyc. Just above the depinning transition for x-direction driving, as illustrated in Fig. 19(c), every other column of vortices shifts in the y direction in order to permit every other vortex to join a one-dimensional flowing channel passing between adjacent rows of pinning sites. The remaining interstitial vortices remain trapped between the pinning sites. After this rearrangement, 2/3 of the interstitial vortices flow in the steady-state one-dimensional channels shown in Fig. 19(d), which are similar to the channels that form for y-direction driving. The ground state shown in Fig. 19(a) is degenerate, and a state with the vortex lattice aligned along the x-direction has equal energy. Thus, the realignment process seen in Fig. 19(c) is simply a shift of the vortices into the other ground state prior to the onset of flow. Figure 18(b) shows that Fxc is approximately 1.75 times higher than Fyc. Due to the symmetry of the square lattice, either the x or the y-direction can show a higher depinning threshold depending on the initial configuration of the vortex lattice. This is distinct from the triangular pinning lattice, where the higher depinning force always occurs in the same direction at a given field. If the annealing process for the square pinning lattice is repeated with different initial conditions, the vortex lattice has a 50% chance of aligning with the x-direction, in which case the anisotropy will be reversed from that shown in Figs. 18, 19. If the driving force is cycled, the velocity-force curve in the hard driving direction is hysteretic during the first cycle due to the realignment effect, while there is no hysteresis for the easy driving direction or for subsequent cycles in the initially hard driving direction.
Fig20.png
Figure 20: (a) Fxc (open squares) and Fyc (filled circles) vs Fp for the system in Fig. 18 at B/Bϕ = 4 with the starting configuration shown in Fig. 19 that produces a higher depinning threshold in the x-direction. (b) The corresponding anisotropy ratio Fyc/Fxc vs Fp. For small Fp the system depins elastically. (c) Fxc (open squares) and Fyc (filled circles) vs Bϕ for the same system at B/Bϕ=4 and Fp=0.85. (d) The corresponding Fyc/Fxc vs Fp.
In Fig. 20 we illustrate the effect of changing Fp and Bϕ on the depinning anisotropy for the square pinning lattice sample with B/Bϕ=4. We show a case where the initial vortex lattice orientation is along the y-axis, as in Fig. 19(a), which gives Fxc > Fyc. Figure 20(b) indicates that the anisotropy saturates at Fyc/Fxc ≈ 0.57 for Fp > 0.075, while Fig. 20(a) shows that the depinning thresholds also saturate above this value of Fp. For Fp < 0.075, the depinning is elastic and the anisotropy is lost. For fixed Fp=0.85 the depinning thresholds increase monotonically with increasing Bϕ, as seen in Fig. 20(c), while in Fig. 20(d) the anisotropy passes through a shallow extremum of Fyc/Fxc=0.5.
Fig21.png
Figure 21: The vortex positions (black dots), pinning site locations (open circles), and vortex trajectories (black lines) for the system in Fig. 18 at B/Bϕ = 12. (a) The partially ordered vortex configuration at FD = 0. The vortex structure has a smectic-type ordering in which all of the topological defects are aligned in the same direction. (b) The vortex trajectories just above depinning for driving in the y-direction showing two columns of interstitial vortices moving between each pair of pinning columns and two interstitial vortices trapped between adjacent pinning sites. (c) The vortex trajectories just above depinning for driving in the x-direction. A portion of the interstitial vortices shift in the y-direction in order to create ordered rows of flowing vortices and pairs of trapped interstitial vortices between adjacent pinning sites. (d) The steady-state channels that form for y-direction driving. The general structural rearrangement of the interstitial vortices for depinning in the x-direction is similar to that seen at B/Bϕ = 4 in Fig. 19(c,d).
We find a similar anisotropic depinning behavior for B/Bϕ=12. The vortex configurations for this field at FD = 0 are illustrated in Fig. 21(a). The vortex lattice is aligned in the y direction, but just as at B/Bϕ=4, there are two degenerate ground states, and a vortex lattice that is aligned in the x-direction would have the same energy. There are two columns of interstitial vortices between adjacent columns of pinning sites. The overall vortex lattice structure is not triangular and there are dislocations present in the lattice. Along certain columns, neighboring interstitial vortices in neighboring columns lie along a line tilted by −23° with respect to the x-axis, while along other columns, neighboring interstitial vortices lie along a line tilted by +23° with respect to the x-axis. The dislocations in the vortex lattice are all aligned in the same direction, resulting in a smectic structure. This smectic state for the square pinning array has not been observed in previous work. There are two possible low-energy orientations for the vortex lattice, just as in the B/Bϕ=4 case: the y-axis orientation shown in Fig. 21(a), or the same state rotated by 90° and aligned with the x-axis. For depinning in the y-direction, Fig. 21(b) shows that the two columns of interstitial vortices depin into flowing one-dimensional channels, while two interstitial vortices remain trapped between adjacent pairs of pinning sites. For driving along the x-direction, the same type of lattice reorientation found for B/Bϕ=4 occurs at B/Bϕ=12, as illustrated in Fig. 21(c,d). The columns of interstitial vortices shift in such a way that two one-dimensional rows of interstitial vortices form, while two interstitial vortices remain trapped between adjacent pairs of pinning sites. The final vortex configuration for x-direction driving, in Fig. 21(d), is a rotated version of the configuration for y-direction driving seen in Fig. 21(b). The same hysteretic voltage-current response should occur for driving in the hard direction at B/Bϕ=12 as at B/Bϕ=4. In Fig. 18(c) the velocity-force curves at B/Bϕ=12 show an anisotropy Fyc/Fxc ≈ 0.4. The more pronounced anisotropy at B/Bϕ=12 compared to B/Bϕ=4 is due to the fact that the overall structure at B/Bϕ=12 is smectic and the dislocations are aligned in the y-direction, further decreasing the depinning force along this direction.
We expect that the depinning anisotropy in the square pinning arrays will be more difficult to observe experimentally than the anisotropy in the triangular pinning arrays due to the existence of twofold-degenerate ground states for the square system. If other forms of quenched disorder, such as intrinsic pinning, are present and the system is large, domains of the two different orientations could form which would render the depinning thresholds isotropic. On the other hand, we found that an applied drive can readily align the vortex lattice structures in the driving direction at B/Bϕ = 4 and 12. Therefore, it may be possible to prepare the system in an aligned state using an external drive, and then measure the anisotropy of the depinning forces starting from this aligned state. This procedure should permit the anisotropy in the square pinning lattice system to be observed experimentally.
Fig22.png
Figure 22: (a) Fxc (open squares) and Fyc (filled circles) for a honeycomb pinning lattice as a function of B/BHϕ, the honeycomb matching field, in a sample with Fp=0.85, Rp=0.35λ, and np=0.194/λ2. (b) The corresponding Fyc/Fxc vs B/BHϕ shows that the anisotropy exhibits several reversals as a function of field. (c) Fxc (open squares) and Fyc (filled circles) for a kagomé pinning lattice as a function of B/BKϕ, the kagomé matching field. (d) The corresponding Fyc/Fxc vs B/BKϕ shows that several reversals of the anisotropy also occur for the kagomé pinning array.
Fig23.png
Figure 23: Vortex positions (black dots), pinning site locations (open circles), and vortex trajectories (black lines) for the honeycomb pinning array in Fig. 22. (a) At B/BHϕ = 1.5 and FD=0 there is one vortex per large interstitial site. (b) Vortex trajectories just above depinning for driving in the y-direction at B/BHϕ=1.5 showing one-dimensional paths between the pinning sites. At this field, Fyc/Fxc < 1. (c) Vortex trajectories just above depinning for driving in the x-direction at B/BHϕ=1.5. The interstitial vortices flow in winding paths around the occupied pinning sites. (d) The vortex configurations at B/BHϕ = 4 for FD = 0. Here a portion of the interstitial vortices align in the x-direction. (e) Vortex trajectories just above depinning for driving in the x-direction at B/BHϕ=4. In addition to moving channels of interstitial vortices, there are some interstitial vortices that remain pinned between adjacent occupied pinning sites. (f) Vortex trajectories just above depinning for driving in the y-direction at B/BHϕ=4 show a complex periodic pattern with all of the interstitial vortices moving.

V.  ANISOTROPY IN HONEYCOMB AND KAGOME PINNING ARRAYS

We next examine anisotropy in honeycomb and kagomé pinning arrays. Since the honeycomb and kagomé arrays can be constructed by removing selected pinning sites from a triangular array, it might be expected that the anisotropy would follow the same trend found for the triangular pinning arrays. In particular, one could expect that the depinning threshold would always be higher in the y-direction. Instead, we find that the honeycomb and kagomé pinning arrangements show an anisotropy that undergoes reversals as a function of the applied magnetic field. In Fig. 22(a) we plot Fxc and Fyc as a function of B/BHϕ for a honeycomb pinning system with Fp=0.85, Rp=0.35λ, and np=0.194/λ2. Here, BHϕ is the matching field for a honeycomb lattice constructed from a triangular lattice with matching field Bϕ, and we have BHϕ=2/3Bϕ as described in Ref. [26]. Figure 22(b) shows Fyc/Fxc versus BHϕ for the honeycomb pinning array. For 1 < B/BHϕ < 3, Fyc/Fxc < 1 and the depinning threshold is higher for x-direction driving. This anisotropy is reversed from that seen in the triangular pinning arrays. The reversal can be understood by examining the vortex positions at BHϕ = 1.5 in Fig. 23(a). Each interstitial vortex is located at the position where the pinning site was removed from the triangular lattice in order to create the honeycomb lattice. There is a pin-free channel of motion which the interstitial vortices can follow for driving in the y-direction, as seen in Fig. 23(c). For x-direction driving, the path of the interstitial vortex is blocked by pinned vortices, creating a much stronger barrier for depinning, and once the vortices begin to move, they follow the winding paths illustrated in Fig. 23(b).
Fig24.png
Figure 24: The velocity-force curves from the system in Fig. 22. Open squares: 〈Vx〉 vs FD; filled circles: 〈Vy〉 vs FD. (a) The honeycomb pinning array at B/BHϕ = 1.5 where Fyc/Fxc < 1. (b) The honeycomb pinning array at B/BHϕ = 4 showing that the anisotropy has reversed and Fyc/Fxc > 1. (c) The kagomé pinning array at B/BKϕ = 4/3. (d) The kagomé pinning array at B/BKϕ = 10/3. Here dVy/dFD < dVx/dFD, so there is a crossing of the velocity-force curves.
In Fig. 24 we plot 〈Vx〉 and 〈Vy〉 versus FD for driving in the x and y-directions, respectively. The depinning in the honeycomb pinning array is anisotropic at both B/BHϕ = 1.5, shown in Fig. 24(a), and at B/BHϕ = 4, shown in Fig. 24(b). For 2.5 ≤ B/BHϕ ≤ 4 the anisotropy is reversed compared to the lower fields. This is due to the formation of n-mer states in the large interstitial spaces of the honeycomb lattice which permit a portion of the interstitial vortices to be aligned in the x-direction between the pinning rows. In Fig. 23(d) we illustrate the FD = 0 vortex configuration at B/BHϕ = 4, where the interstitial vortices form triangular shapes within the large interstitial sites. The vortex at the top of each interstitial triangle forms a nearly one-dimensional channel in the x-direction with the vortices at the base of the adjacent interstitial triangles, permitting easy depinning in the x-direction into the flow pattern shown in Fig. 23(e). For depinning in the y-direction, where the threshold is higher, the complex but ordered flow pattern in Fig. 23(f) appears. For BHϕ = 4.5, the anisotropy reverses again, as seen in Fig. 22.
Figure 22(c,d) shows that similar anisotropy reversals occur for depinning in kagomé pinning arrays, where BKϕ is the kagomé matching field for a pinning lattice constructed from a triangular lattice with matching field Bϕ and BKϕ=3/4Bϕ, as described in Ref. [26]. For B/BKϕ ≤ 5/3, Fig. 22(d) indicates that Fyc/Fxc < 1, but that this pattern reverses several times for increasing B/BKϕ. Just as in the honeycomb pinning array, in the kagomé pinning array the reversals originate from the formation and alignment of interstitial vortex n-mer states in the large interstitial sites. In general, the anisotropy is smaller for the honeycomb and kagomé pinning arrays than for the triangular or square pinning arrays.
Fig25.png
Figure 25: Vortex positions (black dots), pinning site locations (open circles), and vortex trajectories (black lines) for the kagomé pinning array. (a) The FD=0 state at B/BKϕ = 4/3, where there is one vortex per large interstitial site. (b) The vortex trajectories just above depinning for driving in the y-direction at B/BKϕ=4/3 shows the formation of an asymmetric pattern that encircles groups of three pinning sites. (c) The vortex trajectories just above depinning for driving in the x-direction at B/BKϕ=4/3 shows a winding channel of interstitial vortices between the pinning rows. (d) The FD = 0 state at B/BKϕ = 10/3. (f) The vortex trajectories just above depinning for driving in the x-direction at B/BKϕ=10/3 shows that a portion of the interstitial vortices move continuously through the system. (e) The vortex trajectories just above depinning for driving in the y-direction at B/BKϕ=10/3 shows a winding pattern of interstitial vortices. Here the vortex motion occurs in intermittent pulses rather than as a continuous flow.
We illustrate the FD=0 state for B/BKϕ=4/3 in Fig. 25(a), where there is one vortex per large interstitial site. In Fig. 25(b) we show the vortex trajectories just above depinning for driving in the y-direction at B/BKϕ = 4/3. Each interstitial vortex diverts to the right or left around a pinned vortex, forming large asymmetric patterns of vortex flow around trios of occupied pins. The flow is slightly disordered, since in some cases two moving interstitial vortices approach the same pinned vortex simultaneously, causing one of the vortices to move outside of the flow pattern temporarily. For x-direction driving at B/BKϕ=4/3, shown in Fig. 25(c), the interstitial vortices flow around individual pinning sites in the sparse pinning rows, creating an asymmetric sinusoidal channel pattern. Figure 24(c) indicates that at this field, Fyc/Fxc < 1 and depinning is easiest along the y-direction. A similar anisotropy occurs for B/Bkϕ = 10/3, as shown in Fig. 24(d). In Fig. 25(d) we illustrate the FD = 0 state at B/BKϕ=10/3, where the large interstitial sites capture five vortices which form a pentagon structure. For depinning in the x-direction at this field, only a portion of the interstitial vortices move in winding channels between the pinning rows while the large interstitial sites all capture three vortices, as seen in Fig. 25(e). The interstitial vortices which are not part of the channeling flow still undergo a small circular motion as the flowing interstitial vortices move past. At higher drives, all of the interstitial vortices depin and a step appears in the velocity-force curve. For depinning in the y-direction at B/BKϕ=10/3, shown in Fig. 25(f), the trajectories of the moving interstitial vortices are much more tortuous. Although a larger number of interstitial vortices spend at least part of the time flowing for depinning in the y-direction than for depinning in the x-direction, Fig. 24(d) shows that dVy/dFD < dVx/dFD. This is because the vortex motion in Fig. 25(f) is not continuous. Instead, the interstitial vortices hop by one lattice constant and then repin so that a pulse of motion passes though the system. For depinning in the x-direction, shown in Fig. 25(e), the vortices are continuously moving through the system.

VI.  SUMMARY

We have shown that when interstitial vortices are present for fields beyond the first matching field in regular artificial pinning arrays, the transport response is anisotropic. For triangular pinning arrays, we find that the depinning thresholds are always higher in the y-direction, defined to be perpendicular to a symmetry axis of the pinning lattice. This is in general agreement with previous numerical and experimental studies up to the third matching field for triangular pinning arrays. We show that the anisotropy also occurs for higher matching fields and that at certain matching fields the depinning is isotropic. The degree of anisotropy can be controlled by changing the strength of the pinning. For weak pinning, when the depinning transition is elastic and all of the vortices depin simultaneously, the anisotropy is reduced or destroyed. For strong pinning, the depinning is isotropic for matching fields at which the vortex lattice does not order. We find that the velocity-force curves can have different slopes for driving in the different directions depending on the number of interstitial vortices that initially depin. In some cases, although the depinning threshold is lower in one direction, the slope of the velocity-force curve is also lower in that direction, producing a crossing in the velocity-force curves for the two directions of driving. For fields at or below the first matching field, the anisotropy is strongly reduced, implying that the anisotropy should disappear if multiple vortex pinning rather than interstitial vortex pinning occurs above the first matching field. The vortex dynamics can be distinctly different for the two driving directions, with ordered flow states occurring for driving in one direction and disordered flow states appearing for driving in the other direction. The anisotropy is robust against temperature fluctuations and can be enhanced near the vortex lattice melting transition. For square pinning arrays, the two perpendicular driving directions are symmetric; nevertheless, at certain matching fields where triangular or smectic vortex structures form, a strong depinning anisotropy can occur. The easy-flow direction for square lattices is not fixed but depends on which of the two degenerate ground states is formed by the initial vortex lattice. A sufficiently large applied drive realigns the vortex lattice and sets the easy-flow direction in the direction of the drive. If the initial vortex lattice formed with domains of the two degenerate ground states, the domains can be eliminated and a pure ground state formed simply by sweeping the driving force. The anisotropic depinning behavior of this pure state can then be probed with small drives. Honeycomb and kagomé pinning arrays have a smaller anisotropy than that seen for the triangular and square arrays. The anisotropy for the honeycomb and kagomé arrays shows a series of reversals as a function of field due to the formation of vortex molecular crystals, which have orientational degrees of freedom that can lock to different angles.

References

[1]
A.T. Fiory, A.F. Hebard, and S. Somekh, Appl. Phys. Lett. 32, 73 (1978).
[2]
V.V. Metlushko, M. Baert, R. Jonckheere, V.V. Moshchalkov, and Y. Bruynseraede, Solid State Commun. 91, 331 (1994).
[3]
M. Baert, V.V. Metlushko, R. Jonckheere, V.V. Moshchalkov, and Y. Bruynseraede, Phys. Rev. Lett. 74, 3269 (1995); M. Baert, V.V. Metlushko, R. Jonckheere, V.V. Moshchalkov, and Y. Bruynseraede, Europhys. Lett. 29, 157 (1995).
[4]
A. Bezryadin and B. Pannetier, J. Low Temp. Phys. 102, 73 (1996).
[5]
E. Rosseel, M. Van Bael, M. Baert, R. Jonckheere, V.V. Moshchalkov, and Y. Bruynseraede, Phys. Rev. B 53, R2983 (1996); L. Van Look, E. Rosseel, M.J. Van Bael, K. Temst, V.V. Moshchalkov, and Y. Bruynseraede, Phys. Rev. B 60, R6998 (1999).
[6]
K. Harada, O. Kamimura, H. Kasai, T. Matsuda, A. Tonomura, and V.V. Moshchalkov, Science 274, 1167 (1996).
[7]
V. Metlushko, U. Welp, G.W. Crabtree, Z. Zhang, S.R.J. Brueck, B. Watkins, L.E. DeLong, B. Ilic, K. Chung, and P.J. Hesketh, Phys. Rev. B 59, 603 (1999).
[8]
U. Welp, Z.L. Xiao, J.S. Jiang, V.K. Vlasko-Vlasov, S.D. Bader, G.W. Crabtree, J. Liang, H. Chik, and J.M. Xu, Phys. Rev. B 66, 212507 (2002).
[9]
J.I. Martín, M. Vélez, J. Nogués, and I.K. Schuller, Phys. Rev. Lett. 79 , 1929 (1997); A. Hoffmann, L. Fumagalli, N. Jahedi, J.C. Sautner, J.E. Pearson, G. Mihajlovic, and V. Metlushko, Phys. Rev. B 77, 060506(R) (2008).
[10]
D.J. Morgan and J.B. Ketterson, Phys. Rev. Lett. 80, 3614 (1998).
[11]
A.A. Zhukov, P.A.J. de Groot, V.V. Metlushko, and B. Ilic, Appl. Phys. Lett. 83, 4217 (2003).
[12]
A.V. Silhanek, S. Raedts, M.J. Van Bael, and V.V. Moshchalkov, Phys. Rev. B 70, 054515 (2004).
[13]
G. Karapetrov, J. Fedor, M. Iavarone, D. Rosenmann, and W.K. Kwok, Phys. Rev. Lett. 95, 167002 (2005).
[14]
Y. Fasano and M. Menghini, Supercond. Sci. Technol. 31, 023001 (2008).
[15]
S.B. Field, S.S. James, J. Barentine, V.V. Metlushko, G. Crabtree, H. Shtrikman, B. Ilic, and S.R.J. Brueck, Phys. Rev. Lett. 88, 067003 (2002).
[16]
A.N. Grigorenko, G.D. Howells, S.J. Bending, J. Bekaert, M.J. Van Bael, L. Van Look, V.V. Moshchalkov, Y. Bruynseraede, G. Borghs, I.I. Kaya, and R.A. Stradling, Phys. Rev. B 63, 052504 (2001); A.N. Grigorenko, S.J. Bending, M.J. Van Bael, M. Lange, V.V. Moshchalkov, H. Fangohr, and P.A.J. de Groot, Phys. Rev. Lett. 90, 237001 (2003).
[17]
C. Reichhardt and N. Grønbech-Jensen, Phys. Rev. Lett. 85, 2372 (2000).
[18]
C. Reichhardt, G.T. Zimányi, R.T. Scalettar, A. Hoffmann, and I.K. Schuller, Phys. Rev. B 64, 052503 (2001).
[19]
G.R. Berdiyorov, M.V. Milosevic, and F.M. Peeters, Phys. Rev. Lett. 96, 207001 (2006); Phys. Rev. B 74, 174512 (2006).
[20]
C. Reichhardt, C.J. Olson, and F. Nori, Phys. Rev. B 57, 7937 (1998).
[21]
Q.H. Chen, G. Teniers, B.B. Jin and V.V. Moshchalkov, Phys. Rev. B 73, 014506 (2006).
[22]
G.R. Berdiyorov, M.V. Milosevic, and F.M. Peeters, Europhys. Lett. 74, 493 (2006).
[23]
C. Reichhardt, C.J. Olson, R.T. Scalettar, and G.T. Zimányi, Phys. Rev. B 64, 144509 (2001).
[24]
C.J. Olson Reichhardt, A. Libál, and C. Reichhardt, Phys. Rev. B 73, 184519 (2006).
[25]
C. Reichhardt, G.T. Zimányi, and N. Grønbech-Jensen, Phys. Rev. B 64, 014501 (2001).
[26]
C. Reichhardt and C.J. Olson Reichhardt, Phys. Rev. B 76, 064523 (2007).
[27]
M.F. Laguna, C.A. Balseiro, D. Domínguez, and F. Nori, Phys. Rev. B 64, 104505 (2001).
[28]
G.R. Berdiyorov, V.R. Misko, M.V. Milosevic, W. Escoffier, I.V. Grigorieva, and F.M. Peeters, Phys. Rev. B 77, 024526 (2008).
[29]
L. Van Look, E. Rosseel, M.J. Van Bael, K. Temst, V.V. Moshchalkov, and Y. Bruynseraede, Phys. Rev. B 60, R6998 (1999).
[30]
T.C. Wu, P.C. Kang, L. Horng, J.C. Wu, and T.J. Yang, J. Appl. Phys. 95, 6696 (2004).
[31]
R. Cao, T.C. Wu, P.C. Kang, J.C. Wu, T.J. Yang, and L. Horng, Sol. St. Commun. 143, 171 (2007).
[32]
L. Van Look, B.Y. Zhu, R. Jonckheere, B.R. Zhao, Z.X. Zhao, and V.V. Moshchalkov, Phys. Rev. B 66, 214511 (2002).
[33]
M. Velez, D. Jaque, J.I. Martín, M.I. Montero, I.K. Schuller, and J.L. Vicent, Phys. Rev. B 65, 104511 (2002).
[34]
J.E. Villegas, E.M. Gonzalez, M.I. Montero, I.K. Schuller, and J.L. Vicent, Phys. Rev. B 72, 064507 (2005).
[35]
K. Mangold, P. Leiderer, and C. Bechinger, Phys. Rev. Lett. 90, 158302 (2003).
[36]
P. Tierno, T.H. Johansen, and T.M. Fischer, Phys. Rev. Lett. 99, 038303 (2007).
[37]
G. Coupier, M. Saint Jean, and C. Guthmann, Phys. Rev. B 75, 224103 (2007).
[38]
C. Reichhardt, K. Moon, R. Scalettar, and G. Zimányi, Phys. Rev. Lett. 83, 2282 (1999).
[39]
M.-C. Cha and H.A. Fertig, Phys. Rev. Lett. 80, 3851 (1998).
[40]
C. Reichhardt and N. Grønbech-Jensen, Phys. Rev. Lett. 85, 2372 (2000).
[41]
W.V. Pogosov, A.L. Rakhmanov, and V.V. Moshchalkov, Phys. Rev. B 67, 014532 (2003).
[42]
G.R. Berdiyorov, M.V. Milosevic, and F.M. Peeters, Phys. Rev. B 76, 134508 (2007).
[43]
W.V. Pogosov, V.R. Misko, H.J. Zhao, and F.M. Peeters, Phys. Rev. B 79, 014504 (2009).
[44]
C. Reichhardt and N. Grønbech-Jensen, Phys. Rev. B 63, 054510 (2001).


File translated from TEX by TTHgold, version 4.00.

Back to Home