Physical Review B 67, 184523 (2003)

Metastability and Transient Effects in Vortex Matter Near a Decoupling Transition

C. J. Olson and C. Reichhardt

Theoretical Division and Center for Nonlinear Studies, Los Alamos National Laboratory, Los Alamos, New Mexico 87545.

R. T. Scalettar and G. T. Zimányi

Department of Physics, University of California, Davis, California 95616.

Niels Grønbech-Jensen

Department of Applied Science, University of California, Davis, California 95616.
NERSC, Lawrence Berkeley National Laboratory, Berkeley, California 94720.

(Received 3 July 2002; published 30 May 2003)

We examine metastable and transient effects both above and below the first-order decoupling line in a 3D simulation of magnetically interacting pancake vortices. We observe pronounced transient and history effects as well as supercooling and superheating between the 3D coupled, ordered and 2D decoupled, disordered phases. In the disordered supercooled state as a function of DC driving, reordering occurs through the formation of growing moving channels of the ordered phase. No channels form in the superheated region; instead the ordered state is homogeneously destroyed. When a sequence of current pulses is applied we observe memory effects. We find a ramp rate dependence of the V(I) curves on both sides of the decoupling transition. The critical current that we obtain depends on how the system is prepared.
Vortices in superconductors represent an ideal system in which to study the effect of quenched disorder on elastic media. The competition between the flux-line interactions, which order the vortex lattice, and the defects in the sample, which disorder the vortex lattice, produce a remarkable variety of collective behavior [1]. One prominent example is the peak effect in low temperature superconductors, which appears near Hc2 when a transition from an ordered to a strongly pinned disordered state occurs in the vortex lattice [2,3,4,5,6,7,8]. In high temperature superconductors, particularly BSCCO samples, a striking "second peak" phenomenon is observed in which a dramatic increase in the critical current occurs for increasing fields. It has been proposed that this is an order-disorder or 3D to 2D transition. [9,10,11,12,13]
Recently there has been renewed interest in transient effects, which have been observed in voltage response versus time curves in low temperature superconductors [5,6,7,14,15,16,17]. In these experiments the voltage response increases or decays with time, depending on how the vortex lattice was prepared. The existence of transient states suggests that the disordered phase can be supercooled into the ordered region [21], producing an increasing voltage response, whereas the ordered phase may be superheated into the disordered region, giving a decaying response. In addition to transient effects, pronounced memory effects and hysteretic V(I) curves have been observed near the peak effect in low temperature materials [2,4,5,6,7,16,17,18,19,20]. Memory effects are also seen in simulations [22]. Xiao et al. [7] have shown that transient behavior can lead to a strong dependence of the critical current on the current ramp rate. Recent neutron scattering experiments in conjunction with ac shaking have provided more direct evidence of supercooling and superheating near the peak effect [23]. Experiments on BSCCO have revealed that the high field disordered state can be supercooled to fields well below the second peak line [24]. Furthermore, transport experiments in BSCCO have shown metastability in the zero-field-cooled state near the second peak as well as hysteretic V(I) curves [25], and magnetooptic imaging has revealed the coexistence of ordered and disordered phases [26]. Hysteretic and memory effects have also been observed near the second peak in YBCO [27,28,29].
The presence of metastable states and superheating/supercooling effects strongly suggests that the order-disorder transitions in these different materials are first order in nature. The many similarities also point to a universal behavior between the peak effect of low temperature superconductors and the peak effect and second peak effect of high temperature superconductors.
A key question in all these systems is the nature of the microscopic dynamics of the vortices in the transient states; particularly, whether plasticity or the opening of flowing channels are involved [6]. The recent experiments have made it clear that a proper characterization of the static and dynamic phase diagrams must take into account these metastable states, and therefore an understanding of these effects at a microscopic level is crucial. Despite the growing amount of experimental work on metastability and transient effects in vortex matter near the peak effect transition [5,6,7], these effects have not yet been investigated numerically.
In this work we numerically study magnetically interacting pancake vortices driven through quenched point disorder. As a function of applied field, temperature, or interlayer coupling the model exhibits a sharp 3D (coupled, ordered phase) to 2D (decoupled, disordered phase) transition, consistent with theoretical expectations [12,13], that is associated with a large change in the critical current [30]. Near the disordering transition, we find strong metastability and transient effects. A metastable state is a thermodynamic state that is out of equilibrium, which persists for a time longer than the characteristic relaxation time of the system at equilibrium [33]. By supercooling or superheating the ordered and disordered phases, we find increasing or decreasing transient voltage response curves, depending on the amplitude of the drive pulse and the proximity to the disordering transition. In the supercooled transient states a growing ordered channel of flowing vortices forms. No channels form in the superheated region but instead the ordered state is homogeneously destroyed. We observe memory effects when a sequence of pulses is applied, as well as ramp rate dependence and hysteresis in the V(I) curves. The critical current we obtain depends on how the system is prepared.
We consider a 3D layered superconductor containing an equal number of pancake vortices in each layer, interacting magnetically. We neglect the Josephson coupling, which is a reasonable approximation for highly anisotropic materials. The overdamped equation of motion for vortex i at T=0 is
fi = − Nv

j=1 
i Uij,zij)+ fivp + fd = ηvi.
(1)
The total number of pancakes is Nv, and ρij and zij are the distance between vortex i and vortex j in cylindrical coordinates. We impose periodic boundary conditions in the x and y directions and open boundaries in the z direction. The magnetic interaction energy between pancakes is [34,35]
Uij,0)=2dϵ0
(1− d


)ln R

ρ
+ d


E1
 ,
(2)

Uij,z)=−sm d2ϵ0

λ

exp(−z/λ)ln R

ρ
+E2
 ,
(3)
where E1 = ∫ρ dρ exp(−ρ/λ)/ρ, E2 = ∫ρ dρ exp(−√{z2′2}/λ)/ρ, R = 22.6λ, the maximum in-plane distance, ϵ0 = Φ02/(4πλ)2, d=0.005λ is the interlayer spacing as in BSCCO, sm is the coupling strength, and λ is the London penetration depth. The viscosity η = Bc2 Φ0N, where ρN is the normal-state resistivity. Time is measured in units of η/f0*. For example, in the case of a BSCCO sample 2 μm thick, taking λ = 250 nm, ξ = 1.8 nm, and ρN = 2.8 mΩ cm gives the value of a single time step as 0.4 ns. We model the pinning as Np short range attractive parabolic traps that are randomly distributed in each layer. The pinning interaction is fivp = −∑k=1Np(fpp)(rirk(p))Θ( (ξp − |rirk(p) |)/λ), where the pin radius ξp=0.2λ, the pinning force is fp=0.02f0*, and f0*0/λ. We fix the temperature T=0. To vary the applied magnetic field H, we fix the number of vortices in the system and change the system size, thereby changing the vortex density nv. The pin density remains fixed. We use L=16 layers throughout this work, and except where mentioned, we focus on a system that ranges from 12.9λ×12.9λ to 14.8λ×14.8λ, with a pin density of np = 1.0/λ2 in each of the layers. We have also studied a sample with stronger, denser pinning of ξp=0.1λ, fp=0.08f0*, and np=8.0/λ2, of size 5.1λ×5.1λ to 6.9λ×6.9 λ. In each case there are Nv=80 vortices per layer, giving a total of 1280 pancake vortices.
For sufficiently strong disorder, the vortices in this model show a sharp 3D-2D decoupling transition as a function of coupling strength sm, vortex density H [30,36], or temperature [36,37]. A dynamic 2D-3D transition can also occur [30]. There are actually two disordering transitions that occur in the model: a decoupling transition from 3D to 2D, and an in-plane disordering transition. In our studies, we find that these two transitions always coincide, and appear as a single transition from a 3D state that is ordered in the plane and coupled between planes, to a 2D state that is decoupled and disordered in the plane. We denote the magnetic field at which the static 3D-2D transition occurs as nvc, and the coupling strength at which the transition occurs as smc. For the main system considered here, a transition from ordered 3D flux lines to disordered, decoupled 2D pancakes occurs at smc=1.2 with nv=0.3/λ2 or at nvc=0.38 with sm=0.7. The coupling/decoupling transition occurs twice as a function of field [8], once at low fields when the vortex lines form as the effective pinning strength begins to decrease away from the single vortex pinning regime, and a second time at higher fields when the magnetic interactions among vortex pancakes in a given plane cause the pancakes in different planes to decouple. We examine the higher field transition in the sample with strong, dense pinning, where nvc=3.0 at sm=0.7. The same effects described here also appear on either side of a temperature-induced 3D-2D transition.
Fig1.png
Figure 1: Critical current fc (filled squares) and interlayer correlation Cz (open circles) for varying sm in a system with 16 layers, nv=0.3/λ2, and fp=0.02f0*, showing the sharp transition from coupled behavior at sm ≤ 1.2 to decoupled behavior at sm > 1.2.
We illustrate the difference in critical current between the coupled and decoupled vortex phases in Fig. 1. As a function of interlayer coupling sm, we show the critical current fc, obtained by summing Vx=(1/Nv)∑1Nvvx and identifying the drive fd at which Vx > 0.0005. Also plotted is a measure of the z-axis correlation, Cz = 1 − < (|ri,Lri,L+1|/(a0/2))  Θ(a0/2 − |ri,Lri,L+1| > , where a0 is the vortex lattice constant, and the average is taken over all pancakes in the system. The ordered phase has a much lower critical current, fco = 0.0008f0*, than the disordered phase, fcdo = 0.0105f0*.
Fig2.png
Figure 2: Increasing transient voltage response curves Vx versus time for supercooled state, for sm=2.0 and fd/f0* = (bottom) 0.0053, 0.0055, 0.006, 0.0065, 0.007, and 0.0075 (top). Vx=0 for all times for fd/f0* < 0.0053.
Fig3.png
Figure 3: (a) and (c): Transient voltage response curves Vx versus time; (b) and (d): corresponding transient interlayer correlation response Cz, for a superheated and a supercooled sample. Panels (a) and (b) show the increasing response of a supercooled sample with sm=2.0 and (upper light line) fd=0.006f0*, (lower heavy line) fd=0.005f0*. Panels (c) and (d) show the decreasing response of a superheated sample with sm=0.7 and fd=0.010f0*.
To observe transient effects, we supercool the lattice by annealing the system at sm < smc into a disordered, decoupled configuration. Starting from this state, we set sm > smc such that the pancakes would be ordered and coupled at equilibrium, and at t=0 we apply a fixed drive fd for 400000 steps. Application of a driving current is only one possible way in which the equilibrium configuration can be regained. The equilibrium state can also be reached via thermal fluctuations, through gradients in the magnetic field [24], or by applying a rapidly fluctuating magnetic field [31]. In Fig. 2 we show the time-dependent voltage response Vx for several different drives fd for a sample which would be coupled in equilibrium, with sm = 2.0, that has been prepared in a decoupled state at sm=0.5. For fd < 0.0053 ±0.0001 f0* the system remains pinned in a decoupled disordered state. For fd >~0.0053 f0* a time dependent increasing response occurs. Vx does not rise instantly but only after a specific waiting time tw. The rate of increase in Vx grows as the amplitude of the fd increases. As shown in Fig. 3(a,b), the z-axis correlation Cz exhibits the same behavior as Vx, indicating that the vortices are becoming more aligned in the z direction as time passes. If the vortices move in response to thermal activation, a voltage response of the form Vx(t)=V0 (1−eWt) should appear [15]. Since our simulation is at T=0, we would not expect thermal activation to apply. Instead, the response we observe can be fit by an exponential form only at long times, such as t >~30000 in Fig. 3, when Vx is beginning to saturate. At intermediate times (5000 < t < 30000 in Fig. 3(a,b)) the increase in Vx and Cz is roughly linear with time. As we will show below, this linear increase indicates that an ordered regime is growing at a constant rate. The amount of time required for the system to reach a steady voltage response level is indicative of the fact that we have started the system in a metastable state. If we prepare the lattice in its equilibrium configuration of coupled lines and then apply the same currents shown in Fig. 2, the voltage response reaches its full, steady value within less than 100 steps, whereas in Fig. 2, 10000 to 50000 steps are required.
Fig4.png
Figure 4: Pancake vortex positions (circles) and trajectories (lines) for the supercooled phase at sm=2.0 and fd=0.007f0*, seen from the top of the sample, at times: (a) t=2500; (b) t=7500; (c) t=12500; (d) t=20000. Pancakes on a given layer are represented by circles with a fixed radius; the radii increase from the top layer to the bottom. An ordered channel forms in the sample and grows outward. Coexistence of the ordered and disordered phases occurs in panels (a) through (c).
To determine how the vortex lattice is moving when Vx is nearly zero (during tw), linearly increasing, and saturating exponentially, we show the vortex positions and trajectories in the supercooled sample in Fig. 4. Here a series of images have been taken from a sample in Fig. 2 with sm=2.0 for fd=0.007f0* for different times. In Fig. 4(a) at t=2500 the initial state is disordered. In Fig. 4(b) at t=7500 significant vortex motion occurs through the nucleation of a single channel of moving vortices. At lower drives the channel gradually appears during the waiting time tw, but at fd=0.007f0 the channel nucleates relatively rapidly. Vortices outside the channel remain pinned. In Fig. 4(c) at t=12500 the channel is wider, and vortices inside the channel are ordered and have recoupled. The pinned vortices remain in the disordered state. During the transient motion there is a coexistence of ordered and disordered states. If the drive is shut off the ordered domain is pinned but remains ordered, and when the drive is re-applied the ordered domain moves again. The vortices inside the ordered channel tend to align their lattice vector in the direction of the drive [32]. The increase in both Vx and Cz is roughly linear in time during the period when the fully formed channel is expanding outward. Since the velocity of the moving vortices is constant, a linear increase in Vx indicates that the number of moving vortices is also increasing linearly in time. Vortices do not begin to move until the edge of the ordered channel reaches them. Therefore, the linear increase in Vx indicates that the outward growth of the ordered channel is proceeding at a constant rate. In Fig. 4(d) for t=20000 almost all of the vortices have reordered and the channel width is the size of the sample. After this time slow rearrangements of the vortices into a more ordered configuration occur, and Vx switches over to an exponential saturation with time. Thus in the supercooled case we observe nucleation of a microscopic transport channel, followed by expansion of the channel. We note that in recent scanning Hall probe [38] and magneto-optic [39] experiments, coexisting ordered and disordered vortex phases have been imaged, and are associated with history effects and anomalous voltage responses of the vortex lattice.
Fig5.png
Figure 5: Squares (lower curve): Waiting time tw as a function of applied drive fd for the superheated sample illustrated in Fig. 2. Dashed line indicates a fit to tw ∝ 1/fd. Circles (upper curve): Response saturation time ts for the same sample. Dotted line indicates a fit to ts ∝ (fd−0.0053)−1.
As illustrated by the lower curve in Fig. 5, the waiting time tw decreases rapidly as the applied driving force fd increases, until for fd > 0.0065f0* there is no measurable waiting time. Since a channel is opening along the length of the system during the waiting time, tw should be proportional to the amount of time required for vortices to move along this channel. This is given by:
twLx/fd ,
(4)
where Lx is the system size along the length of the channel. A fit of tw to 1/fd is shown in Fig. 5 by the dashed line.
The time ts required for the response to saturate decreases with fd for fd < 0.0065f0*, as indicated by the upper curve in Fig. 5. For tw < t < ts, the ordered channel begins to spread through the sample in the direction transverse to the applied driving force. The motion of this ordered front resembles the transverse depinning of a longitudinally driven interface. The faster the interface is moving in the longitudinal direction, the lower the transverse depinning force is, since the interface becomes less rough. In a model for the transverse depinning of a longitudinally driven elastic string [40], the transverse depinning force fdpT was found to decrease as fdpT ∝ (fdfdp)−α with α = 2/3. In the case of the moving front of ordered vortices, an effective transverse force feffT on the front is provided by the interactions between the pinned and moving vortices. If we assume that these interactions do not change with fd, since fd is not being applied in the transverse direction, then feffT remains constant while fdpT decreases with increasing applied drive fd. As a result, the ordered front propagates outward more quickly as fd increases, and the saturation time ts required for the ordered channel to fill the entire sample decreases. In Fig. 5 the dotted line indicates a fit to
ts ∝ (fdfd0)−1 ,
(5)
with fd0=0.0053. For fd < 0.0053f0*, there was no voltage response to the applied current over the time period we considered (indicating that tw > 400000) and the vortices remained stationary in the supercooled state. The apparent discontinuity in tw from a finite to an unmeasured value arises only because our simulations were performed for a finite amount of time.
Fig6.png
Figure 6: Decreasing transient voltage response curves Vx versus time for superheated state, for sm=0.7 and fd/f0*= (bottom) 0.006, 0.007, 0.008, 0.009, 0.010, and 0.011 (top).
We next consider transient effects produced by superheating the lattice. In Fig. 6 we show a superheated system at sm=0.7 prepared in the ordered state by artificially placing the vortices into perfectly aligned columns at t=0. Here we find a large initial Vx response that decays. With larger fd the decay takes an increasingly long time. The time scale for the decay is much shorter than the time scale for the increasing response in Fig. 2. As illustrated in Fig. 3(c) and (d), the z-axis correlation Cz decays more rapidly than the overall voltage response Vx, indicating that vortex motion continues to occur even after the vortex lines have been broken apart into individual pancakes. The form of Vx cannot be fit by any simple function over a significant period of time. The decay of Cz, however, is nearly linear with time before saturating at t ≈ 3500. For fd ≥ 0.011f0* the voltage does not decay completely away to zero, but the vortices continue to move in the disordered state.
Fig7.png
Figure 7: Total voltage drop ∆Vx between the peak and plateau values of the decreasing response curves as a function of applied drive fd.
The decaying response of the superheated vortex state resembles the yield drop curves observed in crystalline solids, as first noted in low-Tc materials by Good and Kramer [16]. In a yield drop, the stress required to maintain a constant shear strain rate decreases with time. Such a drop occurs when the crystalline solid has a low initial concentration of defects, and the drop is associated with a proliferation of dislocations inside the crystal. In the case of the superheated vortex lattice, a transition from the ordered to the disordered state occurs and the vortex velocity drops. Good and Kramer find that the total drop in the response of the vortex lattice increases linearly with the applied voltage [16]. To paraphrase their argument, the voltage response of the lattice can be written Vx=FmRffd, where Fm is the fraction of the vortex lattice that is moving, and Rf is the flux flow resistance, or the slope of the V(I) curve at high currents. The change in voltage response from the initial peak, where Fm0=1 and the entire lattice is moving, to the saturated plateau where Fmf=0 and all of the vortices have repinned, can then be written
Vx0Vxf = (Fm0Fmf)Rffd,
(6)
or ∆Vx = Rffd. In Fig. 7 we plot the difference ∆Vx between Vx at the peak and plateau as a function of applied drive fd, and find a linear relation with slope Rf=0.93, in good agreement with the expected value Rf=1. There is a deviation from linearity for fd > 0.010 because at higher drives, Fmf > 0 since all of the vortices do not repin.
Fig8.png
Figure 8: Vortex positions (circles) and trajectories (lines) for the superheated phase at sm=0.7 and fd=0.006 f0*, at times: (a) t=500; (b) t=1500; (c) t=2500; (d) t=4500. Each vortex line breaks apart into pancakes as it encounters the pinning sites.
The vortex positions and trajectories for a superheated sample with sm = 0.7 and fd = 0.006f0*, as in Fig. 6, are shown in Fig. 8(a-d). In Fig. 8(a) the initial vortex state is ordered. In Fig. 8(b-d) the vortex lattice becomes disordered and pinned in a homogeneous manner rather than through nucleation. Each vortex line is decoupled by the point pinning as it moves until the entire line dissociates and is pinned. Since all of the vortex lines decouple simultaneously, this decaying response process occurs much more rapidly than the increasing response of the supercooled sample, which required nucleation and growth of a channel.
Fig9.png
Figure 9: Memory effect in the Vx response of a superheated system with sm=0.7 and fd=0.009f0*. The current is shut off for 400 time steps beginning at t=400, and is turned back on at t=800.
In Fig. 9 we demonstrate the presence of a memory effect by abruptly shutting off fd at t=400 for 400 time steps. The vortex motion stops when the drive is shut off, and when fd is re-applied Vx resumes at the same point. We find such memory on both the increasing and decreasing response curves. Since we are at zero temperature, it is the applied current, and not thermal effects, that is responsible for the vortex motion, and thus the vortices cannot adjust their positions in the absence of a driving current. The response curves and memory effect seen here are very similar to those observed in experiments [7,16].
Fig10.png
Figure 10: (a): V(I) for a supercooled system at sm = 2.0. Top (light line): slow δfd of 0.0001 f0* every 2000 time steps. Bottom (heavy line): δfd = 0.001 f0*. (b): V(I) for a superheated system at sm = 0.7. From left to right, δfd = (fast) 0.02 f0*, 0.01 f0*, 0.005 f0*, 0.002 f0*, 0.001 f0*, 0.0002 f0*, and 0.0001 f0* (slow).
We next consider the effect of changing the rate δfd at which the driving force is increased on V(I) in both superheated and supercooled systems. Fig. 10(a) shows Vx versus fd, which is analogous to a V(I) curve, for the supercooled system at sm=2.0 prepared in a disordered state. Vx remains low during a fast ramp, when the vortices in the strongly pinned disordered state cannot reorganize into the more ordered state. There is also considerable hysteresis since the vortices reorder at higher drives producing a higher value of Vx during the ramp-down. For the slower ramp the vortices have time to reorganize into the weakly pinned ordered state, and remain ordered, producing no hysteresis in V(I).
In a superheated sample, the reverse behavior occurs. Fig. 10(b) shows V(I) curves at different δfd for a system with sm = 0.7 prepared in the ordered state. Here, the fast ramp has a higher value of Vx corresponding to the ordered state while the slow ramp has a low value of Vx. During a slow initial ramp in the superheated state the vortices gradually disorder through rearrangements but there is no net vortex flow through the sample. Such a phase was proposed by Xiao et al. [7] and seen in recent experiments on BSCCO samples [24]. At the slower δfd, we find negative dV/dI characteristics which resemble those seen in low- [14,41,42,43,44] and high- [45] temperature superconductors. Here, V(I) initially increases as the vortices flow in the ordered state, but the vortices decouple as the lattice moves, increasing fc and dropping V(I) back to zero, resulting in an N-shaped characteristic.
Fig11.png
Figure 11: Effect of supercooling on fc. Filled squares: equilibrium fc. Open diamonds: fc for samples prepared in a disordered, decoupled state.
To demonstrate the effect of vortex lattice disorder on the critical current, in Fig. 11 we plot the equilibrium fc along with fc obtained for the supercooled system, in which each sample is prepared in a state with sm = 0.5, and then sm is raised to a new value above smc before fc is measured. The disorder in the supercooled state produces a value of fc between the two extrema observed in the equilibrium state. Note that the sharp transition in fc associated with equilibrium systems is now smooth. A similar increase in the critical current when the vortex lattice has been prepared in a disordered state, rather than in an ordered state, has also been observed experimentally as a history effect [15,46,47,48,49,50,51].
Fig12.png
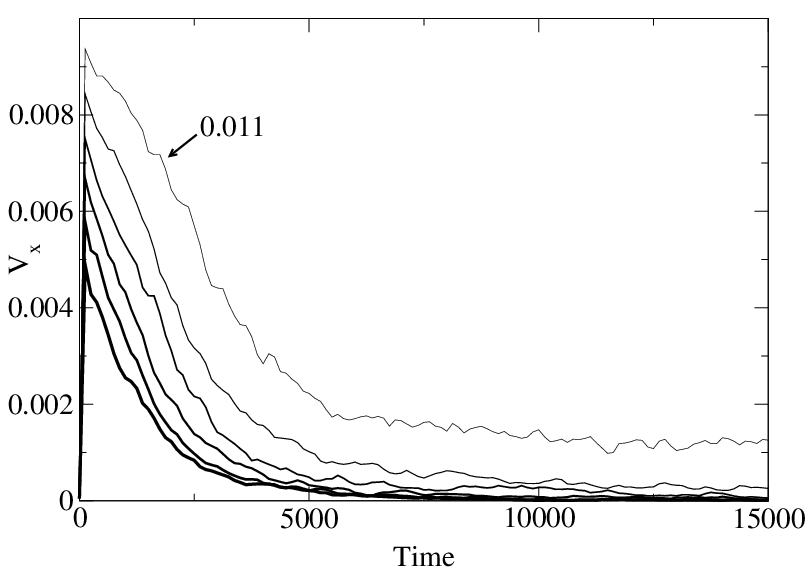
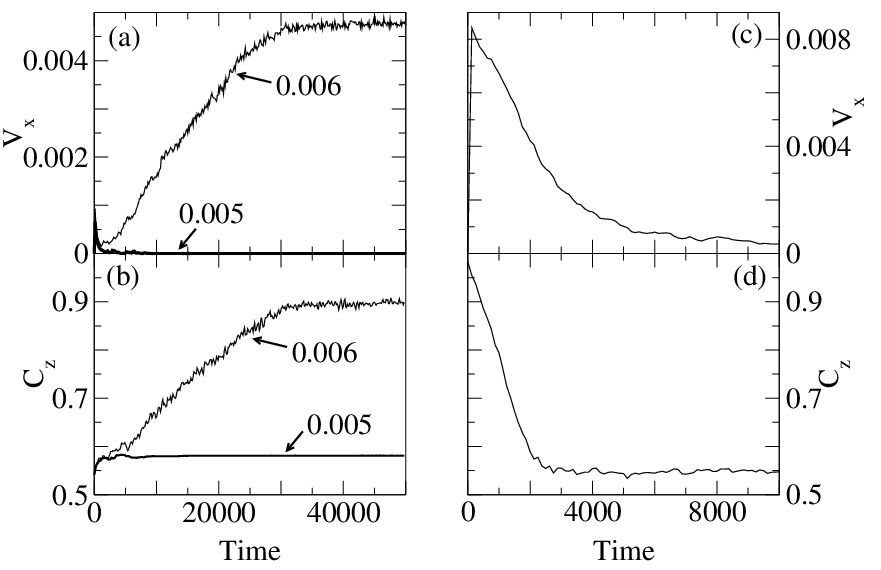
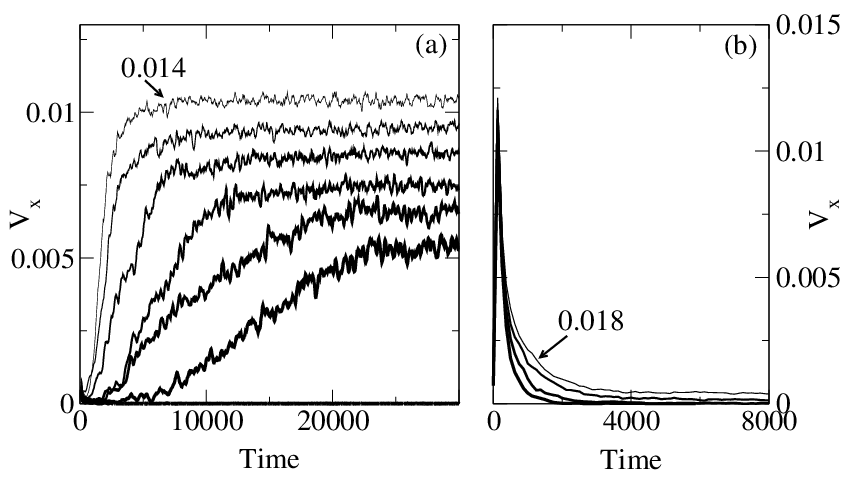
Figure 12: Transient voltage response curves Vx versus time. 
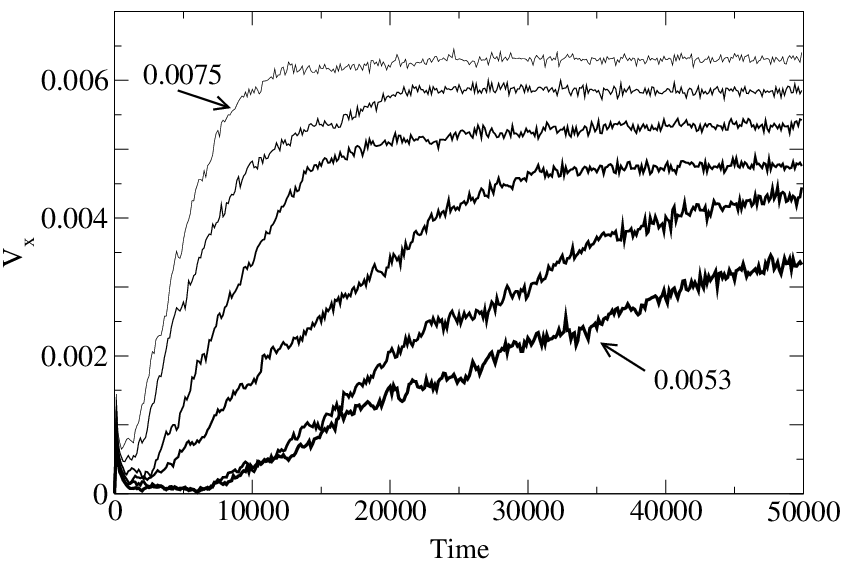
(a) Increasing response for supercooled state, for nv = 2.5 and fd/f0* = (bottom) 0.008, 0.009, 0.010, 0.011, 0.012, 0.013, and 0.014 (top). 
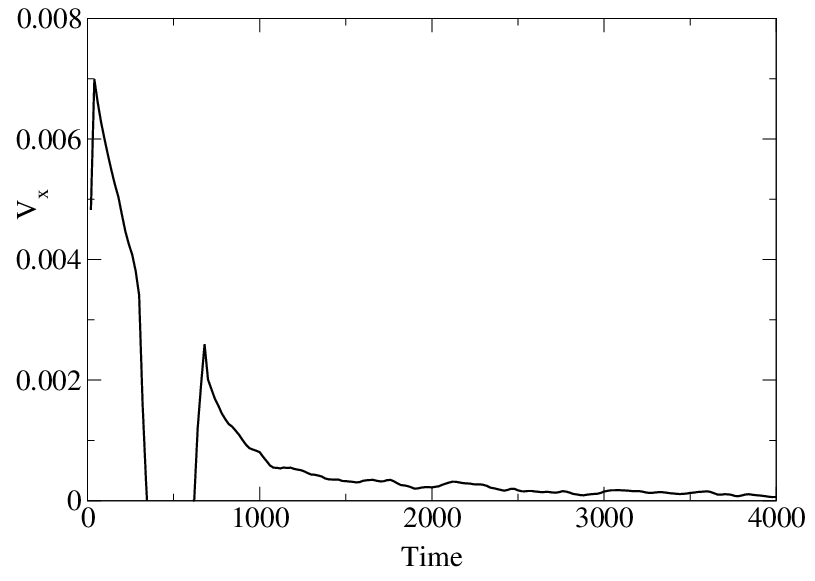
(c) Decreasing response for superheated state, for nv=3.1 and fd/f0* = (bottom) 0.0016, 0.0017, 0.00175 and (top) 0.0018.
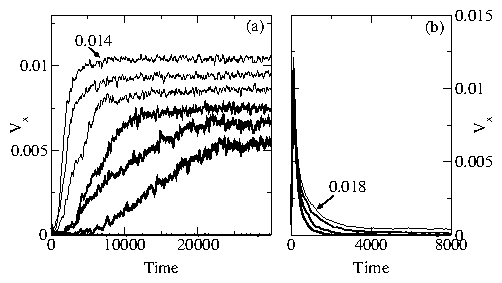
Fig13.png
Figure 13: Pancake vortex positions (circles) and trajectories (lines) for the supercooled phase at nv=2.5λ2 and fd=0.009 f0*, seen from the top of the sample, at times: (a) t=5000; (b) t=7500; (c) t=10000; (d) t=12500; (e) t=15000; (f) 20000. An ordered channel forms in the sample and grows outward.
Fig14.png
Figure 14: Vortex positions (circles) and trajectories (lines) for the superheated phase at nv=3.1 and fd=0.016 f0*, at times: (a) t=0; (b) t=1500. Each vortex line breaks apart into pancakes as it encounters the pinning sites.
Fig15.png
Figure 15: V(I) for a superheated system at nv=3.1/λ2. From left to right, δfd= (fast) 0.01 f0*, 0.005 f0*, 0.002 f0*, 0.001f0*, 0.0002f0*, and 0.0001f0* (slow).
We find the same metastable and history-dependent effects described above on either side of a magnetic-field driven disordering transition. To demonstrate this, in Fig. 12(a) we show Vx for several different drives fd for a sample with dense, strong pinning (fp=0.08f0*, np=8.0/λ2) at nv=2.5/λ2, where a field-induced decoupling transition occurs above nv=3.0/λ2. The sample shown in Fig. 12(a) would be coupled in equilibrium but has been prepared in a decoupled state. For fd ≥ 0.009f0* we observe a time dependent increasing response similar to that shown in Fig. 2. The rising response is associated with the formation of a channel of ordered, coupled vortices as illustrated in Fig. 13. In Fig. 12(b) we show Vx for the same sample in a superheated state at nv=3.1/λ2, where the sample would be disordered in equilibrium but has been prepared in an ordered state. Here we find a transient decreasing response as the lattice disorders, similar to the response in Fig. 6. Images of the sample before and after the current pulse is applied are illustrated in Fig. 14, showing the transition from an ordered to a disordered state. The presence of transients also leads to a ramp-rate dependence of the V(I) curve, and in Fig. 15 we illustrate the appearance of N-shaped characteristics in the superheated system when the current is ramped at increasing rates for the same sample.
Our simulation does not contain a surface barrier which can inject disorder at the edges. Such an effect is proposed to explain experiments in which AC current pulses induce an increasing response as the vortices reorder but DC pulses produce a decaying response [6,8]. We observe no difference between AC and DC drives.
In low temperature superconductors, a rapid increase in z-direction vortex wandering occurs simultaneously with vortex disordering [23], suggesting that the change in z-axis correlations may be crucial in these systems as well. Our results, along with recent experiments on layered superconductors, suggest that the transient response seen in low temperature materials should also appear in layered materials.
In summary we have investigated transient and metastable states near the 3D-2D transition by supercooling or superheating the system. We find voltage-response curves and memory effects that are very similar to those observed in experiments, and we identify the microscopic vortex dynamics associated with these transient features. In the supercooled case the vortex motion occurs through nucleation of a channel of ordered moving vortices followed by an increase in the channel width over time. In the superheated case the ordered phase homogeneously disorders. We also demonstrate that the measured critical current depends on the vortex lattice preparation and on the current ramp rate.
We acknowledge helpful discussions with E. Andrei, S. Bhattacharya, X.S. Ling, Z.L. Xiao, and E. Zeldov. This work was supported by CLC and CULAR (LANL/UC) by NSF-DMR-9985978, by the Director, Office of Adv. Scientific Comp. Res., Div. of Math., Information and Comp. Sciences, U.S. DoE contract DE-AC03-76SF00098, and by the U.S. Dept. of Energy under Contract No. W-7405-ENG-36.

References

[1]
G. Blatter, M.V. Feigel'man, V.B  Geshkenbein, A.I. Larkin, and V.M. Vinokur, Rev. Mod. Phys. 66, 1125 (1994).
[2]
R. Wordenweber and P.H. Kes, Phys. Rev. B 34, 494 (1986).
[3]
S. Bhattacharya and M.J. Higgins, Phys. Rev. Lett. 70, 2617 (1993); M.J. Higgins and S. Bhattacharya, Physica C 257, 232 (1996).
[4]
G. Ravikumar, V.C. Sahni, P.K. Mishra, T.V. Chandrasekhar Rao, S.S. Banerjee, A.K. Grover, S. Ramakrishnan, S. Bhattacharya, M.J. Higgins, E. Yamamoto, Y. Haga, M. Hedo, Y. Inada, and Y. Onuki, Phys. Rev. B 57, R11069 (1998); S.S. Banerjee, N.G. Patil, S. Saha, S. Ramakrishnan, A.K. Grover, S. Bhattacharya, G. Ravikumar, P.K. Mishra, T.V. Chandrasekhar Rao, V.C. Sahni, M.J. Higgins, E. Yamamoto, Y. Haga, M. Hedo, Y. Inada, and Y. Onuki, ibid. 58, 995 (1998); S.S. Banerjee, N.G. Patil, S. Ramakrishnan, A.K. Grover, S. Bhattacharya, P.K. Mishra, G. Ravikumar, T.V. Chandrasekhar Rao, V.C. Sahni, M.J. Higgins, C.V. Tomy, G. Balakrishnan, and D.McK. Paul, ibid. 59, 6043 (1999).
[5]
W. Henderson, E.Y. Andrei, M.J. Higgins, and S. Bhattacharya, Phys. Rev. Lett. 77, 2077 (1996).
[6]
W. Henderson, E.Y. Andrei, and M.J. Higgins, Phys. Rev. Lett. 81, 2352 (1998).
[7]
Z.L. Xiao, E.Y. Andrei and M.J. Higgins, Phys. Rev. Lett. 83, 1664 (1999); Z.L. Xiao, E.Y. Andrei, P. Shuk, and M. Greenblatt, ibid. 85, 3265 (2000); Z.L. Xiao, E.Y. Andrei, P. Shuk, and M. Greenblatt, ibid. 86, 2431 (2001).
[8]
Y. Paltiel, E. Zeldov, Y.N. Myasoedov, H. Shtrikman, S. Bhattacharya, M.J. Higgins, Z.L. Xiao, E.Y. Andrei, P.L. Gammel, and D.J. Bishop, Nature 403, 398 (2000); Y. Paltiel, E. Zeldov, Y. Myasoedov, M.L. Rappaport, G. Jung, S. Bhattacharya, M.J. Higgins, Z.L. Xiao, E.Y. Andrei, P.L. Gammel, and D.J. Bishop, Phys. Rev. Lett. 85, 3712 (2000).
[9]
T. Giamarchi and P. Le Doussal, Phys. Rev. B 55, 6577 (1997).
[10]
R. Cubitt, E.M. Forgan, G. Yang, S.L. Lee, D.McK. Paul, H.A. Mook, M. Yethiraj, P.H. Kes, T.W. Li, A.A. Menovsky, Z. Tarnawski, and K. Mortensen, Nature (London) 365, 407 (1993).
[11]
T. Tamegai, Y. Iye, I. Oguro, and K. Kishio, Physica C 213, 33 (1993).
[12]
L.I. Glazman and A.E. Koshelev, Phys. Rev. B 43, 2835 (1991); L.L. Daemen, L.N. Bulaevskii, M.P. Maley, and J.Y. Coulter, Phys. Rev. Lett. 70, 1167 (1993); Phys. Rev. B 47, 11291 (1993).
[13]
M.V. Feigel'man, V.B. Geshkenbein, and A.I. Larkin, Physica C 167, 177 (1990); V.M. Vinokur, P.H. Kes, and A.E. Koshelev, ibid. 168, 29 (1990); V.B. Geshkenbein and A.I. Larkin, ibid. 167, 177 (1990); A.E. Koshelev and P.H. Kes, Phys. Rev. B 48, 6539 (1993); G. Blatter, V. Geshkenbein, A. Larkin, and H. Nordborg, Phys. Rev. B 54, 72 (1996); A.E. Koshelev and V.M. Vinokur, ibid. 57, 8026 (1998).
[14]
R.F. Frindt, D.J. Huntley, and J. Kopp, Solid St. Commun. 11, 135 (1972).
[15]
C. Baker and J. Sutton, Phil. Mag. 19, 1223 (1969).
[16]
J.A. Good and E.J. Kramer, Phil. Mag. 24, 339 (1971).
[17]
Y. Anjaneyulu, W.C.H. Joiner, J.-L. Lee, and K. Sisson, J. Appl. Phys. 54, 3310 (1983).
[18]
W. Henderson, E.Y. Andrei, M.J. Higgins, and S. Bhattacharya, Phys. Rev. Lett. 80, 381 (1998).
[19]
S.S. Banerjee, N.G. Patil, S. Ramakrishnan, A.K. Grover, S. Bhattacharya, G. Ravikumar, P.K. Mishra, T.V. Chandrasekhar Rao, V.C. Sahni, and M.J. Higgins, Appl. Phys. Lett. 74, 126 (1999); G. Ravikumar, P.K. Mishra, V.C. Sahni, S.S. Banerjee, A.K. Grover, S. Ramakrishnan, P.L. Gammel, D.J. Bishop, E. Bucher, M.J. Higgins, and S. Bhattacharya, Phys. Rev. B 61, 12490 (2000).
[20]
G. Ravikumar, H. Küpfer, A. Will, R. Meier-Hirmer, and Th. Wolf, Phys. Rev. B 65, 094507 (2002).
[21]
P. Chaddah and S.B. Roy, Phys. Rev. B 60, 11926 (1999).
[22]
M. Nicodemi and H.J. Jensen, J. Phys. A 34, 8425 (2001); H.J. Jensen and M. Nicodemi, Europhys. Lett. 57, 348 (2002).
[23]
J. Shi, X.S. Ling, R. Liang, D.A. Bonn, and W.N. Hardy, Phys. Rev. B 60, R12593 (1999); X.S. Ling, S.R. Park, B.A. McClain, S.M. Choi, D.C. Dender, and J.W. Lynn, Phys. Rev. Lett. 86, 712 (2001).
[24]
C.J. van der Beek, S. Colson, M.V. Indenbom, and M. Konczykowski, Phys. Rev. Lett. 84, 4196 (2000).
[25]
B. Sas, F. Portier, K. Vad, B. Keszei, L.F. Kiss, N. Hegman, I. Puha, S. Meszaros, and F.I.B. Williams, Phys. Rev. B 61, 9118 (2000).
[26]
D. Giller, A. Shaulov, T. Tamegai, and Y. Yeshurun, Phys. Rev. Lett. 84, 3698 (2000).
[27]
S. Kokkaliaris, P.A.J. de Groot, S.N. Gordeev, A.A. Zhukov, R. Gagnon, and L. Taillefer, Phys. Rev. Lett. 82, 5116 (1999).
[28]
S.O. Valenzuela and V. Bekeris, Phys. Rev. Lett. 84, 4200 (2000).
[29]
A.V. Pan and P. Esquinazi, Eur. Phys. J. B 17, 405 (2000).
[30]
C.J. Olson, G.T. Zimányi, A.B. Kolton, and N. Grønbech-Jensen, Phys. Rev. Lett. 85, 5416 (2000).
[31]
N. Avraham, B. Khaykovich, Y. Myasoedov, M. Rappaport, H. Shtrikman, D.E. Feldman, T. Tamegai, P.H. Kes, M. Li, M. Konczykowski, K. van der Beek, and E. Zeldov, Nature 411, 451 (2001).
[32]
A.E. Koshelev and V.M. Vinokur, Phys. Rev. Lett. 73, 3580 (1994); T. Giamarchi and P. Le Doussal, Phys. Rev. Lett. 78, 752 (1997); P. Le Doussal and T. Giamarchi, Phys. Rev. B 57, 11356 (1998); L. Balents, M.C. Marchetti, and L. Radzihovsky, Phys. Rev. Lett. 78, 751 (1997); Phys. Rev. B 57, 7705 (1998); K. Moon, R.T. Scalettar, and G.T. Zimányi, Phys. Rev. Lett. 77, 2778 (1996); S. Ryu, M. Hellerqvist, S. Doniach, A. Kapitulnik, and D. Stroud, Phys. Rev. Lett. 77, 5114 (1996); M.C. Faleski, M.C. Marchetti, and A.A. Middleton, Phys. Rev. B 54, 12427 (1996); S. Spencer and H.J. Jensen, Phys. Rev. B 55, 8473 (1997); C.J. Olson, C. Reichhardt, and F. Nori, Phys. Rev. Lett. 81, 3757 (1998); A.B. Kolton, D. Domínguez, and N. Grønbech-Jensen, Phys. Rev. Lett. 83, 3061 (1999).
[33]
K. Binder, Phys. Rev. B 8, 3423 (1973).
[34]
J.R. Clem, Phys. Rev. B 43, 7837 (1991).
[35]
E.H. Brandt, Rep. Prog. Phys. 58, 1465 (1995).
[36]
C.J. Olson, C. Reichhardt, R.T. Scalettar, G.T. Zimányi, and N. Grønbech-Jensen, Physica C, in press.
[37]
C.J. Olson, C. Reichhardt, and V.M. Vinokur, Phys. Rev. B 64, 140502 (2001).
[38]
M. Marchevsky, M.J. Higgins, and S. Bhattacharya, Nature (London) 409, 591 (2001).
[39]
D. Giller, B. Kalisky, A. Shaulov, T. Tamegai, and Y. Yeshurun, J. Appl. Phys. 89, 7481 (2001).
[40]
C. Reichhardt and C.J. Olson, Phys. Rev. B 65, 094301 (2002).
[41]
S. Borka, I.N. Goncharov, D. Fricsovszky, and I.S. Khukhareva, Sov. J. Low Temp. Phys. 3, 347 (1977) [Fiz. Nizk. Temp. 3, 716 (1977)].
[42]
N.E. Alekseevskii, N.M. Dobrovol'skii, A.V. Dubrovik, E.P. Krasnoperov, and V.A. Marchenko, Sov. Phys. Solid State 17, 1349 (1976) [Fiz. Tverd. Tela 17, 2065 (1975)].
[43]
C.V. Tomy, G. Balakrishnan, and D.McK. Paul, Physica C 280, 1 (1997).
[44]
C.V. Tomy, G. Balakrishnan, and D.M. Paul, Phys. Rev. B 56, 8346 (1997).
[45]
A.A. Zhukov, S. Kokkaliaris, P.A.J. de Groot, M.J. Higgins, S. Bhattacharya, R. Gagnon, and L. Taillefer, Phys. Rev. B 61, R886 (2000).
[46]
M. Steingart, A.G. Putz, and E.J. Kramer, J. Appl. Phys. 44, 5580 (1973).
[47]
H. Küpfer and W. Gey, Phil. Mag. 36, 859 (1977).
[48]
C.C. Koch, A. DasGupta, D.M. Kroeger, and J.O. Scarbrough, Phil. Mag. B 40, 361 (1979).
[49]
R. Wördenweber, P.H. Kes, and C.C. Tsuei, Phys. Rev. B 33, 3172 (1986).
[50]
H. Obara, H. Yamasaki, Y. Kimura, and S. Kosaka, Appl. Phys. Lett. 55, 2342 (1989).
[51]
N.R. Dilley, J. Herrmann, S.H. Han, and M.B. Maple, Phys. Rev. B 56, 2379 (1997).


File translated from TEX by TTHgold, version 4.00.

Back to Home