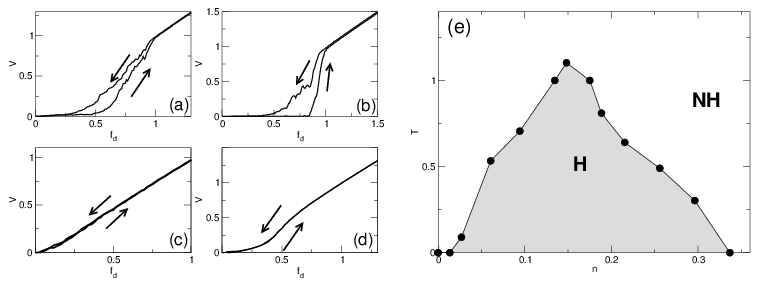
Europhysics Letters 72, 444 (2005)

Hysteresis and Noise in Stripe- and Clump- Forming Systems

C. Reichhardt, C.J. Olson Reichhardt, and A.R. Bishop

Center for Nonlinear Studies and Theoretical Division, Los Alamos National Laboratory
Los Alamos, NM 87545, USA

received 25 July 2005; accepted 8 September 2005
published online 30 September 2005

PACS. 74.25.-q - Properties of type I and type II superconductors
PACS. 72.70.+m - Noise processes and phenomena.
PACS. 71.45.Lr - Charge-density-wave systems.
Abstract. - We use simulations to examine hysteresis and noise in a model system that produces heterogeneous orderings including stripe and clump phases. In the presence of a disordered substrate, these heterogeneous phases exhibit 1/fα noise and hysteresis in transport. The noise fluctuations are maximal in the heterogeneous phases, while in the uniform phases the hysteresis vanishes and both α and the noise power decrease. We compare our results to recent experiments exhibiting noise and hysteresis in high-temperature superconductors where charge heterogeneities may occur.
There is growing evidence that a wide variety of condensed matter systems intrinsically exhibit heterogeneous charge ordering in the form of mesoscopic clump, labyrinth, or stripe phases. Examples of systems where such phenomena may occur include cuprate superconductors [1,2,3,4,5,6], antiferromagnetic insulators [7], and two-dimensional electron gas (2DEG) systems [8,9]. Heterogeneous states are observed in manganites and diluted magnetic semiconductors [10] as well as superconductors [12,13]. In most of these systems, some form of quenched disorder from intrinsic defects in the sample is present, and it can destroy any long range ordering in the patterns [11]. Charged stripe forming systems have also been shown to exhibit self-generating disordered glassy properties [14,15,16]. The presence of ordered or disordered heterogeneities should affect the bulk transport, fluctuations, and transient responses of the systems; however, little is known about how the effect of heterogeneity on transport would differ from that of homogeneous but disordered systems which form uniform crystalline or partially crystalline phases.
Recently, transport experiments in underdoped samples of YBCO have revealed hysteretic jumps in the current-voltage curves at low temperatures, as well as non-Gaussian noise fluctuations in the resistance curves [17]. As the temperature is increased, the current-voltage curves become smooth and non-hysteretic. These results have been interpreted as a signature of some form of large scale heterogeneities such as disordered fluctuating domains. Other experiments on cuprate superconductors in the non-superconducting region of the phase diagram have shown magnetic hysteresis and avalanchelike jumps in the magnetization curves [18,19], reminiscent of the Barkhausen noise that occurs for domain wall depinning in ferromagnets. This magnetic hysteresis vanishes at low and high doping and at high temperatures [19]. Transport experiments in 2DEGs have also produced hysteretic current-voltage curves which are believed to indicate the formation of pinned clump or bubble phases [20].
To examine the effect of heterogeneity on transport and compare to the recent experiments, in this work we study the noise fluctuations and hysteresis in the transport curves for a two-dimensional model that exhibits uniform, clump, and disordered stripe phases as a function of density. Our model consists of interacting particles with a repulsive Coulomb interaction and an additional short range exponential attraction. At zero temperature and in the absence of quenched disorder, a uniform crystal occurs at low density. As the density is increased the system forms a clump phase, then a stripe or labyrinth phase followed by an anti-clump phase and finally a uniform partially crystalline phase at high densities. When quenched disorder is present the phases are more disordered and can be pinned in the presence of a driving force.
We find that the heterogeneous clump and stripe phases exhibit hysteresis in the transport curves accompanied by a large increase in the noise power with a 1/fα noise spectrum characteristic, where α > 1. In the uniform phase at low and high densities, the hysteresis vanishes and 1/f noise appears. As the temperature is increased in the heterogeneous phases, the hysteresis is lost and the transport curves become smooth with an accompanying decrease in the noise fluctuations. We find that the hysteresis occurs in a dome-shaped region of the temperature and density phase diagram. Importantly, these properties require both the intrinsic heterogeneity and the pinning mechanisms. Our results are consistent with the clump and stripe phases forming a glassy or domain glass phase.
Model-We simulate a two-dimensional system with periodic boundary conditions in the x and y directions. We fix the system size to 90 ×90 and vary the particle density n by changing the number of particles N from 80 to 3000. The particle-particle interaction fij=−∇U(rij)rij for particles separated by rij=rirj consists of a long-range Coulomb repulsion and a short range exponential attraction:
U(r) = 1/rBexp(−κr).
(1)
At small and large r the repulsive Coulomb term dominates. The attractive interaction can be varied using the inverse screening length κ and the parameter B, which are fixed at κ = 0.25 and B=0.29. In previous work we have shown that this model produces crystal, clump, stripe, and anti-clump phases as B and the density n are varied [21]. Here we also consider the effects of quenched disorder, modeled as Np randomly placed attractive parabolic pins of strength fp=2.5 and radius rp=0.125κ−1, giving fp=∑k=1Np(fp/rp)rik Θ(1−rik/rp), where Θ is the Heaviside step function and the particle-pin spacing is rik=rirk. The overdamped equation of motion for a single particle i is ηVi = fi = ∑jiNfij + fp + fd + fT. Here η = 1 is a phenomenological damping term. The driving term fd=fdx would come from an applied voltage in the case of charged particles. The conduction is proportional to the average particle velocity < V > in the direction of the applied drive. We increase the drive in small increments and average over many thousands of time steps to avoid transient effects and ensure the velocities have reached a steady state. The temperature is modeled as Langevin random kicks with the properties < fT(t) > = 0 and < fT(t)fT(t) > = 2ηkBTδ(tt). The system is initially prepared in a high temperature molten state and annealed down to a lower finite temperature, after which the driving force is applied. The parameters we vary in this work are the density, driving force, and temperature. We have performed a similar series of simulations with fp=1.5 and find the same behavior at shifted values of drive. We have also checked the effect of system size using a 40 × 40 system, and find the same results shown here but with lower resolution.
Fig1.png
Figure 1: The particle positions (black dots) after annealing to T = 0 for densities (a) n = 0.013, (b) n = 0.06, (c) n = 0.15, and (d) n = 0.34.
In Fig. 1 we illustrate some of the representative phases that occur with increasing density in the presence of the quenched disorder. In Fig. 1(a) at density n = 0.013, the particles form a uniform phase of single charges. In Fig. 1(b) at n = 0.06, the system is comprised of heterogeneous arrangements of disordered clumps. For higher density, such as n = 0.15 shown in Fig. 1(c), the system forms a disordered labyrinth pattern. At very high densities the system returns to a uniform phase with considerable crystalline order as seen in Fig. 1(d) for n = 0.34. The heterogeneous phases occur for 0.05 < n < 0.34.
By examining the velocity-force curves at T = 0, we find smooth non-hysteretic curves for densities where uniform phases occur, while in the heterogeneous regions, V(fd) shows pronounced hysteresis. In Fig. 2(a) we plot the velocity vs applied force curve for a heterogeneous system at n = 0.15 where the equilibrium state is a labyrinth phase. Here the curve shows two abrupt changes in slope, and V on the decreasing sweep of fd is higher than on the increasing sweep. If the drive is increased again the same ramp up curve is followed. In Fig. 2(b), V(fd) is shown for a system with n=0.06, where the equilibrium system forms a clump phase. Here a hysteretic region is also observed. The current-voltage curve for n=0.34, plotted in Fig. 2(d), is smooth and has no hysteresis within our resolution. This density n=0.34 corresponds to the uniform phase seen in Fig. 1(d). For the densities that exhibit hysteresis, as the temperature is increased the width of the hysteresis is reduced and it vanishes completely at high temperatures. In Fig. 2(c) we plot the velocity-force curve for the system in Fig. 2(a) for a temperature of T=1.3 where the hysteresis has been lost and the velocity force curve is smooth.
Fig2.png
Figure 2: The velocity V vs driving force fd curves for (a) density n = 0.15, T = 0.1; (b) n = 0.06, T = 0.1; (c) n = 0.15, T = 1.3; (d) n = 0.34, T=0.1. (e) Temperature T vs density n. The shaded region indicates where hysteresis (H) is present in the velocity-force curve. The nonhysteretic region is indicated by NH.
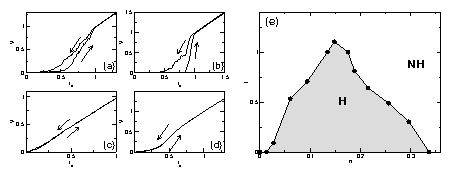
In order to better characterize where the heterogeneous phases occur and where a hysteretic response is observed, we have performed a series of simulations for different densities and temperatures. In Fig. 2(e) we highlight the region of temperature and density where the phases exhibit a finite hysteresis in the velocity force curves. For high and low densities the transport curves are non-hysteretic at T = 0. As the density increases, the temperature at which the hysteresis disappears increases and reaches a maximum at n = 0.15, which corresponds to the density at which labyrinth or stripe patterns appear. As the density is further increased, the hysteresis width decreases and disappears at n ≈ 0.34. There is some asymmetry in the hysteretic region, with the hysteresis extending further on the higher density side of the peak. This is indicative of the importance of collective particle interactions in producing the hysteresis; there are more particles available to interact in the anti-clump state on the high density side of the peak than in the clump state on the low density side. In recent magnetization experiments in doped cuprates, a similar dome-like structure was observed where hysteresis is present as a function of doping and temperature [19]. A direct comparison to the magnetization experiment is difficult since our model does not include magnetism; however, hysteresis in magnetic materials or superconductors can be modeled in general as collections of particles or domains walls interacting with quenched disorder and an external driving field, similar to the model we are using. It would be interesting to measure the hysteresis in the transport characteristics of the experimental system as a function of temperature and doping to see if a similar dome under which hysteresis is present occurs, as found in our simulations. We note that hysteresis is not seen in 2D systems with quenched disorder for purely repulsive interactions such as vortices [22]. Hysteresis in transport can appear in 3D vortex systems when the sample breaks up into two phases and these phases form a heterogeneous labyrinth structure [23]. This suggests that hysteresis in transport is a sign of large scale heterogeneities.
We next examine the noise fluctuations at different densities and temperatures. We apply a constant drive fd and measure the velocity fluctuations δV(t) as a function of time, as illustrated in the velocity trace curve of Fig. 3(a) for a system with n = 0.15. From the velocity fluctuations we can determine the power spectrum using
S(ν) =

δV(t) e−2πiνtdt
2
 
.
(2)
The noise power S0 is defined as the average value of the power spectrum over a particular frequency octave.
Fig3.png
Figure 3: (a) Time series of the velocity fluctuations for a system at T = 0.1 and n = 0.15. (b) The power spectra S(ν) for the velocity fluctuations. Upper curve: n = 0.15, lower curve: n=0.3. The upper solid line is a power law fit with α = 1.6, and the lower solid line is a power law fit with α = 0.95. (c) Noise power S0 for a fixed frequency range vs n. (d) Power spectrum exponent α vs n.
In Fig. 3(b) we plot the power spectrum for n = 0.15, where the labyrinth phase forms, as well as for n = 0.3 where the high density uniform phase forms. Both measurements are performed at T = 0.1. In the labyrinth phase a 1/fα noise spectrum is observed with α = 1.6, while for n = 0.3, α = 1.0. By performing a series of simulations, we can plot the noise power and α for varied n and T. In Fig. 3(c) we show the noise power S0 as a function of n for fixed T = 0.1. In the hysteretic regions, α > 1, while in the uniform regions, α ≤ 1. The noise power is maximum near n = 0.15. In Fig. 3(d) we plot α, which also shows a maximum in the hysteretic regime. The power spectra for the Barkhausen type noise seen in the magnetization experiments were not measured. It would be interesting to examine the change of the noise fluctuations in the hysteretic and non-hysteretic regimes. Simulations of systems producing Barkhausen noise give α = 1.77 [24]. The appearance of α > 1.0 and large noise power in experiments and simulations has been interpreted as evidence of glassy dynamics in 2D charged systems [25,26]. In contrast, noninteracting or single particle scenarios for noise generation predict α ≤ 1.0 [27,28,29].
Fig4.png
Figure 4: (a) The exponent α vs T obtained from the power spectrum for a system with n = 0.15. (b) The corresponding noise power S0 vs T.
We next examine the noise at a fixed density and increasing temperature as shown in Fig. 4 for a system with n = 0.15. Here the noise power decreases with increasing temperature and α also decreases, as seen in Fig. 4(a). As the temperature increases, the heterogeneities begin to melt and the system becomes more uniform. In general, in the hysteric regions of the T-n phase diagram, α > 1. In Fig. 4(a) the hysteresis disappears in the velocity force curves for T >~1.0. This corresponds to the temperature regime where the value of α drops to α < 1. The noise power S0 decreases exponentially with temperature, as shown in Fig. 4(b). Single particle hopping models often predict an increase in the noise power with temperature rather than the decrease observed here [29]. This supports the importance of collective particle interactions in determining the transport properties and hysteresis.
In summary, we have examined hysteresis and noise in a model system of heterogeneous charge ordering in the presence of quenched disorder. We find that at low and high densities, the system forms non-heterogeneous phases that do not exhibit hysteresis in the transport curves. At intermediate densities, however, the system forms heterogeneous clump and stripe phases which exhibit hysteresis in the transport curves. As a function of temperature and doping, we find a dome region where the hysteresis occurs. This prediction can be tested in, e.g., transport measurements in high temperature superconductors for varied dopings. We also examine the noise properties and find that in the heterogeneous and hysteretic regions, the noise power is substantially enhanced and shows a 1/fα noise spectrum characteristic with α > 1. We predict a peak in the noise power and α as a function of particle density. Additionally both the noise power and the exponent α in the heterogeneous regions decrease as a function of temperature. Our results are consistent with recent transport and magnetization experiments in cuprate superconductors [17,18,19] in which charge heterogeneities are believed to occur. These results are also consistent with the phase diagram obtained in very recent work on an anisotropic model for interacting charged particles [30].
This work was supported by the US DoE under Contract No. W-7405-ENG-36.

References

[1]
Gor'Kov L.P. and Sokol A.V. JETP Lett. 46 (1987) 420.
[2]
Zaanen J. and Gunnarsson O. Phys. Rev. B 40 (1989) R7391.
[3]
Machida K Physica C 158 (1989) 192; Kato M., Machida K., Nakanishi H. and Fujita M. J. Phys. Soc. Jpn. 59 (1990) 1047.
[4]
Emery V.J., Kivelson S.A. and Lin H.Q. Phys. Rev. Lett. 64 (1990) 475.
[5]
Kivelson S.A., Bindloss I.P., Fradkin E., Oganesyan V., Tranquada J.M., Kapitulnik A. and Howald C. Rev. Mod. Phys. 75 (2003) 1201.
[6]
Stojkovic B.P., Yu Z.G., Bishop A.R., Neto A.H.C. and Grønbech-Jensen N. Phys. Rev. Lett. 82 (1999) 4679.
[7]
Cho J.H., Chou F.C. and Johnston D.C. Phys. Rev. Lett. 70 (1993) 222.
[8]
Fogler M.M., Koulakov A.A. and Shklovskii B.I. Phys. Rev. B 54 (1996) 1853.
[9]
Fradkin E. and Kivelson S.A. Phys. Rev. B 59 (1999) 8065.
[10]
Alvarez G. and Dagotto E. J. Mag. Mag. Mater. 272-276 (2004) 15, and references therein.
[11]
Pankov S. and Dobrosavljevic V. Phys. Rev. Lett. 94 (2005) 046402.
[12]
Tranquada J.M., Sternlieb B.J., Axe J.D., Nakamura Y. and Uchida S. Nature 375 (1995) 561.
[13]
Lang K.M., Madhavan V., Hoffman J.E., Hudson E.W., Eisaki H., Uchida S. and Davis J.C. Nature 415 (2002) 412.
[14]
Schmalian J. and Wolynes P.G. Phys. Rev. Lett. 85 (2000) 836.
[15]
Westfahl H., Schmalian J. and Wolynes P.G. Phys. Rev. B 64 (2001) 174203.
[16]
Panagopoulos C. and Dobrosavljevic V. cond-mat/0410111.
[17]
Bonetti J.A., Caplan D.S., Van Harlingen D.J. and Weissman M.B. Phys. Rev. Lett. 93 (2004) 087002.
[18]
Panagopoulos C., Majoros M. and Petrovic A.P. Phys. Rev. B 69 (2004) 144508.
[19]
Panagopoulos C. et al. cond-mat/0412570.
[20]
Cooper K.B., Lilly M.P., Eisenstein J.P., Pfeiffer L.N. and West K.W. Phys. Rev. B 60 (1999) R11285.
[21]
Reichhardt C., Olson Reichhardt C.J., Martin I. and Bishop A.R. Europhys. Lett. 61 (2003) 221; Phys. Rev. Lett. 90 (2003) 026401.
[22]
Olson C.J., Reichhardt C. and Nori F. Phys. Rev. Lett. 81 (1998) 3757.
[23]
Dogru O., Andrei E.Y., Higgins M.J. and Bhattacharya S. cond-mat/0503059.
[24]
Travesset A., White R.A. and Dahmen K.A. Phys. Rev. B 66 (2002) 024430.
[25]
Bogdanovich S. and Popovic D. Phys. Rev. Lett. 88 (2002) 236401.
[26]
Reichhardt C. and Olson Reichhardt C.J. Phys. Rev. Lett. 93 (2004) 176405.
[27]
Weissman M.B. Rev. Mod. Phys. 60 (1988) 537.
[28]
Shklovskii B.I. Solid State Commun. 33 (1980) 273.
[29]
Shtengel K and Yu C.C. Phys. Rev. B 67 (2003) 165106.
[30]
Mertelj T., Kabanov V.V. and Mihailovic D. Phys. Rev. Lett. 94 (2005) 147003.


File translated from TEX by TTHgold, version 4.00.

Back to Home