Noise at the crossover from Wigner liquid to Wigner glass
C. Reichhardt and C.J. Olson Reichhardt
Center for Nonlinear Studies and Theoretical
Division,
Los Alamos National Laboratory, Los Alamos, New Mexico 87545
(Received 9 April 2004; published 21 October 2004)
Using a simple classical model for interacting electrons in two dimensions
with random disorder, we show that a crossover from a Wigner
liquid to a Wigner glass occurs as
a function of charge density.
The noise power increases strongly at the crossover
and the characteristics of
the 1/fα noise change.
When the temperature is increased, the noise power decreases.
We compare these results
with recent noise measurements
in systems with two-dimensional metal-insulator transitions.
In the two-dimensional (2D)
metal-insulator transition (MIT) regime, both the
Coulomb interactions between electrons
and the disorder are expected to be strong,
leading to the formation of an electron glass [1,2].
Recent experiments in 2D electron systems have revealed
changes in the characteristics and the amplitude
of the conduction noise as the charge density of the system
is varied from a high charge density metallic phase to a
lower charge density insulating phase
[3,4,5]. This
has been interpreted as evidence for an onset of glassy
dynamics near the insulating phase.
These studies also find that the noise has
a 1/fα characteristic, with α = 1.0 in the metallic phase
changing over to
α ≈ 1.8 in the glassy phase.
Other experiments have found similar results with α = 0.75 in the
metallic phase and α = 1.3 near the insulating phase [6].
The glassy phase is signified by a large increase in the
noise power along with the change in α [3,4].
In addition, the noise power was observed to decrease
with temperature [4,5], in contrast to single electron models
with thermally activated trapping [7] and
other models [8]
that predict an increase in the noise power with T.
This suggests the importance of electron-electron
interactions at the MIT.
Other recent experiments
near the 2D MIT have also found
1/fα noise, strong increases in noise power with decreasing
charge density, and decreasing noise with increasing T [6,9].
Additionally, 1/fα noise fluctuations in thin granular films
have been interpreted as evidence for a glassy electron state
[10]. More recent experiments have provided evidence that the large
noise
is due to charge,
rather than spin, fluctuations [11].
In theoretical studies, it was proposed
that at the 2D MIT
a freezing from an electron liquid to
a partially ordered Wigner glass [12]
or a more strongly disordered electron glass [13] may occur.
Other theories suggest that an intermediate metallic glass phase
appears between the liquid and insulating phases [14].
It is also possible that the metallic
glass phase may consist of
solid phase insulating regions coexisting
with string-like liquid regions.
Studies of glassy systems
often find cooperative string-like motions or dynamical
heterogeneities [15].
Such motions can give rise to correlated dynamics
and large fluctuations near a glass transition.
It is, however, unclear what the origin of such
cooperativity would be in the electron glass systems.
The noise studies suggest that in the 2D electron systems
there is a crossover from a weakly
pinned liquid like region with low noise power to a
more strongly partially pinned state with high noise power.
This is
also consistent with the theoretical prediction that the electron liquid
freezes
into a 2D disordered solid.
In this work we propose a simple model for a classical 2D electron system
consisting of interacting electrons with random disorder and
temperature. We monitor the fluctuations and noise
characteristics of the
current as a function of electron density or temperature.
The advantage of our model is
that a large number of interacting electrons
can be conveniently simulated, while a
full quantum mechanical model of similar size would be computationally
prohibitive.
Despite the limitations of this model, we show that this approach
captures many of the key experimental observations.
Additionally, although our primary focus is to gain insight into the
physics near the 2D MIT, our model is also relevant for other
classical charge systems undergoing
crossovers from glass to liquid states, such as charged
colloids interacting with random disorder.
Our model is similar to previous studies of 2D classical
electron systems with disorder [16,17];
however, these previous studies focused
on the microscopics of the defects in the lattice [16]
or the sliding dynamics [17].
In the present work we focus on the
noise fluctuations in the strongly disordered phase as it
changes from a liquid to a frozen state
as a function of electron density
for a fixed amount of disorder.
Our model applies to the region of the
2D metal insulator transition where the
system starts to become insulating.
In this case, the electrons are becoming
occasionally trapped and act more classically.
Our model consists of a 2D system of Ns interacting
electrons
with periodic boundary conditions in the x and y-directions.
There are also Np defect sites which
attract the electrons. We assume the electron motion is at
finite temperature and the time evolution occurs through Langevin
dynamics. The damping on the electrons comes
from their interactions
with phonons or small scattering sites.
The equation of motion for an electron i is
ηv=fi=−
Ns ∑ j
∇U(rij) + fis + fiT + fd
(1)
Here η = 1 is the damping constant and Ui(r) = −q2/r,
with q=1, is the
electron-electron interaction potential, treated as in [18].
The term fis comes from the Np randomly spaced defect sites
modeled as
parabolic traps of radius rp=0.2 and strength fp = 1.0.
The
thermal noise fiT arises from random Langevin kicks
with
< fT(t) > = 0 and < fTi(t)fTj(t′) > = 2ηkBT δijδ(t − t′).
The driving term fd=fd∧x comes from an applied voltage,
and we take fd = 0.1.
We start at a high temperature where the charges are diffusing rapidly and cool
to a lower temperature.
We then wait for 104 simulation time
steps to reduce transient
effects before applying the drive and measuring the average velocity
v of the electrons, which is
proportional to the conductance or inversely proportional to the resistance.
We do this for a series of electron
densities at fixed disorder strength. We have considered samples
with constant pin densities np for different system sizes
such that Np ranges from 317 to 1200.
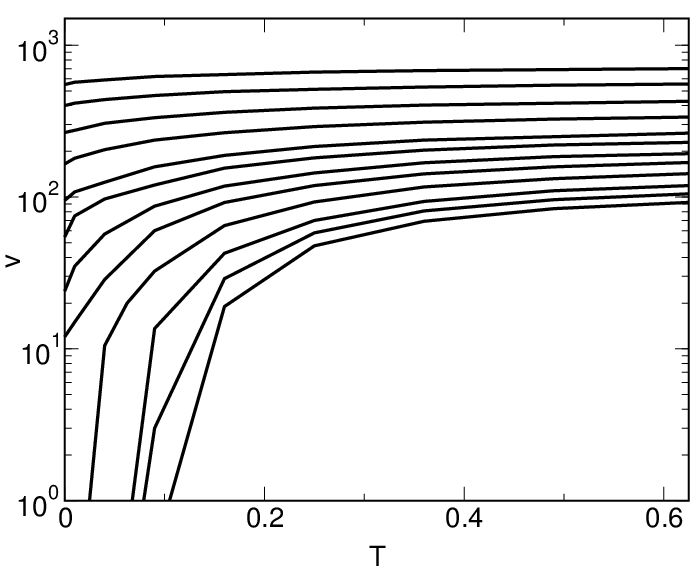
Figure 1:
The average electron velocity v vs T for
Ns/Np = 2.67, 2.13, 1.67, 1.33, 1.07,
0.94, 0.8, 0.7, 0.6, 0.5, 0.45, and 0.4, from
top to bottom.
We first consider the average
electron velocity
as a function of temperature and charge density
for a system with a fixed Np=1200.
In Fig. 1 we show a series of conductance curves vs T
for charge density varied over nearly an
order of magnitude, 0.4 ≤ Ns/Np ≤ 2.67.
For high Ns/Np > 0.6 the conductance is finite
down
to T = 0, while for Ns/Np ≤ 0.6,
the electron velocity drops
to zero within our resolution, indicating that all the electrons
are strongly pinned in an insulating phase.
As Ns/Np increases above 1.0, the
downward curvature of v at low T decreases.
These curves appear very similar
to those typically observed in
2D MIT studies [3]. One difference is that
we do not find a charge density nsup
above which the slope of the velocities
turns up slightly at low T, as in the experiments. This may be due to
the fact that in our model we do not directly include phonons.
In the experimental regime of interest to us here, the large
noise increases
occur at charge densities ns < nups, where the
velocity curves bend down at low T.
Figure 2:
The relative velocity fluctuations δv vs time
for the system in Fig. 1 for T = 0.09 at
Ns/Np = 0.5, 0.7, 1.05, 1.64, and
2.67, from bottom to top. The curves have been shifted up for clarity.
We next consider the relative fluctuations in the
velocities, δv(t)=(v(t) − < v > )
for varied Ns/Np at a fixed T = 0.09 for the system in Fig. 1.
This analysis is similar to that performed in experiments
[3,4,5].
In Fig. 2 we show the time traces of the relative
velocity fluctuations for Ns/Np = 0.5, 0.7, 1.05, 1.64 and 2.67.
Here the fluctuations increase as Ns drops,
in agreement with the experiments [3]. For
Ns/Np < 0.44, the system is pinned and there are no fluctuations.
It is possible that, over a longer time interval such as that accessible
experimentally, there would be
even larger fluctuations at these small Ns values; however, this is beyond
the time scale we can access with simulations.
A similar series of time traces can be obtained
for δv at fixed Ns/Np for increasing temperature (not shown).
Here the fluctuations are reduced at higher T,
in agreement with experiments [3].
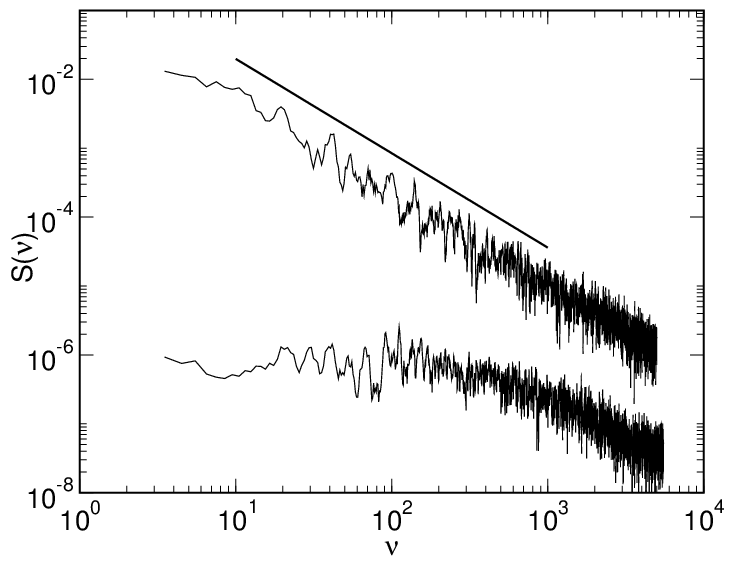
Figure 3: The power spectra S(ν) for the velocity fluctuations
δv(t)
at Ns/Np = 0.5 (upper curve) and Ns/Np = 1.67 (lower curve).
The solid line has slope α = 1.37.
From the fluctuations δv we measure the power spectrum
S(ν) =
⎢ ⎢
⌠ ⌡
δv(t)e−2πiνtdt
⎢ ⎢
2
.
(2)
In Fig. 3 we plot S(ν) for two different charge densities.
At Ns/Np = 0.5 (upper curve), the spectrum shows a
1/fα characteristic with α = 1.37 over a few
orders of
magnitude in the frequency.
In contrast, for Ns/Np = 1.67 (lower curve),
the noise power at lower frequencies is considerably reduced
and the spectra is white
with α ≈ 0. We note that it is the lower
frequencies which will be most
readily accessible in experiment.
For fixed Ns/Np = 0.5, we find that the power spectrum becomes
white upon increasing T.
We note that our results differ quantitatively from the experimental
noise measurements
[3] which find 1/fα noise
with α = 1.0 near the metallic phase and α = 1.8 in the
glassy regime.
Our exponent α = 1.37 is close to
the α = 1.3 found in the glassy regime in
other experiments [6], where α = 0.75 in the metallic regime.
It is possible that the exponents are not universal
but depend on the details of the disorder strength; nevertheless,
our results are
in qualitative agreement with the experiments.
Figure 4: (a) The integrated noise power S0 vs Ns/Np
for T = 0.09. Inset: The power spectrum exponent α vs
Ns/Np for T = 0.09. (b) S0 vs T for
Ns/Np = 0.5. Inset: α vs T for
fixed Ns/Np=0.5.
In Fig. 4(a) we show the noise power S0 integrated over the
first octave vs Ns/Np for a fixed
T = 0.09. The noise power increases by four orders of
magnitude as Ns/Np is reduced.
At low Ns/Np, the noise power decreases almost
exponentially with charge density and begins to saturate
at high Ns/Np.
Both these observations are in agreement with
the experimental results [4,5]. Here our definition
differs by a factor of 1/ < v > 2 from the noise measured in
the experiment; this does not affect α but would further
enhance the increase in noise power at low density and temperature
where < v > approaches zero.
In the inset of Fig. 4(a) we plot the noise spectrum exponent
α vs Ns/Np.
A large increase in α occurs near Ns/Np = 0.7.
A similar sharp increase in the
exponent is also observed in experiments
[4,5,6] as a function of charge density and has been
interpreted
as the glassy freezing of
electrons.
In Fig. 4(b) we plot S0 vs T for fixed Ns/Np = 0.5.
Here the noise power drops exponentially over four orders
of magnitude with increasing T,
which is in agreement with the experiments [4,5].
We note that most single electron models predict
an increase in the noise power with temperature [7,8].
In the hopping regime [19], another model predicts noise power
that increases with T [20],
although a more recent variable range hopping model predicts a decrease
in the noise power as a function of T [21].
These discrepancies
suggest that the noise in the experiment is not due to
single electron hopping events, but is instead
caused by correlated electron motions.
In the inset of Fig. 4(b) we plot α vs T, where a sharp
increase in α occurs near T = 0.125 at the onset of the
glassy freezing.
We have also measured the non-Gaussian nature of the
noise. At high Ns and T the noise fluctuations are
Gaussian; however, in the regions of high noise power we find
non-Gaussian noise fluctuations with a skewed distribution.
Experiments have also found evidence for non-Gaussian fluctuations
in the glassy regimes [5].
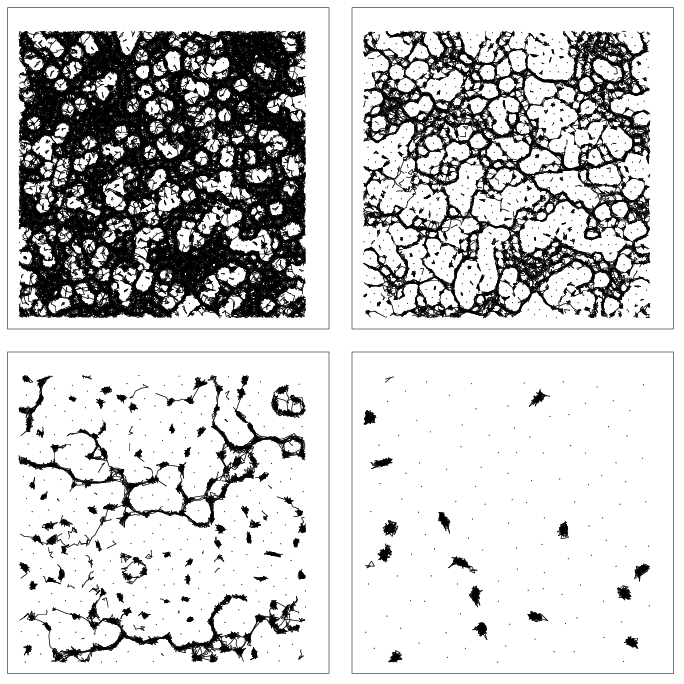
Figure 5: Electron trajectories for a fixed period of time for fixed
T = 0.09 at (a)Ns/Np = 1.67, (b) 1.37, (c)0.5,
and (d) 0.3.
Next we show evidence that the large noise is due to correlated regions
of string like electron flow, and that within
these regions the electrons move in 1D or quasi 1D channels.
Because of the reduced dimensionality
the
electron motion is more correlated.
In Fig. 5(a) we show the trajectories of the electrons for a fixed period
of time for a system with T = 0.09 at Ns/Np = 1.67. Here
the electrons can flow freely throughout the sample, although there are some
areas where electrons become temporarily trapped by a defect site.
In Fig. 5(b) at Ns/Np = 1.37,
where the noise power is larger than in the system shown in Fig. 5(a),
larger pinned regions appear and the electron motion consists of a mixture of
2D and 1D regions. If the trajectories are followed over
longer times,
motion occurs throughout the entire sample.
In Fig. 5(c) at
Ns/Np = 0.5, where the noise power
and α are both maximum,
the electron motion occurs mostly in the form
of 1D channels that percolate through the sample.
There are also regions where the electron motion
occurs in small rings.
The channel structures change very slowly with time, with
a channel occasionally shutting off while another emerges
elsewhere. It is the intermittent opening of the 1D channels
which gives rise to the large noise fluctuations in this regime.
When a percolating 1D channel opens,
all the electrons in that channel move in
a correlated fashion leading to a large increase in the conduction.
Conversely,
if a percolating channel closes all the electrons
in that channel cease to move. It is well known that
fluctuations in 1D are much more strongly enhanced than in 2D. As
T or Ns is increased,
the motion
becomes increasingly 2D in nature and the strong correlations
of the electron motion are lost.
We also note that the appearance of string like motions in the large
noise regions is consistent with studies in glassy systems,
where dynamical heterogeneities in the
form of 1D stringlike motions of particles have been observed
in conjunction with large noise [15].
In Fig. 5(d) at Ns/Np = 0.3, deep in the insulating regime,
there are no channels. Instead, the
infrequent motion of electrons occurs only by small jumps from defect
to defect
It is beyond the scope of this paper to determine whether there is
a true phase transition associated with the onset of the glassy behavior,
or simply a crossover which could be kinetic in nature. This is an
open question within the glassy systems in general. However, since
our system is 2D and no power law divergences occur, it
is more likely that the onset of the large noise is associated with
a crossover in the dynamics of the channels.
In conclusion, we have presented a simple model for
the glassy freezing of interacting electrons
in 2D with random disorder.
For high electron density or high temperatures, the electrons form a
2D liquid state and we find
low conduction noise power with a white spectra.
As the density of the electrons is lowered
for fixed temperature, or conversely, as
the temperature is lowered for fixed low electron density, there is a
crossover to a 1/fα noise
with large low frequency power and α = 1.37.
In this glassy regime, the electrons move in 1D intermittent
stringlike paths which percolate throughout the sample.
Similar stringlike motions are also observed in other glass forming systems.
For low electron density, all the electrons are frozen by the defect sites
and the motion occurs only by single electron hopping events.
We find that the noise
power decreases exponentially with temperature, in agreement with
experiment. Many of our results are in qualitative agreement with recent
experiments on 2D electron systems near the metal insulator transition.
This work was supported by the US DoE under Contract No. W-7405-ENG-36.