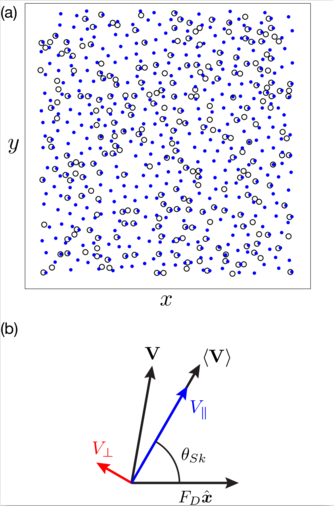
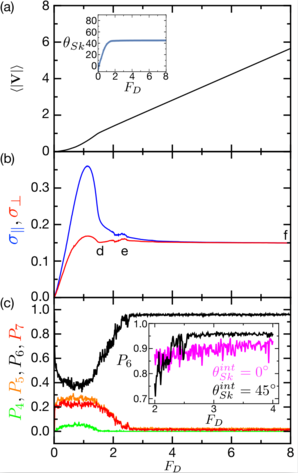
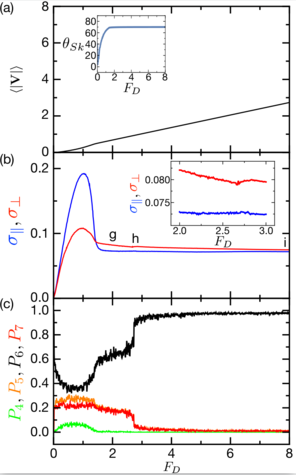
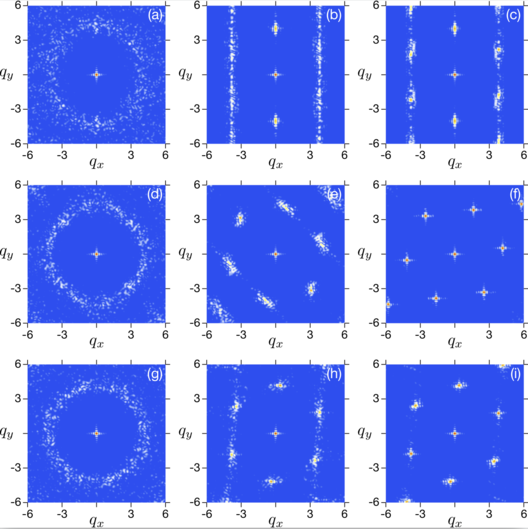
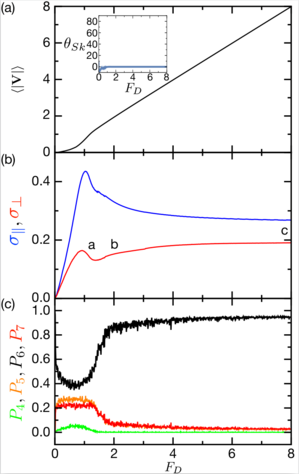
 Figure 2:
Results from the overdamped limit αm=0 with θintSk = 0°.
(a) Magnitude of the time-averaged velocity
〈|V|〉 vs
driving force FD. The inset shows θSk vs FD, where
there is no driving force dependence and θSk = 0°.
(b) Standard deviation σ|| (upper blue curve) and
σ⊥ (lower red curve) of the parallel and
perpendicular instantaneous velocity, respectively,
vs FD showing a strong anisotropy. The labels a, b, and c indicate the values of
FD at which the structure factors in Fig. 5(a,b,c)
were obtained.
(c) P4 (lower green curve), P5 (central light orange curve),
P6 (upper black curve), and P7 (central dark red curve),
the fraction of 4-, 5-, 6-, and 7-fold coordinated
particles, respectively, vs FD
showing a transition to an ordered state near FD = 2.0.
|
