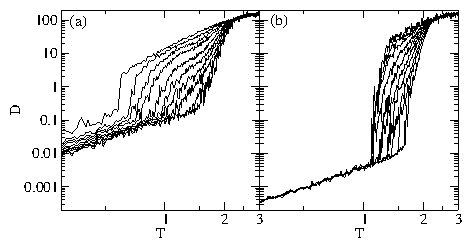
Physical Review E 73, 061401 (2006)

Heterogeneities and Topological Defects in Two-Dimensional Pinned Liquids

J.-X. Lin1,2, C. Reichhardt1, Z. Nussinov1,3, Leonid P. Pryadko2, and C.J. Olson Reichhardt1

1Center for Nonlinear Studies and Theoretical Division, Los Alamos National Laboratory, Los Alamos, New Mexico 87545, USA
2Department of Physics, University of California, Riverside, California 92521, USA
3Department of Physics, Washington University, St. Louis, Missouri 63130, USA

(Received 5 January 2006; published 2 June 2006)

We simulate a model of repulsively interacting colloids on a commensurate two-dimensional triangular pinning substrate where the amount of heterogeneous motion that appears at melting can be controlled systematically by turning off a fraction of the pinning sites. We correlate the amount of heterogeneous motion with the average topological defect number, time dependent defect fluctuations, colloid diffusion, and the form of the van Hove correlation function. When the pinning sites are all off or all on, the melting occurs in a single step. When a fraction of the sites are turned off, the melting becomes considerably broadened and signatures of a two-step melting process appear. The noise power associated with fluctuations in the number of topological defects reaches a maximum when half of the pinning sites are removed, and the noise spectrum has a pronounced 1/fα structure in the heterogeneous regime. We find that regions of high mobility are associated with regions of high dislocation densities.
I. INTRODUCTION
II. NUMERICAL SIMULATION METHOD AND PARAMETERS
III. TOPOLOGICAL DEFECTS AND NOISE
A. Defect Density and Melting
B. Fluctuations in the Defect Density and Noise
C. Effect of Substrate Strength
IV. DIFFUSION MEASURES
A. Average Diffusion Coefficient
B. van Hove correlation function
V. CONCLUSION
References


I.  INTRODUCTION

Glassy and liquid assemblies of particles in two and three dimensions have been shown to exhibit dynamical heterogeneities, where the motion of the particles is not uniform but occurs in correlated strings in certain regions, while other regions are less mobile [1,2,3]. Numerous numerical simulations have found evidence of dynamical heterogeneities near the glass transition [4]. Direct observations of correlated regions of motion have been obtained in imaging experiments on three-dimensional (3D) colloidal assemblies as the system approaches a glassy phase [5,6], and nonuniform motion has been found in polymer melts [7,8,9]. Heterogeneous motion has also been observed directly for systems that do not form a glassy phase but that can have a dense liquid region near crystallization, including 2D colloids [10] and dusty plasmas [11,12].
In recent work on 2D systems of repulsive colloids or vortices which form a triangular lattice crystalline phase, it was shown that at temperatures just above the melting transition, topological defects in the form of dislocations undergo correlated annihilation and creation, giving rise to a 1/fα noise signal in the time dependent dislocation density [13]. The 1/f noise also coincides with the appearance of dynamical heterogeneities. At higher temperatures, the dynamical heterogeneities disappear and the noise spectrum of the fluctuating topological defect density becomes white, indicating the loss of correlations. The same system has been studied in the case where the particles are quenched from a high temperature liquid phase where there is a high density of dislocations to a low temperature phase where the ground state is a triangular lattice. In the low temperature regime the dislocations created in the quench annihilate over time. The particle motion in this annihilation process occurs in the form of string like jumps [13]. This result suggests that the dynamical heterogeneities are directly correlated with the motion, creation, and annihilation of topological defects. Further evidence that in 2D the topological defects are associated with dynamical heterogeneities has also been reported in the recent experiments of Dullens and Kegel on 2D colloidal suspensions, where the non-sixfold-coordinated colloids were more mobile than sixfold-coordinated colloids [14].
In a related class of systems, glassiness does not arise solely from the particle interactions but instead occurs due to coupling with an underlying quenched substrate. It has already been shown in 2D systems of classical electrons in the presence of quenched disorder that the particle motion occurs in string-like dynamical structures where a chain of particles moves past other particles that are pinned [15]. These motions are very similar to the string-like dynamical heterogeneities observed in systems without quenched disorder. It is important to note, however, that in Ref. [15], where the disorder was simulated as a collection of randomly located pins, the quenched disorder had a tendency to create topological defects even at very low temperatures [16]. Therefore, the connection between the dynamical heterogeneities and the topological defects was not immediately apparent, and it would be desirable to identify a system in which the amount of heterogeneous motion could be controlled systematically.
In this work, we propose a model of repulsively interacting particles on a substrate in which the disorder potential is perfectly commensurate with the triangular crystal and therefore does not favor the creation of topological defects. Specifically, we study colloidal particles interacting via a screened Coulomb repulsion in the presence of a triangular pinning substrate where the number of colloids is commensurate with the number of pinning sites. We introduce disorder by shutting off a specified fraction of randomly selected pinning sites. The crystal phase is stabilized in regions of the system that contain a locally large density of active pins. As the temperature is increased, the melting occurs first in regions with higher densities of nonactive pinning sites.
The system we consider can be realized experimentally for colloids interacting with periodic arrays of optical traps [17,18,19,20,21,22,23]. The melting of charged colloids interacting with triangular and square pinning arrays has already been studied experimentally [18,19] and in numerical simulations [20]. Experimental evidence for a coexistence of a liquid and a solid has been obtained in a system where colloids located at pinning sites remain immobile while colloids in the unpinned interstitial regions are mobile [19]. Related systems that can be modeled as repulsive particles interacting with a periodic substrate include vortices in superconductors with artificial pinning sites [24,25] and vortices in Bose-Einstein condensates interacting with optical traps [26].

II.  NUMERICAL SIMULATION METHOD AND PARAMETERS

We model a 2D system of a monodisperse assembly of N colloids using a Brownian dynamics simulation with periodic boundary conditions in the x and y directions. The equations of motion for the colloidal particles are overdamped and we neglect hydrodynamic interactions, which is a reasonable assumption for charged particles in the low volume fraction limit. In particular, we assume that the colloid-colloid interaction potential is soft and that the inverse screening length κ and the physical colloid radius R satisfy κR  ∼ 1, as in recent experiments [27,28,29]. A single colloid i obeys the overdamped equation of motion
η dRi

dt
= Ficc + FTi + Fsi
(1)
Here η is the damping constant which is set to unity. The colloid-colloid interaction force is Ficc = −qiNiji V(rij), where the colloid-colloid interaction potential is a screened Coulomb interaction of the form
V(rij) = (qj/|rirj|)exp(−κ|rirj|).
(2)
Here qj(i) is the charge on particle j(i), κ is the inverse screening length which is set to 3/a, and ri(j) is the position of particle i(j). Energy is measured in units of E0=q2/(4πϵϵ0 a) and forces in units of E0/a. Throughout this study the density of colloids is kept fixed at nc = 1.0 which gives a colloid lattice constant of a = 1.0. We also fix the system size to L=24. Because the colloid-colloid interaction is screened, at long distances the force between two colloids is negligible; thus, we place a cutoff on the interaction at 5a. For larger cutoffs we find no change in the results. The thermal force FT is modeled as random Langevin kicks with the properties 〈FTi〉 = 0 and 〈FT(t)FT(t)〉 = 2πηkBTδ(tt). The pinning comes from the substrate force Fsi. The pinning sites are modeled as parabolic traps of radius rp=0.2 and maximum strength fp=2.0 which are placed in a triangular array with lattice constant a, commensurate with the colloidal lattice. As an initial condition, each colloid is placed inside a pinning site. We turn off some of the pins by setting fp=0 at some sites, keeping fp finite at a fraction np of randomly chosen "active" pinning sites. We gradually increase the temperature up to 4.0 in increments of 0.01. The melting transition is identified by examining the density of topological defects and the diffusion. A clean system with all the pinning turned off melts at T = 0.6.
Fig1.png
Figure 1: Location of the pinning sites (circles) and colloids (black dots). Large dark circles indicate pinning sites with a finite fp while small gray circles indicate pins that have been shut off by setting fp = 0.0. In this image, the fraction of sites with finite fp is np = 0.5.
Fig2.png
Figure 2: (a) The fraction of colloids with six-fold coordination number P6 vs T for various np. From right to left, np = 1.0, 0.9, 0.8, 0.7, 0.6, 0.5, 0.4, 0.3, 0.2, 0.1, and 0. (b) The corresponding dP6/dT curves for three representative pinning fractions: np=0.1 (left curve), 0.5 (center dark curve), and 0.9 (right curve).

III.  TOPOLOGICAL DEFECTS AND NOISE

A.  Defect Density and Melting

In Fig. 1 we illustrate a system with np=0.5 where we have turned off half of the pinning sites by setting fp=0 at these sites. At T = 0 the colloids form a triangular lattice that is commensurate with the substrate. To determine the melting behavior as a function of temperature we measure the density of sixfold coordinated particles P6 using a Voronoi or Wigner-Seitz construction. For a perfectly triangular lattice, P6 = 1.0. Topological defects such as dislocations produce 5− and 7−fold coordinated particles. In Fig. 2(a) we plot P6 vs T for systems with varied pinning fractions of np = 0 (no pins active) to 1.0 (all pins active). When thermally induced defects begin to appear, P6 drops. As np increases, the drop in P6 shifts to higher temperatures. The sharpest drop in P6 occurs at np = 0 where none of the pins are active. The drop becomes steeper again as np approaches 1 where all the pins are active. For intermediate pinning fractions the drop in P6 is broadened. At high temperatures T > 2.5, all of the P6 curves come together near a value of P6 = 0.4.
In Fig. 2(b) we plot the derivatives of three representative curves from Fig. 2(a). For np < 0.4, there is one dip in dP6/dT near T = 0.65 associated with the onset of dislocations among the colloids in the unpinned regions. This dip shifts toward slightly higher temperatures as np increases. For np > 0.75, there is still a single dip in dP6/dT but it falls near the considerably higher temperature of T=1.75. This dip corresponds to the onset of dislocations in the pinned regions, and its location shifts toward T=2 as np increases to 1. For intermediate pinning fractions 0.4 < np < 0.75, there is a very broad minimum in dP6/dT which spans the temperature range between the dips seen at high and low pinning fractions. In this regime, both the pinned and unpinned particles play an important role in the melting process. For higher temperatures T > 2.5, all of the dP6/dT curves merge.
The data in Fig. 2(b) indicate that there are two characteristic disordering regimes. The first coincides with the temperature at which the particles located in the unpinned regions effectively melt, and the second corresponds to the temperature at which the particles in the pinned regions melt. From the curves in Fig. 2 the width of each melting transition can be determined by measuring the distance from the beginning of the dip in dP6/dT to the temperature where dP6/dT begins to saturate. In Fig. 3 we plot the melting width vs np, showing that the width reaches a maximum value at np = 0.5. The width is smaller for np = 1.0 than for the unpinned case of np = 0.
Fig3.png
Figure 3: The width of the melting curve versus pinning fraction np obtained for the system in Fig. 2.
Fig4.png
Figure 4: (a) Colloidal trajectories (black lines) and colloidal positions (black dots) over a fixed period of time in a system with np = 0.5 at T = 1.5. (b) Voronoi plot of the system in (a) for a single frame. Small black dots indicate sixfold-coordinated particles while large black dots indicate particles with coordination numbers other than six. (c) Time-averaged dislocation probability plot. Larger circles indicate sites that are frequently nonsixfold coordinated, while smaller circles indicate sites that are nearly always sixfold coordinated.
Fig5.png
Figure 5: Colloidal trajectories (black lines) and positions (black dots) for a system at fixed T = 1.5 for (a) np = 0.2 and (b) np = 0.8.
The system at np = 0.5 and T = 1.5 can be regarded as a mixture of a solid pinned phase and a liquid phase, and thus the motion and diffusion of particles is highly heterogeneous. At np = 0 and T=1.5 in Fig. 2(a), P6=0.5, indicating that at this temperature the system is in a strongly disordered liquid state. For the same T=1.5 at np = 1.0, P6 = 1.0, indicating that the system is a completely triangular solid. In contrast, for np = 0.5 at T = 1.5, P6 = 0.75. In this case, it would be expected that the colloids located at pinning sites that have been turned off should have a liquid like behavior, while the colloids at the active pinning sites should behave like a solid. The dislocations and fluctuations in the dislocation density should then be associated with the liquidlike unpinned regions.
In Fig. 4(a) we plot the colloid trajectories (black lines) and colloidal positions (black dots) for a fixed period of time for a system with np = 0.5 and T = 1.5, showing a highly heterogeneous motion of particles in correlated groups where the pinning is deactivated. In Fig. 4(b) we illustrate the corresponding Voronoi construction for a single frame indicating the locations of the topological defects as nonsixfold coordinated particles. In general, the dislocations are located in the same regions where the correlated particle motions are occurring. To illustrate this more clearly, in Fig. 4(c) we plot the time-averaged dislocation density. Portions of the sample where defects occur more frequently are indicated with circles of larger size.
The amount of heterogeneous motion that appears depends on both the pinning fraction np and the temperature. In general, for high temperatures at all pinning fractions, the motion is homogeneous and the defect density is high. In Fig. 5(a) we show the trajectories for the case of np = 0.2 at T=1.5 where the system is mostly in the liquid state with a small number of pinned colloids. In Fig. 5(b) we plot the trajectories for the same temperature at np = 0.8, where most of the system is pinned and a small number of colloids show extra motion at their sites but do not change neighbors. We note that, for any pinning fraction, exchange between the populations of pinned and unpinned particles below the melting temperature for the pinned particles is not forbidden but is extremely rare, and it does not occur on the time scales we are able to simulate.
Fig6.png
Figure 6: Time series of the fraction of colloids with six-fold coordination, P6, for a system with np = 0.5. Top curve, T = 1.5; lower curve, T = 4.0.
Fig7.png
Figure 7: Power spectrum S(f) for the same system in Fig. 6 at (a) T = 1.5 and (b) T = 4.0.

B.  Fluctuations in the Defect Density and Noise

We next consider how the pinning fraction affects the time dependent fluctuations of topological defect density. In Fig. 6 we plot the time series of the density of six-fold coordinated particles, P6(t), in a system with np=0.5 for T = 1.5 (upper curve) and T = 4.0 (lower curve). For T = 4.0, the system is strongly disordered with 〈P6〉 = 0.36, while at T = 1.5 the system is in the heterogeneous phase and P6 varies from 0.86 to 0.68. The fluctuations in the defect density are much more rapid for T = 4.0 than at T = 1.5. For much longer time series at T=1.5, there are additional long time fluctuations with P6 rising as high as 0.9 on occasion. In order to quantify the fluctuations in the defect density, we compute the power spectrum of the time series,
S(f) =

P6(t)e−2πif tdt
2
 
.
(3)
The noise power S0=∫f1f2dfS(f) is the value of S(f) averaged over a specific frequency octave [30]. Fig. 7(a) shows S(f) for T = 1.5 where a clear 1/fα signal appears with α = 1.45. In Fig. 7(b) we plot S(f) for the same system at T = 4.0 where the noise spectrum is closer to white with α = 0.1. For intermediate temperatures α gradually changes from 1.45 to 0.1 or a white spectrum, indicating that there is little or no correlation in the defect fluctuations at the higher temperatures. We note that for the case where there is no pinning, previous studies found dynamical heterogeneities occurring just above the melting transition [13]. In these studies, similar 1/fα dislocation density noise appeared in this regime; however, the value of α had a maximum of 1.0. The larger value of α that we observe here implies that for the pinned system, there are stronger correlations in the annihilation and creation of the dislocations compared to the unpinned system. In Fig. 8 we plot the noise power S0 vs T for systems with np = 0 (squares) and np = 0.5 (circles). The clean system shows a maximum noise power at T = 0.75 and then a slow drop in noise power for higher temperatures as observed in previous simulations [13]. For the case of np=0.5, the noise power begins to increase near T = 1.0 and reaches a much higher maximum near T = 1.8 before decreasing at higher temperatures. The noise power for the different pinning fractions becomes equal near T = 2.5, which is also the temperature at which the dP6/dT curves merge in Fig. 2(b). For higher pinning fractions, the peak in the noise power shifts to higher T and there is a slight decrease in the maximum value of the noise power. Although the width of the noise power peak is broadened for the np = 0.5 case compared to the np=0 case, we do not observe two peaks, which would be indicative of two melting transitions.
Fig8.png
Figure 8: Noise power S0 vs T for a system with np = 0.0 (squares) and np = 0.5 (circles).
In Fig. 9 we show how α evolves as a function of temperature for a system with np = 0.5 as obtained from the power spectrum. The peak value of α occurs at a temperature of T = 1.5 which also corresponds to the peak in the noise power S0 in Fig. 8. As T increases, there is a slow fall off to a white noise spectrum with α ≈ 0 at T = 4.0. This result shows that in the regime where the motion is highly heterogeneous, the noise spectrum is broad, indicating correlations in the creation and destruction of the topological defects. At the high temperatures where the motion is uniform, the correlation in the noise spectrum is lost.
Fig9.png
Figure 9: The exponent α, obtained from the power spectrum, vs T for the same system in Fig. 6 with np = 0.5.
Fig10.png
Figure 10: Diagram of the different regimes for T vs pinning strength fp at fixed np = 0.5. Circles indicate the onset of the first topological defects. Squares show the temperature at which P6 first passes below 0.5.

C.  Effect of Substrate Strength

We next consider the effects of varying the pinning strength of the substrate. In the previous analysis the pinning strength was fixed at fp = 2.0 so that there was a clear distinction between the melting of the pinned species and of the unpinned species. When fp is varied, the width of the heterogeneous regime as a function of T can be increased or decreased. We perform a series of simulations with fixed np = 0.5 and varied fp. In Fig. 10 we plot the temperature at which the system enters the liquid phase (squares) vs fp. This transition is defined as the point where P6 drops to a value of 0.5. We also plot the temperature at which the first topological defects appear (circles) vs fp. For fp > 0.4, the temperature at which defects first appear saturates at T ≈ 1.14, while the transition into the liquid phase shifts to higher temperatures with increasing fp. The saturation of the dislocation onset line delineates the crossover to the strong pinning limit, and indicates that even though the pinning strength is increasing, the particles located in the non-pinned regions melt at a constant temperature. The melting of the non-pinned species occurs when the thermal motion is strong enough to overcome the repulsive colloid-colloid interaction force. Since the colloid interaction strength is not changing as a function of fp, the unpinned colloid melting temperature saturates. The colloids located at active pinning sites can only melt when the thermal fluctuations are strong enough to enable the particles to hop out of the pinning sites. As fp is increased, the activated hopping temperature also increases. For fp < 0.4, in the weak pinning regime, the melting does not occur in a two step fashion but instead occurs in a single step, similar to the case of fp = 0.0. At fp = 0.0 there is still a finite window of temperature falling between the onset of dislocations and the saturation of P6. In this case, the motion can still be heterogeneous, as has been previously studied; however, the dynamical heterogeneities for fp=0 are not located at specified regions but are moving over time so that all the particles take part in the motion over long times [13]. This is in contrast with the finite fp case where, due to the existence of pinning sites, only certain particles take part in the motion.
An interesting effect indicated by Fig. 10 is that, up to fp = 0.4, pinning can effectively increase the melting temperature of the entire lattice by up to ∆T = 0.3, while for fp > 0.4, the two step melting scenario occurs. This increase in melting temperature for weak pinning occurs since even at np = 0.5, the triangular colloidal lattice is still commensurate with the triangular substrate. The thermal fluctuations that the colloids experience originate both from the applied thermal Langevin force and also from the disordered motion of the surrounding colloids. Since the colloids that are at the pinning sites are more constrained, they fluctuate less than unpinned colloids. This leads to an overall reduced fluctuating force on all the colloids and results in an increase of the melting temperature. Once the first dislocations appear, the pinning in this regime is not strong enough to create the two step melting found above fp=0.4.

IV.  DIFFUSION MEASURES

A.  Average Diffusion Coefficient

We next consider diffusive measures. We calculate the distance traveled by the colloids during a fixed period of time δt=t1t0. The diffusion is given by D = (r(t1) − r(t0))2t for fixed δt. Based on the initial colloid positions, we can distinguish between the initially pinned and initially unpinned colloids, and we measure the diffusion of the two species separately. In Fig. 11(a) we plot D vs T for a system with fp = 2.0 and varied np for the colloids that were initially placed in sites that had fp=0. In Fig. 11(b) we plot D for the same system in Fig. 11(a) for the particles that were initially placed at active pinning sites. For the unpinned colloids in Fig. 11(a), for np = 0.0 at low temperatures up to T = 0.6, there is an initial increase of D with increasing T. This is due to the fact that the thermal forces cause the colloids to rattle inside the caging potential created by the interactions with the other colloids; however, the system maintains triangular ordering and the particles do not hop out of their initial locations. There is a subsequent sharper increase in D for T > 0.6 when the system melts and topological defects proliferate. Above the melting transition, D continues to increase with T as the particle can move a greater distance during δt at the higher temperatures. For higher values of np in Fig. 11(a), the initial values of D for T < 0.6 are monotonically shifted down, indicating that the pinned colloids are exerting a stronger confining force on the unpinned colloids. As np is increased, the sharp increase in D denoting the melting of the unpinned particles is shifted to higher T, consistent with the measurements of P6 from Fig. 2. This jump broadens as np increases. For pinning fractions of np = 0.3 to 0.7, D shows a plateau like feature followed by an additional smaller increase at a higher temperature which corresponds to the temperature at which the particles in the pinning sites melt. The derivative of dD/dT shows a single peak at np = 0.0 and 0.9 and two peak like features around np = 0.5. The plateaulike feature in D at intermediate pinning fractions occurs because even though the unpinned particles have melted, their motion is confined to the regions where there is no pinning. This limits the magnitude of the long time diffusion. Once the colloids at the pinning sites also melt, the unpinned colloids are no longer confined and can diffuse freely. At higher temperatures all of the diffusion curves come together.
Fig11.png
Figure 11: (a) Diffusion D of the initially unpinned particles vs T for a system with fp = 2.0 and np = (left) 0, 0.1, 0.2, 0.3, 0.4, 0.5, 0.6, 0.7, 0.8, and 0.9 (right). (b) D vs T for the same system in (a) for the initially pinned colloids at np = (left) 0.1, 0.2, 0.3, 0.4, 0.5, 0.6, 0.7, 0.8, 0.9, and 1.0 (right).
Figure 11(b) illustrates D vs T for the colloids that were initially placed in active pinning sites. There is an initial slow increase in D for T < 1.0 which is similar to the slow increase seen in Fig. 11(a). In this case D for the pinned colloids has a much smaller value than D for the unpinned colloids. This is due to the confining force exerted by the pinning wells on the pinned colloids. For np = 0.1, the colloids at the pinning sites only begin to jump out of the wells at T > 1.0, in contrast to the case in Fig. 11(a) where the jump in diffusion for the unpinned particles occurs at much lower temperatures. As np increases, the temperature at which the diffusion of pinned colloids begins also increases. This indicates that the motion of the unpinned particles affects the melting of the pinned particles by providing an extra effective thermal noise. We note that pinned colloids located near regions of unpinned colloids do not experience the same fluctuating interaction force as pinned colloids that are surrounded mostly by pinned colloids. At high temperatures, all of the curves in Fig. 11(b) come together to the same value, as was the case for Fig. 11(a).
Fig12.png
Figure 12: Open circles: Temperature at which the diffusion noticeably increases for the unpinned colloids from Fig. 11(a). Black squares: Temperature at which the diffusion noticeably increases for the pinned colloids from Fig. 11(b). Dashed lines are linear fits which both have the same slope.
In Fig. 12 we plot the temperature at which the diffusion noticeably increases for the pinned particles (black squares) and the unpinned particles (open circles) vs np. The temperature at which the unpinned colloids begin to diffuse significantly is lower than the temperature at which the pinned particles begin to diffuse. The diffusion onset temperature for the unpinned colloids increases linearly with np up to np=0.75. For np > 0.75, the diffusion onset temperature jumps to a value close to the diffusion onset temperature for the pinned colloids. This is due to the fact that for np > 0.75 most of the colloids at unpinned sites are completely surrounded by pinned colloids, and the time scale for an unpinned colloid to hop to another site becomes much longer.
For the pinned particles, the diffusion onset temperature also increases linearly with np for np > 0.4. For np < 0.4 the diffusion onset temperature remains fixed at a constant value. We note that for the lower pinning fractions, the pinned colloids are mostly surrounded by unpinned colloids. The region in which a clearly defined two-step melting transition occurs is 0.4 < np < 0.75, which is consistent with the values of np at which two peaks occur in dP6/dT and dD/dT.

B.  van Hove correlation function

Another measure used to identify and analyze dynamical heterogeneities is the self part of the van Hove correlation function G. This measure gives the probability distribution that a particle has moved a distance r during a fixed time interval t:
G(r,t) = N−1 
 
N

i = 1 
δ\biglb(rri(0) + ri(t)\bigrb) 
 
.
(4)
Systems with dynamical heterogeneity have non-Gaussian average velocity distributions. Experimental studies have shown that in a liquid state without dynamical heterogeneities, this measure produces a single Gaussian fit. In the heterogeneous phase, there is extra weight at larger distances and a double Gaussian fit can be used [14]. The Gaussian distribution for the short distances can be interpreted as corresponding to slow particles that are located in regions with low mobility, while the second wider Gaussian distribution that fits the larger distances corresponds to faster particles located in regions with higher mobility.
Fig13.png
Figure 13: The self part of the van Hove correlation distribution function for the x direction for fp = 2.0, T=1.0, and (a) np = 0.0, (b) np = 0.5, (c) np = 0.1, and (d) np = 0.9.
In Fig. 13(a) we plot the self part of the van Hove correlation function G computed along the x direction for a system with np = 0.0 and T = 1.0. This system is in the liquid state, since the initial disordering temperature for np=0 occurs at T = 0.6. Here, we find a single Gaussian distribution, indicating isotropic transport. In Fig. 13(b) we show G for T = 1.0 and np = 0.5, where the system is in the heterogeneous regime. Two features appear. There is a peak near x = 0.0 which corresponds to a group of particles that are much less mobile during the time frame of the measurement. These are the colloids located at the pinning sites, which undergo only a small amount of motion within the pinning sites, producing a peak in G with very narrow width. Superimposed on this narrow peak is a second, wider Gaussian distribution that corresponds to the colloids in the liquidlike regions which can travel a much larger distance. We plot G for T=1.0 and np=0.1 in Fig. 13(c). There is a much smaller narrow peak at x = 0, consistent with the fact that a much smaller fraction of the colloids is pinned and thus fewer colloids have low mobility. In Fig. 13(d) we show the case for np = 0.9 at the same temperature, where the peak at x = 0.0 is high and the wide part of the distribution is smaller. For all np at T > 3.0, the distribution function appears very similar to the one shown in Fig. 13(a), with increased width.

V.  CONCLUSION

We have studied the dynamic and topological heterogeneities in a 2D system of interacting particles with pinning. The number of colloids is fixed and is commensurate with a triangular pinning substrate. By shutting off a fraction of the pinning sites randomly, we can control the amount of heterogeneous motion. For sufficiently strong pinning, there can be a two step melting process in which the colloids in the unpinned regions melt first followed by the colloids in the pinned regions. The two step melting appears as a double peak in the derivative of the density of six-fold coordinated particles. The motion at temperatures between the two melting transitions is heterogeneous, and the topological defects are associated with the more mobile unpinned regions. The creation and annihilation of the topological defects in the mixed liquid-solid phase shows a prominent 1/fα power spectrum. The noise power reaches a much higher value in the mixed phase than in a system with no pinning. For weaker disorder, the two step melting is lost. Signatures of the heterogeneous motion can also be observed in the van Hove correlation function, which is composed of two overlapping Gaussian distributions. In the high temperature homogeneous phase, only a single Gaussian distribution appears. Our results suggest that the dynamically heterogeneous regions in which the colloids are more mobile may be associated with regions that contain a larger number of topological defects and which are locally molten. We also predict that the temporal fluctuations of the density of defects in regions that show dynamical heterogeneities will have a 1/fα noise signature, and that at higher temperatures where the heterogeneities are lost, the system will have a white noise spectrum. This is the first study of dynamical heterogeneities in a system with quenched disorder.
We thank M. Dykman for helpful discussions. This work was supported by the U.S. DoE under Contract No. W-7405-ENG-36.

References

[1]
H. Sillescu, J. Non-Cryst. Solids 243, 81 (1999).
[2]
M.D. Ediger, Ann. Rev. Phys. Chem. 51, 99 (2000).
[3]
R. Richert, J. Phys.: Condens. Mat. 14, R703 (2002).
[4]
W. Kob, C. Donati, S.J. Plimpton, P.H. Poole, and S.C. Glotzer, Phys. Rev. Lett. 79, 2827 (1997); C. Donati, J.F. Douglas, W. Kob, S.J. Plimpton, P.H. Poole, and S.C. Glotzer, ibid, 80, 2338 (1998); S.C. Glotzer, J. Non-Cryst. Solids 274, 342 (2000); Y. Gebremichael, T.B. Schroder, F.W. Starr, and S.C. Glotzer, Phys. Rev. E 64, 051503 (2001).
[5]
W.K. Kegel and A. van Blaaderen, Science 287, 290 (2000).
[6]
E.R. Weeks, J.C. Crocker, A.C. Levitt, A. Schofield, and D.A. Weitz, Science 287, 627 (2000).
[7]
E.V. Russell and N.E. Israeloff, Nature 408, 695 (2000).
[8]
L.A. Deschenes and D.A.Vanden Bout, Science 292, 255 (2001).
[9]
S.A. Reinsberg, A. Heuer, B. Doliwa, H. Zimmermann, and H.W. Speiss, J. Non-Cryst. Solids 307, 208 (2002).
[10]
A.H. Marcus, J. Schofield, and S.A. Rice, Phys. Rev. E 60, 5725 (1999); B. Cui, B. Lin, and S.A. Rice, J. Chem. Phys. 114, 9142 (2001); R. Zangi and S.A. Rice, Phys. Rev. Lett. 92, 035502 (2004).
[11]
C.-H. Chiang and Lin I, Phys. Rev. Lett. 77, 647 (1996); Y.J. Lai and Lin I, Phys. Rev. Lett. 89, 155002 (2002); W.-Y. Woon and Lin I, Phys. Rev. Lett. 92, 065003 (2004).
[12]
B. Liu and J. Goree, cond-mat/0511209.
[13]
C. Reichhardt and C.J. Olson Reichhardt, Phys. Rev. Lett. 90, 095504 (2003).
[14]
R.P.A. Dullens and W.K. Kegel, Phys. Rev. E 71, 011405 (2005).
[15]
C. Reichhardt and C.J. Olson Reichhardt, Phys. Rev. Lett. 93, 176405 (2004).
[16]
M.-C. Cha and H.A. Fertig, Phys. Rev. Lett. 73, 870 (1994).
[17]
D.G. Grier, Nature 424, 810 (2003).
[18]
M. Brunner and C. Bechinger, Phys. Rev. Lett. 88, 248302 (2002).
[19]
K. Mangold, P. Leiderer, and C. Bechinger, Phys. Rev. Lett. 90, 158302 (2003).
[20]
C. Reichhardt and C.J. Olson, Phys. Rev. Lett. 88, 248301 (2002).
[21]
P.T. Korda, M.B. Taylor, and D.G. Grier, Phys. Rev. Lett. 89, 128301 (2002).
[22]
P.T. Korda, G.C. Spalding, and D.G. Grier, Phys. Rev. B 66, 024504 (2002).
[23]
M.P. MacDonald, G.C. Spalding, and K. Dholakia, Nature 426, 421 (2003).
[24]
K. Harada, O. Kamimura, H. Kasai, T. Matsuda, A. Tonomura, and V.V. Moshchalkov, Science 274, 1167 (1996); U. Welp, X.L. Xiao, V. Novosad, and V.K. Vlasko-Vlasov, Phys. Rev. B, 71, 014505 (2005).
[25]
C. Reichhardt, C.J. Olson, R.T. Scalettar, and G.T. Zimányi, Phys. Rev. B 64, 144509 (2001).
[26]
J.W. Reijnders and R.A. Duine, Phys. Rev. Lett. 93, 060401 (2004); H. Pu, L.O. Baksmaty, S. Yi, and N.P. Bigelow, Phys. Rev. Lett 94, 190401 (2005).
[27]
A. Yethiraj and A. van Blaaderen, Nature 421, 513 (2003).
[28]
M.F. Hsu, E.R. Dufresne, and D.A. Weitz, Langmuir 21, 4881 (2005).
[29]
W. Ryoo, S.E. Webber, R.T. Bonnecaze, and K.P. Johnston, Langmuir 22, 1006 (2006).
[30]
R.D. Merithew, M.W. Rabin, M.B. Weissman, M.J. Higgins, and S. Bhattacharya, Phys. Rev. Lett. 77, 3197 (1996); M.W. Rabin, R.D. Merithew, M.B. Weissman, M.J. Higgins, and S. Bhattacharya, Phys. Rev. B 57, R720 (1998).


File translated from TEX by TTHgold, version 4.00.

Back to Home