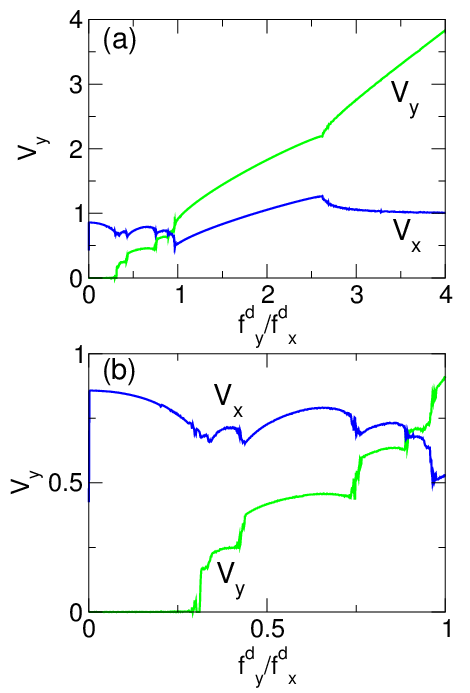
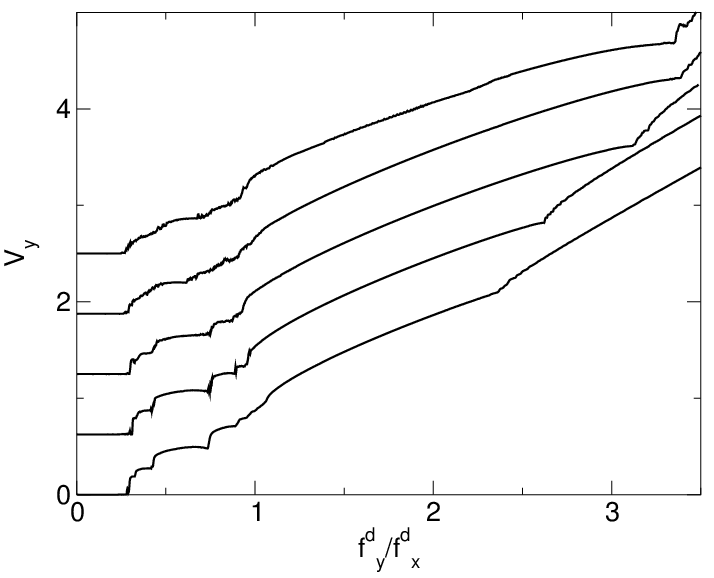
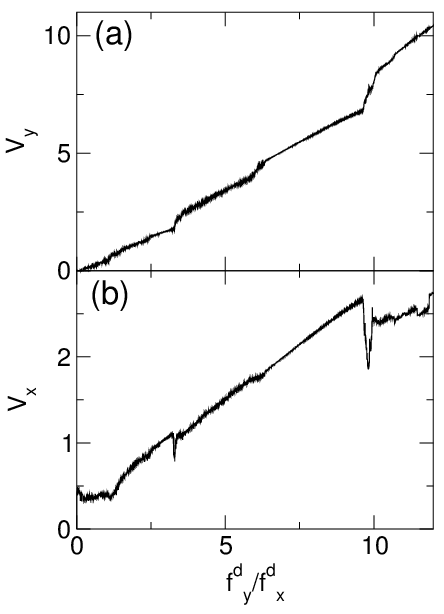
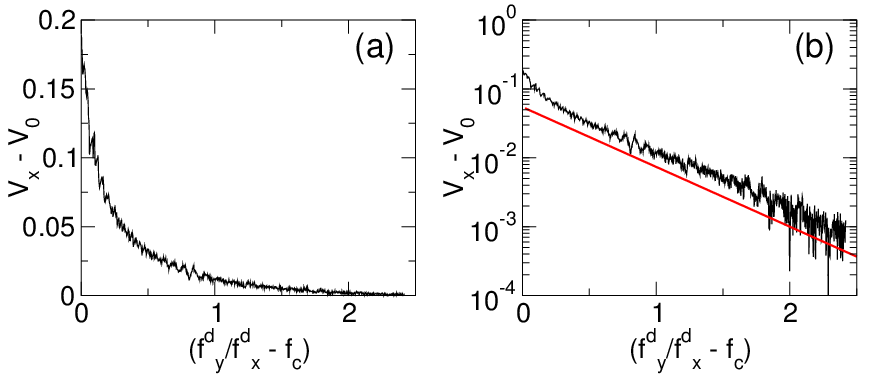
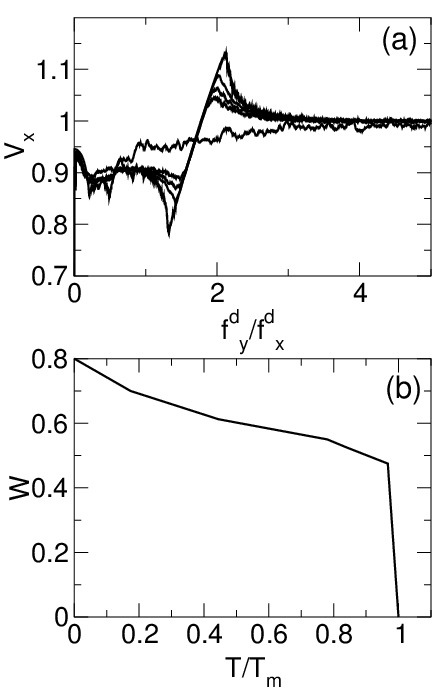
Physical Review E 69, 041405 (2004)

Directional Locking Effects and Dynamics for Particles Driven Through a Colloidal Lattice

C. Reichhardt and C.J. Olson Reichhardt

Center for Nonlinear Studies and Theoretical Division, Los Alamos National Laboratory, Los Alamos, New Mexico 87545

(Received 2 December 2003; published 30 April 2004)

We examine the dynamics of a single colloidal particle driven through a colloidal lattice which can distort in response to the driven particle. We find a remarkably rich variety of dynamical locking phenomena as we vary the angle of the applied drive with respect to the orientation of the colloidal lattice. When the driven colloid locks to certain lattice symmetry directions, its motion is not necessarily aligned with the drive. Applying a transverse force to the driven particle can result in either increased or decreased drag in the driving direction, depending on the angle of the drive. The dynamical locking produces anomalies in both the longitudinal and the transverse velocity vs driving force curves, including steps and regimes of negative differential resistance. As the interaction of the driven particle with the surrounding lattice increases, significant distortion or dislocations in the surrounding media occur, and as a result the directional locking is enhanced. We compare these results to those obtained for driving particles over fixed substrates, and show that a far richer variety of behaviors occurs when the underlying lattice is allowed to distort. We discuss how this system can be used for particle species segregation when the onset of different locking angles occurs at different drives for varied particle charges. We also show that the most pronounced locking phases should be observable at temperatures up to the melting transition of the colloidal lattice.
I. INTRODUCTION
II. SIMULATION
III. SMALL DRIVEN PARTICLE
A. Dynamics of Transverse Depinning
IV. DRIVEN PARTICLES WITH INTERMEDIATE CHARGE
A. Trajectories in the Locked Phase
B. Locked Phase Evolution as a Function of qd
C. Dynamics just outside of the m = 1, n = 0 phase
V. STRONGLY INTERACTING PARTICLES
VI. TEMPERATURE EFFECTS
VII. SUMMARY
References

I.  INTRODUCTION

Assemblies of interacting colloidal particles exhibit a wide range of ordered, glassy, and liquid states [1,2], and have proven an ideal system for studying these equilibrium states with various imaging techniques. Colloids can also be studied in nonequilibrium conditions such as under shear or when driven with different types of fields [2]. Recently Korda et al. [3] investigated the dynamics of moving colloids driven over a square two-dimensional (2D) optical tweezer array. Here, the optical tweezers act as attractive sites [4]. In this system, a series of locked transport states occur as the angle at which the colloids are driven with respect to the optical lattice is varied. In the locked states, the colloids move along a high-symmetry direction of the lattice even when this is not the same as the direction of drive. The locking produces steps in the colloidal velocity vs driving angle, and may have applications as a novel method for continuous separation of particles of different species, such as macromolecules and biological cells [5,6,7]. Separation can be achieved when a particular species locks to a symmetry direction while the remaining species continue to move in the direction of the applied drive. Other techniques to separate particle species along this line include the transport of particles through periodic obstacle arrays [8,9].
Particle transport through fixed periodic arrays under varying drive direction has also been investigated in simulations of vortices moving in nanostructured superconductors [10] and Josephson junctions [11,12,13]. Recent experiments on vortices driven at different angles through periodic pinning arrays find guiding effects similar to the features seen in simulations [14]. Similar effects have also been studied in electron transport through periodic anti-dot arrays [16] as well as atomic friction over ordered surfaces [17]. In general, for all of these systems, the particle motion locks to certain symmetry angles of the lattice. Refs. [10,16] showed that the velocity vs angle curve has a Devil's staircase structure, with a step in the particle velocity at each locking angle. Certain highly symmetrical angles of drive produce stronger locking than others.
In the experiments of Ref. [3] and the theoretical studies of Refs. [10,11,12,13,16,17], the periodic lattice through which the particles move is completely rigid. Another approach which has not been previously considered is for the driven particle to move through a stationary, but distortable, lattice of particles. In this case, the driven particle still interacts with a periodic array of obstacles; however, the driven particle can in turn affect the surrounding media and distort or create dislocations in the surrounding lattice. A physical example of such a system would be driving a single or small number of colloidal particles through a triangular colloidal lattice. This can be achieved by placing a colloidal particle that responds to an external drive into a colloidal lattice for densities and temperatures where the non-driven colloids form a triangular lattice. It should be straightforward to drive individual colloids with an optical tweezer [7]. It is also possible to use magnetic impurity particles driven with a magnetic field, as in recent experiments by Weeks et al. [18]. A variation on this type of system would be to have one colloid or impurity particle fixed at a spot and to drive the colloidal lattice past it. Experiments along this line have been performed previously for large obstacles [19].
A system that has many similarities to colloids is vortices in superconductors, where the mutual repulsion between vortices leads to the formation of a triangular lattice. For a clean superconductor where the intrinsic pinning is not strong enough to distort the vortex lattice, it may be possible to drive a single vortex with an MFM or STM tip. It has also been demonstrated experimentally using a lithographically created artificial pin [20] that a single pinning site can capture one or more vortices while the other vortices are driven past. Other similar systems include driving an obstacle through a triangular bubble raft lattice, or manipulating a single droplet of a two ferrofluid system in a triangular droplet state. Another system closely related to colloids is 2D dusty plasmas where charged dust particles form a triangular lattice [21] and individual particles can be driven with lasers.
In a system where the periodic lattice through which a particle is driven can itself be affected by the driven particle, a number of intriguing scenarios are possible which cannot arise when the substrate is completely rigid. Examples include a transition from an ordered flow, where the driven particle only distorts the lattice elastically and does not create dislocations, to a disordered flow, where the particle tears the lattice and dislocations are generated. This could occur when the particle moves at an angle that is not commensurate with the lattice, or for a large enough driven particle. Other effects that could occur include the possibility that, for certain driving directions, the driven particle may drag portions of the non-driven lattice with it. Conversely, for other driving directions, the particle may be able to slip freely between the particles comprising the lattice. Since the lattice can locally distort to more easily accommodate the motion of the driven particle in the locked regimes, the locking effects may be different in nature and more pronounced than those observed in previous work on rigid substrates. One practical application of this system, as suggested in Refs. [3,5], is the continuous separation of different species of particles as they move through periodic arrays of obstacles. We demonstrate that the separation of particles of different charges is enhanced by the ability of the surrounding lattice to distort. If, under certain conditions, the distortable lattice can act as a filter for different charged particles, then the additional step of using optical tweezer arrays, as in Ref. [3], would not be needed.

II.  SIMULATION

We simulate a 2D monodisperse colloidal assembly using Langevin dynamics, with techniques that have been described previously [22,23]. The overdamped equation of motion for a single colloid i in a system with periodic boundaries in the x and y directions is
η d ri

dt
= fij + fdi+ fT  .
(1)
Here η = 1 is the damping term arising from the fact that the particle is moving through a viscous media. The interaction force from the other colloids is fij = −∑jiNi V(rij), where the repulsive colloid-colloid interaction is Yukawa or screened Coulomb,
V(rij) = qiqj

|rirj|
exp(−κ|rirj|).
(2)
Here qi(j) is the charge of the particle, 1/κ is the screening length, ri is the position of particle i, and rj is the position of particle j. We initialize the system in a triangular lattice with N colloids and a lattice constant a, and then insert one additional driven colloid. The screening length is fixed at 1/κ = 3a.
The thermal force fT is a randomly fluctuating force modeled as random kicks, with the properties < fT(t) > = 0 and < fT(t)fT(t) > = 2ηkBTδ(tt). For most of the results presented here, the colloid density is held fixed and the system size is set to L=34a. With these parameters there is a well defined melting temperature Tm for the unperturbed lattice, which we determine by measuring the fraction of colloids which are six-fold coordinated, P6. In the solid, P6=1, but at the melting transition Tm, defects proliferate and P6 falls below 1 and becomes noisy [24]. We measure temperature in units of Tm. For the first part of the paper we consider the case of T = 0 so that the effects of the dynamics can be clearly distinguished. We later show that, for a large range of T/Tm, essentially the same results appear, and that the locking effects are lost for T/Tm > 1. Thus the results from our work should be applicable to experimental samples at finite temperatures.
We vary the charge on the driven particle qd and the direction of drive. All particles except the driven one have charge q=1 and applied dc drive fid=0. The force on the driven particle has two components:
fd = fdx
^
x
 
+ fdy
^
y
 
.
(3)
We hold fxd fixed at a constant value and increase fyd. We then monitor the velocities Vx and Vy of the driven particle.
We do not take into account possible hydrodynamic effects or possible long-range attractions between colloids. We have conducted simulations for different system sizes, lattice constants a, and screening lengths, and find that the qualitative results presented here are robust.
Fig1.png
Figure 1: Particles (black dots) and trajectories (black lines) for a system with qd/q = 0.35 at fxd=1.0 and: (a) fdy/fdx = 0.0, (b) 0.57, and (c) 0.78.

III.  SMALL DRIVEN PARTICLE

We first consider the case where the driven particle interacts only weakly with the surrounding particles so that, although small distortions of the lattice can occur, no dislocations are formed in the surrounding media. We define this weak interaction regime as qd/q < 0.5. In the case of a triangular lattice aligned in the x-direction, as in Fig. 1(a), locking should occur for angles of drive where the driven colloid can move freely between the colloids in the lattice. This occurs for ratios of the applied drive of
fyd

fxd
= √3m

2n + 1
(4)
where m and n are integers. The corresponding locking angle is θ = arctan(fyd/fxd). Eq. 4 predicts locking at 60° corresponding to m = 1, n = 0; 30° corresponding to m = 1, n = 1; 19.1° corresponding to m = 1, n = 2; and 0° for m = 0. Other locking angles occur for higher order values of m and n. In Fig. 1 we illustrate the driven particle, the surrounding lattice, and the particle trajectories for a system with fixed parameters of qd/q = 0.35 and fxd = 1.0 for increasing fyd/fxd=0, 0.57, and 0.78. The trajectories in all these cases show that the driven particle moves through the lattice without significantly distorting it, due to the weak charge of the driven particle. In Fig. 1(a) we show the commensurate case of fyd/fxy = 0 where the particle channels between the surrounding colloids. Fig. 1(b) presents another commensurate case for fyd/fxd = 0.57 where the particle moves in a periodic orbit along a symmetry line of the lattice. This orbit corresponds to m = 1, n = 1 from Eq. 4, so the flow is along 30°. In Fig. 1(c) we show an incommensurate case of fyd/fxy = 0.78, which is not a simple ratio in Eq. 4. Here the particle does not move in a completely periodic orbit but shows some non-periodic deviations; however, the particles in the surrounding lattice still show little deviation from their positions. We observe similar types of motion at the other incommensurate angles as well.
Fig2.png
Figure 2: The power spectra obtained from a time series of Vy for: (a) the commensurate case fyd/fxd=0.57 shown in Fig. 1(b), and (b) the incommensurate case fyd/fxd=0.78 shown in Fig. 1(c).
In order to better demonstrate the difference between the commensurate and incommensurate particle orbits in Fig. 1, we analyze the power spectra of the velocity Vy of the driven particle for the two cases. In Fig. 2 we show the power spectra S(ν) obtained from a time series of Vy of the driven particle at fixed fdy/fdx. Figure 2(a) illustrates S(ν) for the commensurate case fyd/fxd=0.57 shown in Fig. 1(b). Here the spectrum has a prominent peak at ν = 0.0127 inverse molecular dynamics steps with higher harmonics, indicating that the particle motion is strictly periodic with a single frequency. In a commensurate orbit, a single frequency is expected to appear since the particle is moving along a symmetry direction of the lattice and is slowed by the interactions from the surrounding lattice at a constant spacing and a constant rate. In Fig. 2(b), the spectrum for the incommensurate case fyd/fxd=0.78 shown in Fig. 1(c) has many peaks, indicating that the particle is undergoing motion with many different periods giving a broad spectrum. In general, for these incommensurate phases, the particle likely jumps between several different closely spaced locked phases with high m and n values which, together, produce an angle of motion which is close to the angle of the drive. We find similar behaviors in the power spectra at other commensurate and incommensurate angles.
Fig3a.png Fig3b.png
Figure 3: (a) Vx (dark line) and Vy (light line) for fixed fdx = 1.0 and increasing fdy for qd/q = 0.35. (b) Vy (dashed line) and its derivative Ry (solid line), showing the locking phases more clearly.
In Fig. 3(a) we simultaneously plot Vx and Vy vs fdy/fdx, with fixed fxd = 1.0, showing that the locked phases strongly affect the transport proprieties. We highlight a few ratios of (m,n) from Eq. 4 to indicate the most prominent locking phases: (0,0), which starts at fyd/fxd = 0 in the bottom left corner of Fig. 3(a); (1,1) for flow at 30°; and the very prominent (1,0) locking centered at fyd/fxd=1.7. There are additional smaller steps that are difficult to see for this value of qd. Another interesting feature is that Vx has an average value of 0.9 for fyd/fxd < 2.0. We note that, for a single driven colloid moving in the absence of any other particles, we would have Vx = 1.0, which is higher than the value obtained in the presence of the other particles. This indicates that the driven particle experiences an additional damping due to the interactions with the other particles. This damping originates when the surrounding colloids shift slightly as the driven particle moves past. Since the motion of these surrounding colloids is also overdamped, the only source of energy is the driven particle. In the case of a rigid substrate [10], this additional damping effect is absent since the periodic substrate cannot distort and absorb energy. Another immediately obvious difference between this system and particle motion over a rigid substrate is that in Fig. 3(a), none of the steps in Vy have dVy/dfdy = 0 [1,10,16]. Although the slope of Vy is reduced on the steps, it does not drop to zero, indicating that along the locking directions the particle velocity Vy continues to increase with fyd. Fig. 3(a) also indicates that, in the locking regions, Vx is not constant but shows features where the velocity both increases and decreases which coincide with slope changes in Vy. On the steps, when Vy locks to the lower slope value, Vx locks to a constant positive slope which can be seen most clearly near fyd/fxd = 1.7 at the 60° locking of (1,0). At the lower edge of the (1,1) and (1,0) steps, Vx decreases in an abrupt dip before rising linearly on the step. On the upper end of these steps, when the slope in Vy increases again, Vx shows another decrease.
In Fig. 3(b) we plot Vy along with its derivative Ry to show the locking phases more clearly. At the (1,0) locking, Ry drops to a lower value due to the smaller slope of Vy in the locking regions. Peaks appear in Ry at the beginning and end of each locked phase, reflecting the increased slope of Vy outside of the locked regions. Ry also shows some oscillations above the (1,0) locking, which we discuss in more detail in Section IV-C. Additionally, locking phases appear as dips in Ry for the (1,1) locking centered at fyd/fxd=0.57 as well as at (1,2) and (1,3).
Fig. 3(a) also demonstrates that there is a clear transverse depinning threshold for the (0,0) locking: Vy = 0.0 for fyd/fxd < 0.15. Here, despite the fact that the particle is moving in the x-direction, there is an effective pinning threshold for motion in the y-direction. Below this depinning threshold, the particle trajectories are the same as those shown in Fig. 1(a), where the particle moves in an effective 1D trough. Transverse depinning thresholds have been observed in various systems of particles driven longitudinally over a 2D periodic substrate as an increasing transverse force is applied. These systems include longitudinally moving vortices in periodic pinning arrays [10,11,13] and atoms moving over periodic surfaces [17]. In colloidal experiments on periodic substrates, a locking is observed for small angles [3]. In all these cases the particle motion remains locked in the longitudinal direction until a large enough transverse force is applied. In Fig. 3(a) as fyd/fxd approaches the transverse depinning threshold, Vx, the particle velocity in the x-direction, decreases. This decrease occurs because the increasing transverse force shifts the driven particle closer to the lattice particles, increasing the interaction between the driven particle and the other particles. Since the surrounding lattice is flexible, some of the motion of the driven particle is transfered into small distortions of the surrounding lattice. These distortions increase as the driven particle is forced closer to the particles in the lattice. Once the driven particle begins to move in the y-direction, its velocity in the x-direction increases since the driven particle no longer approaches the particles in the surrounding lattice as closely and thus experiences less damping of its motion. Remarkably, for 1.8 < fyd/fxd < 2.0, Vx is greater than 1.0, indicating that the particle is moving faster than it should given the applied driving force in the x direction. This indicates that some of the energy from the y component of the drive is being transferred to the x-direction. Above the (1,0) step for fyd/fxd > 2.0, Vx decreases slowly back to 1.0.
Fig4.png
Figure 4: Vx vs fdy/fdx for qd/q = 0.125, 0.25, 0.35, and 0.5 (from top left to bottom left).
We next consider how the locking regions evolve with increasing qd. In Fig. 4 we plot Vx vs fdy/fdx for qd/q = 0.125, 0.25, 0.35, and 0.5 with fxd=1.0. The plots are overlaid with no offset. For fyd/fxd = 0, Vx decreases for increasing qd, indicating that the damping increases as qd rises. This decrease in Vx occurs because the driven particle interacts more strongly with the surrounding particles, causing larger distortions and transferring more of its energy into the lattice. Additionally, all of the locking phases become wider with increasing qd, indicating that as the distortions in the surrounding lattice from the driven particle increase, the channeling effect becomes stronger. The locking phases for the higher order values of (m,n) can now be clearly resolved, especially for the qd/q = 0.5 curve where a particularly large number of dips occur for fdy/fdx < 1.0. For the locking at (1,0), the value of Vx exceeds 1.0 for fdy/fdx > 1.7 at all values of qd. Just above the (1,0) locking, Vx decays back to 1.0. During this decay, there are clear small scale periodic peaks which are a real effect that we study later in this paper.
We note that for small qd, the behavior of this system is similar to that of a particle moving through a rigid lattice in Ref. [10], where the same type of anomalous steps were observed in both Vx and Vy. The locations of the steps in Ref. [10] occurred for different values of fdy/fdx since the underlying lattice was square rather than triangular. Additionally, the slope of Vy along the steps was nearly zero in the rigid lattice, making Vy appear much more step-like. The similar behavior found here at small qd occurs when the driven particle can no longer cause significant distortions in the surrounding lattice, rendering it effectively rigid.

A.  Dynamics of Transverse Depinning

Fig5.png
Figure 5: (a) Vy vs fdy/fdx at the transverse depinning transition for the system shown in Fig. 3 with qd/q = 0.35. (b) Log-log plot of Vy vs (fdy/fdxfc) where fc=0.15 is the transverse depinning threshold. The solid line is a power law fit with an exponent of β = 0.58.
We now examine the initial transverse depinning transition in more detail. We first consider the shape of Vy vs fdy/fdx near the transverse depinning. For elastic media depinning in the presence of quenched disorder, theory predicts V ∝ (fdfc)β, where fc is the depinning threshold [25]. For a single particle depinning from a sinusoidal substrate in 1D, β = 1/2. In 2D systems of collectively interacting particles where plastic deformation occurs at depinning, studies find scaling in the velocity force curves with β > 1.5 [26]. It is not known if there would be any scaling for the transverse depinning of a longitudinally moving particle. In Fig. 5(a) we show Vy near the onset of motion in the y-direction for the system in Fig. 3 with qd/q = 0.35. We plot Vy vs fdy/fdxfc on a log-log scale in Fig. 5(b), where fc=0.15 is the transverse depinning force. We find a reasonable power-law fit with β = 0.58 (solid line in Fig. 5(b)), close to the single particle value of β = 1/2. This indicates that the transverse depinning is elastic in nature, and that when the particle depins it does not induce tearing in the surrounding lattice.
For the steps above (0,0), whenever the particle leaves a locked region, Vy shows curvature similar to that of the initial transverse depinning. This suggests that on the higher order steps, when the particle is channeling along an easy flow direction, the particle is effectively pinned in the direction transverse to fd, rather than in the direction transverse to fdx. As fdy increases, the transverse force eventually becomes high enough for the particle to depin and begin moving at a new angle.
Fig6.png
Figure 6: Particles (black dots) and trajectories (black lines) near the transverse depinning transition for the system shown in Fig. 5 at fdy/fc = (a) 1.05, (b) 1.22, (c) 1.34, and (d) 1.5.
In Fig. 6 we plot the particle trajectories at the transverse depinning transition for the system shown in Fig. 5. In Fig. 6(a), just above the initial transverse depinning at fdy/fc = 1.05, the particle stays locked along the x-direction for about 16a before moving in the positive y direction to the next row. The particle moves in a staircase fashion. In Fig. 6(b) for fdy/fc = 1.22, we find a staircase motion similar to that of Fig. 6(a), but with the particle translating in the y direction every 7a, producing a net Vy that is higher than that of Fig. 6(a). In Fig. 6(c) at fdy/fc = 1.34 and Fig. 6(d) at fdy/fc = 1.5, the staircase motion persists with the particle moving shorter distances in the x-direction between jumps to the next row in the y direction.

IV.  DRIVEN PARTICLES WITH INTERMEDIATE CHARGE

Fig7.png
Figure 7: (a) Vx (dark line) and Vy (lighter line) vs fdy/fdx for qd/q = 1.0. (b) Closeup of (a) for 0.0 < fdy/fdx < 1.0
Next we consider the case for 0.5 < qd/q < 3.0, which we term the intermediate particle regime. Here we observe that the locking phases become more pronounced and appear more step-like in Vy with dVy/dfdy = 0 in some places. We also find regimes where Vy decreases for increasing fyd, indicating a negative differential transverse resistance, or dVy/dfdy < 0. The scaling in the initial transverse depinning is also lost and is replaced by a sharp jump, indicating that for qd/q > 0.5 the system is no longer in the elastic regime. In Fig. 7(a) we show Vx and Vy for a system with qd/q = 1.0. For these intermediate qd values, the width of the (1,0) locking becomes so large that it begins to overlap with the smaller locking phases, and some of the smaller locking steps are lost. The dips in Vx are more pronounced and there are several regions where both Vx and Vy show jumps into and out of different locked phases, rather than the smoother transitions seen for lower values of qd. The slopes of Vx and Vy along the (1,0) locking are both positive but show a nonlinear bowing effect. In Fig. 7(b) we plot Vx and Vy for 0 < fdy/fdx < 1, showing the smaller locking phases more clearly. Along the step (1,1), centered at fyd/fxd = 0.6, the slope of Vy shows a bow feature, indicating that the slope becomes negative near fyd/fxd = 0.73. On the next step we find a similar bow feature. This behavior is in contrast to the studies with rigid substrates, where the slope of Vy never drops below zero along the steps. Fig. 7 also shows that both Vx and Vy can decrease simultaneously, indicating an overall increase in the damping. For these intermediate qd values there is considerably more distortion in the surrounding lattice. Just before the driven particle exits a locked region, it has the strongest interaction with the surrounding media and experiences the largest damping. At the jumps in velocity accompanying each step, the driven particle can cause enough distortion to temporarily generate a localized dislocation in the lattice.

A.  Trajectories in the Locked Phases

Fig8.png
Figure 8: Particles (black dots) and trajectories (black lines) for the system in Fig. 7 with fdy/fdx = (a) 0.39, (b) 0.6, (c) 0.8, and (d) 2.0.
In Fig. 8 we illustrate some of the particle trajectories for different locking regimes from the system in Fig. 7. Fig. 8(a) shows the step near fdy/fdx = 0.39, which corresponds to the m = 1, n = 2 locking phase. The particle moves in a zig-zag pattern. The elastic distortions in the surrounding colloid lattice are clearly visible in the form of very small loops on both sides of the path of the driven particle. Here, the colloids closest to the driven particle move a distance less than a as the driven particle approaches, and then return to their initial positions after the driven particle passes. There are some additional smaller distortions in the lattice at larger distances from the driven colloid; however, these motions are too small to be visible at the resolution in Fig. 8. In general, when the intermediate charged particles move through a channel during a locked phase, the motion is elastic and no dislocations are generated. Only during the transitions out of the locked phases do temporary distortions greater than a in the surrounding lattice occur.
Fig. 8(b) shows the trajectories at fyd/fxd = 0.6, when the particle moves at 30° in the (1,1) locking regime. The width of this (1,1) locked region is considerably larger than that of the (1,2) phase in Fig. 8(a). Here, the particle follows a sinusoidal path and causes distortions in the surrounding lattice; however, these distortions are of a smaller magnitude than those in Fig. 8(a), indicating that the particle channels more easily on the (1,1) step. In Fig. 8(c) we plot the trajectories for the step region at fyd/fxd = 0.8, where more significant distortions in the surrounding lattice occur than for Fig. 8(b). The width of this step is smaller than the (1,1) step in Fig. 8(b). In Fig. 8(d) we show the trajectories at fdy/fdx = 2.0 for the most prominent step, (1,0), where the vortices channel at 60°. There are almost no distortions in the surrounding lattice. For a value of fdy/fdx just below the end of the (1,0) phase, fdy/fdx ≈ 2.6, significant distortions of the colloids to the upper left of the driven particle occur in the surrounding lattice, since the driven particle is pushed in this direction by the increasing fdy. When these distortions become large enough, the (1,0) phase ends.

B.  Locked Phase Evolution as a Function of qd

Fig9.png
Figure 9: Vy vs fdy/fdx for varied qd/q. A systematic shift is added in the y direction for clarity. From top to bottom, qd/q = 2.0, 1.75, 1.5, 1.0, and 0.75.
Fig10.png
Figure 10: Vx vs fdy/fdx for the system in Fig. 9 with a systematic shift added to the y direction for clarity. From top to bottom, qd/q = 2.0, 1.75, 1.5, 1.0, and 0.75.
In Fig. 9 we plot Vy vs fyd/fxd for increasing values of qd. From bottom to top, qd/q = 0.75, 1, 1.5, 1.75, and 2.0. In this range of qd, the initial transverse depinning threshold changes little; however, the width of the (1,0) locking which begins at fyd/fxd ≈ 1.1 grows until it saturates at qd/q = 1.75. The width of the locking regions for fyd/fxd < 1.1 do not increase much with qd; however, they became increasingly smeared, which is particularly noticeable for qd/q ≥ 1.75. The smearing occurs when the lattice distortions become large enough to create dislocations in the surrounding lattice. These dislocations appear when the particle jumps from one symmetry angle to another, and thus they smear out the transition. The saturation of the width of the main (1,0) step also coincides with the onset of the creation of dislocations as the particle passes into and out of the locked phase. In Fig. 10 we plot the corresponding Vx vs fdy/fdx for the system in Fig. 9. Again we find a smearing of the features with increasing qd for fdy/fdx < 1.0. Additionally, we find an increase in the magnitude of the fluctuations in Vx just above the end of the (1,0) locking phase for qd/q = 2.0, due to the formation of dislocations in the surrounding media.
Fig11.png
Figure 11: Phase diagram for qd/q vs fdy/fdx. The transverse pinned phase is marked Tp, and the locked phase for m = 1, n = 0 is marked L.
In Fig. 11 we plot a phase diagram showing the evolution of the widths of the transverse pinned phase Tp and the (1,0) locked phase L. The phases are identified from the features in Vy shown in Fig. 9. Here the transverse pinned phase Tp grows with qd until its width saturates around qd/q = 0.75, while the locked phase L also grows with qd and saturates at qd/q=1.75. There is a small decrease in the width of the locked phase for higher values of qd. Above qd/q=2.5, the phases become increasingly difficult to distinguish due to the large distortions in the lattice that cause large velocity fluctuations near the transitions into and out of the locked phases.
The (1,0) phase grows with increasing particle interaction strength qd because the driven particle can more easily distort the surrounding lattice, allowing the lattice to accommodate the (1,0) phase for larger angles between the driving force and 60°. The increasing size of the locked region can also be viewed as arising from the fact that, as qd increases, the driven particle experiences a stronger potential interaction with the lattice. Eventually, for large enough qd/q, the distortion in the surrounding lattice becomes strong enough to allow dislocations to be created, enabling the particle to jump out of the locked channel, and limiting the growth of the locked phase L in Fig. 11. As the particle interaction increases above qd/q=2, this transition occurs at lower values of fdy/fdx, and the width of the (1,0) phase decreases as seen in Fig. 11. Similar growth of the size of the locked regions has been observed for systems with fixed lattices in Refs. [10,16].
The behavior of the locked phase in Fig. 11 also indicates how this system could be used for particle species separation. If two different species of particles are moving through the sample with the same applied fyd/fxd, then it is possible for one of the species to be in the locked L phase while the other species is not, and thus the two species will move in different directions. For example, for a drive of fyd/fxd = 1.25, particles with qd/q > 0.75 are in the L phase while particles with qd/q < 0.75 are not and will move at smaller angles. One advantage of this technique over the optical traps is that particles with the same optical properties but different charges or sizes could be separated.

C.  Dynamics just outside of the m = 1, n = 0 phase

Fig12.png
Figure 12: (a) VxV0 vs fdy/fdxfc, where V0 = 1.0 and fc=2.338 is the value of the driving force when the (1,0) locking phase ends for a system with qd/q = 0.75. (b) Log-linear plot of (a). The solid straight line is a fit with the form Aexp(−bx) where b = 2.0 and A = 0.1.
We now look more closely at some features in the Vx and Vy curves as well as the particle dynamics just at the end of the m = 1, n = 0 phase. In Fig. 10, after the end of the (1,0) phase, the Vx curves decay back to Vx = 1.0. All the values qd/q < 2.5 show a similar decay in this regime. To examine this decay, in Fig. 12(a) we plot VxV0 vs fdy/fdxfc, where qd/q = 0.75, V0 = 1.0, and fc=2.338 is the driving force at which the (1,0) locked regime ends and the Vx decay begins. In Fig. 12(b) we plot the same curve in log-linear form and show a good fit to an exponential form Aexp(−bx), with b = 2.0. For other values of qd/q we observe the same behavior with similar values for b. The fitting constants and curve shape do not change when the drive is swept more slowly in the simulations, indicating that we are not observing a transient behavior.
Fig13.png
Figure 13: (a) Vy vs fdy/fdx for the system in Fig. 12, just after the (1,0) locking ends. (b) Corresponding Vx.
Fig14.png
Figure 14: Particles (black dots) and trajectories (black lines) for the system in Fig. 13 at: (a) the step at fdy/fdx = 2.412, and (b) the step at fdy/fdx = 2.51.
In the decay region shown in Fig. 12, there appear to be some smaller oscillations in Vx. Similar oscillations are also seen in Vy. Focusing on this region, we find that the oscillations are actually steps. In Fig. 13(a) we plot Vy for the case of qd/q = 0.75 right after the end of the (1,0) locked phase. Here Vy does not increase smoothly but passes through a series of small jumps. Between these jumps Vy increases linearly. In Fig. 13(b) we plot the corresponding Vx for the same range of driving forces. Here Vx also decreases in a series of jumps which coincide with the jumps in Vy. Between the jumps, Vx increases linearly. For higher values of fyd/fxd beyond what is shown in Fig. 13, the jumps continue and become more frequent until they overlap. In order to determine the cause of the steps, in Fig. 14 we plot the particle trajectories on the small step centered at fyd/fxd = 2.412 from Fig. 13. Here the particle moves at 60° for a distance of about 17a, then jumps over to the next row, moves at 60° again, and then repeats the cycle of alternately jumping and moving. In Fig. 14(b), on the step just after fyd/fxd = 2.51 a similar motion is seen as in Fig. 14(a); however, the particle moves a distance of about 9a before jumping to the adjacent row. This staircase type motion is similar to the dynamics just above the transverse depinning transition as shown in Fig. 6. In both these cases the particle moves predominantly along the symmetry angle which is 0° for the transverse depinning and 60° here, with periodic jumps into the next row. For the higher order steps, the particle moves a shorter distance in the 60° direction before jumping to the next row.

V.  STRONGLY INTERACTING PARTICLES

Fig15.png
Figure 15: (a) Vy vs fdy/fdx for qd/q=5. (b) Corresponding Vx vs fdy/fdx.
We next consider the case of driven particles with qd/q > 2.5. In this regime we find that a significant number of dislocations are introduced into the system. In Fig. 15 we show Vy and Vx for qd/q = 5.0. Here the curves are noisy with several sharp steps. No clearly defined locking regime is present; however, there are remnants of the (1,0) locking regime.
Fig16.png
Figure 16: Particles (black dots) and trajectories (black lines) for the system in Fig. 15 at fdy/fdx = 1.0.
The smaller phase locking regions for drive angles less than 60° that were present at smaller qd are completely washed out in Fig. 15. On these smallest steps, as illustrated in Fig. 8, the driven particle created the largest distortions in the surrounding lattice. As qd is increased, dislocations appear first for the steps which produce the largest lattice distortions, and hence the smallest phase locking regions are smeared out first. This explains the disappearance of these phases at large qd. Fig. 15 shows that there is still an appreciable locking effect for the m = 1, n = 0 phase. The intermittent jumps in the velocities are due to the formation of dislocations, a process which abruptly changes the velocity of the driven particle. Additionally, a small number of dislocations remain in the colloid lattice for fdy/fdx below the m = 1, n = 0 phase. In Fig. 16 we show the trajectories for the system in Fig. 15 for fyd/fxd = 1.0. Here the trajectories are strongly disordered and in general do not overlap. For this value of drive a number of dislocations are created in the lattice. Some of the dislocations disappear when the lattice reorders once the driven particle moves past; however, some persist for long times. Since we are using periodic boundary conditions, the particle passes through the same region repeatedly and interacts with the persistent dislocations, which could make the flow more disordered. To address this we have performed the same simulations for larger systems and examined the trajectories before the particle comes back on its previous path. We find the same disordered flow, indicating that it is the process of dislocation creation which causes the particle trajectories to become disordered, and not the existence of dislocations from a previous passage. We have also measured the power spectra in this case and find white noise rather than a narrow band signal.

VI.  TEMPERATURE EFFECTS

Fig17.png
Figure 17: (a) Vx vs fdy/fdx for varied T/Tm = 0.0, 0.44, 0.7, 0.9, and 1.01. Tm is the temperature at which the non-driven lattice melts. The curve with the largest (1,0) locking phase (centered at fdy/fdx = 1.7) is T = 0.0. The width of the (1,0) locking phase decreases for increasing T. (b) Width W of the (1,0) locking vs T/Tm for the system in Fig. 17(a).
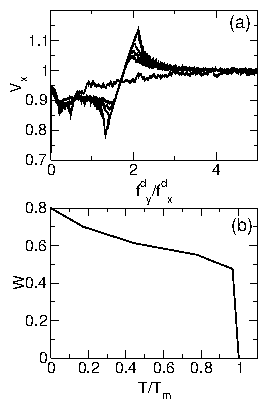
In a real colloidal system, temperature effects will be relevant. For a triangular colloidal system at a finite density, there is a well defined melting temperature Tm above which dislocations proliferate. We investigate the effects of the temperature on the locking up to Tm. We concentrate on the system with qd/q = 0.5 where locking is still clearly visible but the driven particle does not generate dislocations in the surrounding media at T = 0. In Fig. 17(a) we show Vx for T/Tm = 0.0, 0.44, 0.7, 0.9, and 1.01. For the lowest temperature, the width of the (1,0) step is the largest. It decreases for higher T and disappears above Tm. Additionally, the initial dip in Vx for the transversely pinned phases is also reduced as the temperature increases. The higher order locked regions for fdy/fdx < 1.4 become washed out for T/Tm ≥ 0.7.
In Fig. 17(b) we plot the width W of the (1,0) locking step from Fig. 17(a). Here the width deceases with increasing T and drops suddenly at Tm. This indicates that, even for relatively small particles, the locking effects should be observable in an experimental system all the way up to the melting transition of the colloidal lattice itself.

VII.  SUMMARY

In summary, we have investigated the dynamics of driven particles moving through a triangular colloidal lattice for varied orientations of the drive with respect to the symmetry of the colloidal lattice. This system, where the driven particle causes distortions in the surrounding colloidal lattice, differs from previously studied systems in which particles are driven through a lattice of fixed obstacles or traps. We find a series of locked phases as a function of drive angle where the particles prefer to move along certain symmetry directions. For driven particles that interact only weakly with the surrounding lattice, we find a Devil's staircase structure. For larger driven particles, the locking effects become much more pronounced and the transitions into and out of the locked states become much sharper. These transitions can be accompanied by the creation of short-lived dislocations in the surrounding lattice. We also find new features such as negative differential resistance in both the transverse and longitudinal velocities in the intermediate particle regime. As the charge of the driven particles increases, the smallest locking regimes are lost when the main locking regimes grow and significant distortion of the surrounding lattice occurs. For larger particles, the locking effects are washed out when significant numbers of dislocations are created. Since the width of the locking steps depends strongly on the charge of the driven particle, our results may be useful as a method for particle separation techniques or electrophoresis. We have also studied the dynamics at the transitions into and out of the main locking states and find a staircase-like motion of the driven particle.
We thank C. Bechinger, D.G. Grier, M.B. Hastings, P. Korda, X.S. Ling, A. Pertsinidis, and G. Spalding for useful discussions. This work was supported by the U.S. DoE under Contract No. W-7405-ENG-36.

References

[1]
C.A. Murray and D.H.Van Winkle, Phys. Rev. Lett. 58, 1200 (1987); A.E. Larsen and D.G. Grier, ibid. 76, 3862 (1996); A.H. Marcus and S.A. Rice, ibid. 77 2577 (1996).
[2]
For reviews of colloidal matter, see: C.A. Murray and D.G. Grier, Am. Sci. 83, 238 (1995); H. Lowen, J. Phys. Cond. Mat., 13, R415 (2001).
[3]
P.T. Korda, M.B. Taylor, and D.G. Grier, Phys. Rev. Lett. 89, 128301 (2002).
[4]
E.R. Dufresne and D.G. Grier, Rev. Sci. Intr, 69, 1974 (1998); E.R. Dufresne, G.C. Spalding, M.T. Dearing, S.A. Sheets, and D.G. Grier, ibid., 72, 1810 (2001); C. Bechinger, M. Brunner, and P. Leiderer, Phys. Rev. Lett. 86, 930 (2001); J.E. Curtis, B.A. Koss, and D.G. Grier, Optics Commun. 207, 169 (2002).
[5]
M.P. MacDonald, G.C. Spalding, and K. Dholakia, Nature (London) 426, 421 (2003); K. Ladavac, K. Kasza, and D.G. Grier, cond-mat/0310396.
[6]
A. Gopinathan and D.G. Grier, cond-mat/0311117.
[7]
For reviews of colloidal manipulation with optics, see: K. Dholakia, G. Spalding, and M. MacDonald, Physics World 15, 31 (2002); D.G. Grier, Nature 424, 810 (2003).
[8]
T.A.J. Duke and R.H. Austin, Phys. Rev. Lett. 80, 1552 (1998); D. Ertas, ibid. 80, 1548 (1998); C.-F. Chou, R.H. Austin, O. Bakajin, J.O. Tegenfeldt, J.A. Castelino, S.S. Chan, E.C. Cox, H. Craighead, N. Darnton, T. Duke, J. Han, and S. Turner, Electrophoresis 21, 81 (2000); R.H. Austin, N. Darnton, R. Huang, J. Sturm, O. Bakajin, and T. Duke, Appl. Phys. A 75, 279 (2002); L.R. Huang, P. Silberzan, J.O. Tegenfeldt, E.C. Cox, J.C. Sturm, R.H. Austin, and H. Craighead, Phys. Rev. Lett. 89, 178301 (2002).
[9]
For a review of some related separation techniques, see J.-L. Viovy, Rev. Mod. Phys. 72, 813 (2000).
[10]
C. Reichhardt and F. Nori, Phys. Rev. Lett. 82, 414 (1999).
[11]
K.D. Fisher, D. Stroud, and L. Janin, Phys. Rev. B 60, 15371 (1999).
[12]
V.I. Marconi, S. Candia, P. Balenzuela, H. Pastoriza, D. Domínguez, and P. Martinoli, Phys. Rev. B 62, 4096 (2000); D.E. Shalom and H. Pastoriza, Sol. St. Commun. 126, 379 (2003).
[13]
V.I. Marconi and D. Domínguez, Phys. Rev. B 63, 174509 (2001).
[14]
A.V. Silhanek, L. Van Look, S. Raedts, R. Jonckheere, and V.V. Moshchalkov, cond-mat/0302173; J.I. Martín et al., to be published.
[15]
G. Carneiro, Phys. Rev. B 62, R14661 (2000); C.C. de Souza Silva and G. Carneiro, Phys. Rev. B 66, 054514 (2002).
[16]
J. Wiersig and K.-H. Ahn, Phys. Rev. Lett. 87, 026803 (2001); J. Wiersig and K.-H. Ahn, Physica E 12, 256 (2002).
[17]
E. Granato and S.C. Ying, Phys. Rev. Lett. 85, 5368 (2000).
[18]
P. Habdas, D. Schaar, A.C. Levitt, and E.R. Weeks, cond-mat/0308622.
[19]
J.A. Weiss, D.W. Oxtoby, D.G. Grier, and C.A. Murray, J. Chem. Phys. 103, 1180 (1995).
[20]
T. Matsuda, K. Harada, H. Kasai, O. Kamimura, and A. Tonomura, Science 271, 1393 (1996).
[21]
R.A. Quinn and J. Goree, Phys. Rev. E 64, 051404 (2001).
[22]
C. Reichhardt and C.J. Olson, Phys. Rev. Lett. 89, 078301 (2002); ibid. 88, 248301 (2002); C.J. Olson Reichhardt and C. Reichhardt, J. Phys. A: Math. Gen. 36, 5841 (2003).
[23]
M.B. Hastings, C.J. Olson Reichhardt, and C. Reichhardt, Phys. Rev. Lett. 90, 098302 (2003).
[24]
C. Reichhardt and C.J. Olson Reichhardt, Phys. Rev. Lett. 90, 095504 (2003).
[25]
D.S. Fisher, Phys. Rev. B 31, 1396 (1985).
[26]
D. Domínguez, Phys. Rev. Lett. 72, 3096 (1994); C. Reichhardt and C.J. Olson, Phys. Rev. Lett. 89, 078301 (2002).


File translated from TEX by TTHgold, version 4.00.

Back to Home