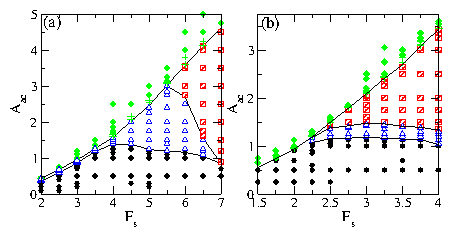
 Figure 3:
Phase diagrams as a function of ac amplitude Aac versus
substrate strength Fs. Filled circles: locked (L) phase; open
triangles: switching (S) phase; hatched squares: continuously polarized (CP)
phase; plus signs: partially depinned phase; diamonds: depinned phase.
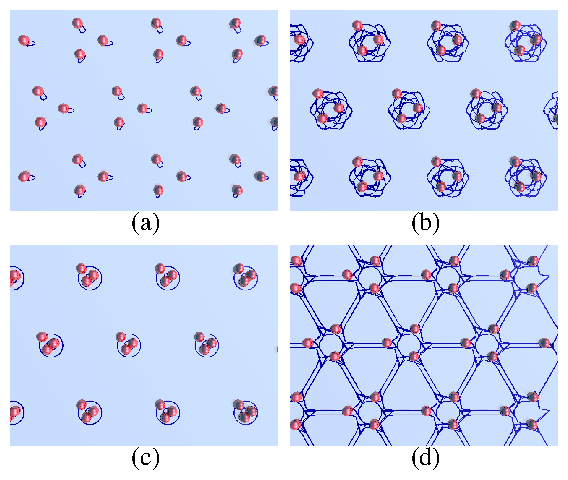
(a) Trimer state. The L phase is illustrated in Fig. 1(a), the S phase in
Fig. 1(b), the CP phase in Fig. 1(c), and the partially depinned phase
in Fig. 1(d). (b) Dimer state. The L HB phase is illustrated in Fig. 4(a),
the S HB phase in Fig. 4(b), and the CP phase in Fig. 4(f). Along the
boundary of the S and CP phases we find the martensitic switching regime which
is a combination of S and CP.
|

