Physical Review B 65, 174523 (2002)

Transverse Phase Locking for Vortex Motion in Square and Triangular Pinning Arrays

C. Reichhardt1 and C.J. Olson2

1 Center for Nonlinear Studies, Los Alamos National Laboratory, Los Alamos, New Mexico 87545
2 Theoretical and Applied Physics, Los Alamos National Laboratory, Los Alamos, New Mexico 87545

(Received 2 January 2002; published 2 May 2002)

We analyze transverse phase locking for vortex motion in a superconductor with a longitudinal DC drive and a transverse AC drive. For both square and triangular arrays we observe a variety of fractional phase locking steps in the velocity versus DC drive which correspond to stable vortex orbits. The locking steps are more pronounced for the triangular arrays which is due to the fact that the vortex motion has a periodic transverse velocity component even for zero transverse AC drive. All the steps increase monotonically in width with AC amplitude. We confirm that the width of some fractional steps in the square arrays scales as the square of the AC driving amplitude. In addition we demonstrate scaling in the velocity versus applied DC driving curves at depinning and on the main step, similar to that seen for phase locking in charge-density wave systems. The phase locking steps are most prominent for commensurate vortex fillings where the interstitial vortices form symmetrical ground states. For increasing temperature, the fractional steps are washed out very quickly, while the main step gains a linear component and disappears at melting. For triangular pinning arrays we again observe transverse phase locking, with the main and several of the fractional step widths scaling linearly with AC amplitude.
I. INTRODUCTION
II. SIMULATION
III. FRACTIONAL STEPS FOR SQUARE PINNING ARRAYS
A. Commensurate Vortex Orbits and Noise
B. Scaling Velocity vs Drive and Fractional Steps
C. Effect of Filling Fraction
D. Effect of Temperature
IV. TRANSVERSE PHASE LOCKING FOR TRIANGULAR PINNING
V. CONCLUSION
References

I.  INTRODUCTION

The phenomena of phase locking can occur in systems interacting with a periodic potential when an external AC drive is superimposed over a DC drive. A resonance or frequency matching can occur between the AC frequency and the internal frequency generated by motion over the periodic substrate. The best known example is that of Shapiro steps in AC/DC-driven single Josephson-junctions [1,2] and arrays of Josephson-junctions [3], where steps are observed in the current-voltage characteristics. Shapiro like phase locking has also been extensively studied in charge-density-wave systems [4], spin-density waves [5] and vortices in superconductors with periodic substrates [6,7,8,9]. In addition, in elastic media moving over random disorder, a washboard signal can be generated by the periodicity of the elastic media itself [10,11], allowing Shapiro like steps to be observed when an AC drive is applied, such as in vortex systems with random disorder [12,13]. In all these systems the AC drive is superimposed in the same direction as the DC drive. Another characteristic of Shapiro like phase locking steps is that the step width oscillates with AC amplitude and frequency between zero and a finite value as an nth order Bessel function Jn(A), where n = 0 corresponds to the depinning or critical current and n > 0 corresponds to higher order steps.
Recently a different kind of phase locking was proposed for a 2D system of vortices moving through a periodic substrate. Here the AC drive is applied in the perpendicular direction, transverse to the longitudinal applied DC drive [14]. Phase locking steps, distinct from Shapiro steps, were observed in the velocity versus applied DC drive. The most pronounced step occurs for DC drive values that allow a sinusoidal orbit to fit into each square pinning plaquette. For larger AC amplitudes a number of additional fractional steps were also observed. In addition, unlike Shapiro steps, the width of the depinning and higher order steps were shown analytically and in simulation to increase monotonically with AC amplitude as (A/ω)2, where A is the AC amplitude and ω is the AC frequency. A similar transverse phase locking phenomena can also occur for an ordered vortex lattice moving over random disorder, as was recently demonstrated [15]. In the random disorder case, the steps differ from those observed for square periodic pinning. The step width for random disorder is more like a Shapiro step, going as ∝ |J1(A)|. In addition, for low AC amplitudes, the step width grows linearly, rather than quadratically as in the case of square pinning.
There are several open questions for the transverse phase locking in the square pinning arrays. It is not known how the additional fractional steps scale with AC amplitude, what the vortex orbits look like along these steps, or what the noise signatures are. It also not known if there is any scaling at the transition to the phase locked state similar to that found in charge density wave systems, where critical scaling is known to occur at depinning and along the transitions into and out of the phase locked regions [16,17,18]. The effect of disorder on the transverse phase locking has also not been investigated. The vortex filling fraction or applied field in experiments will likely determine the step width or whether the steps occur at all. For certain filling fractions the overall vortex lattice can be disordered or frustrated [19], which may destroy the steps. In addition typical transport experiments are often done near Tc so the effects of finite temperature on the fractional and main steps should also be investigated to determine the feasibility of observing these states experimentally.
It would also be interesting to examine the effects of a transverse AC drive on systems in which there is an internal transverse oscillation even in the absence of an AC drive. An example of such a system is vortex motion through a triangular pinning array. Interstitial vortices driven through such an array by a longitudinal DC drive oscillate back and forth in the transverse direction as they move in order to pass through each minima of the interstitial potential. In this case the additional internal transverse oscillation may lock with the AC transverse force, leading to an enhancement of the transverse phase locking similar to that observed for the square case. Alternatively, the phase locking may be more Shapiro like, such as the steps found in the transverse phase locking with random pinning [15].
We focus on the transverse phase locking for vortex motion in square and triangular pinning arrays in thin film superconductors. Vortex pinning and dynamics in thin samples with periodic pinning have attracted considerable attention, since the effects of pinning can be systematically controlled. These pinning arrays can be created using an array of holes [20,21,22,23,24] or magnetic dots [25,26]. Various pinning geometries have also been created such as square [21,22,24], triangular [25], rectangular [26], and Kagome [27]. Pronounced commensurability effects appear as peaks in the critical current at integer matching fields and fractional fields where the vortices can form a symmetrical configuration with the pinning array so that the vortex-vortex interaction energy is reduced. These matching configurations have been imaged directly in experiment [22,24] and also observed in simulations [19]. For large pinning sites above the first matching field, where there are more vortices than pinning sites, multiple vortices can be captured by each pin up to a saturation point. Beyond this saturation number, additional vortices will be located between the pinning sites in the interstitial regions. For small pinning sites, the saturation number is one, so that for all fields above the first matching field the vortices are located at the interstitial regions. Direct imaging and simulations have shown that these interstitial vortices can form ordered commensurate arrangements [19,24]. The interstitial vortices are still pinned even though they do not interact directly with the pinning sites, since a periodic potential is created by the repulsive interaction of the vortices trapped at the pinning sites. The interstitial vortices are typically far less strongly pinned than the vortices at the pinning sites, so that under an applied drive the interstitial vortices move while the vortices at the pinning sites remain immobile. Evidence for the motion of the interstitial vortices has been provided by transport measurements [23] as well as direct imaging in square pinning arrays, which show that the interstitial vortices move in 1D paths between the pinning sites [24]. In simulations, 1D interstitial vortex flow between pinning sites has also been observed [28,29]. Recent experiments [8] and simulations [9] have demonstrated the appearance of steps in the V-I characteristics for moving interstitial vortices when a DC and AC drive are superimposed. In the previous theoretical work for an applied transverse AC drive, vortex filling fractions between 1.0 and 2.0 were examined, where each pinning site captures only one vortex [9].
In this work we examine the additional fractional steps for the square pinning array with a transverse AC drive. We find fractional steps both above and below the main step. We show that the width of most of the fractional steps scales as the square of the AC amplitude, as previously shown for the depinning current and the main step [14]. Along the steps, the vortex orbits are stabilized in fixed trajectories, while in the non-step regions, the vortex motion is chaotic in appearance, producing a distinct velocity noise spectra. We also find scaling in the velocity versus applied DC drive at depinning and near the main step, with β = 1/2. The steps are most prominent for commensurate vortex filling fractions where the interstitial vortices form a symmetrical ground state. For filling fractions where the vortices are disordered, the phase locking phenomena is absent, and for filling fractions just off of a commensurate filling, the steps have a linear increase with drive due to the fact that certain portions of the sample are not undergoing phase locking. We find that even for small finite temperatures, the fractional steps become completely washed out. The main step is visible up to the melting point of the interstitial vortex lattice. With triangular pinning we find a much more pronounced main step and fractional steps, with the depinning threshold nearly the same as that of the square case. The widths of the main and most of the fractional steps scale linearly with the AC amplitude for triangular pinning.

II.  SIMULATION

We numerically integrate the overdamped equations of motion, which for a single vortex i is
fi = fivv + fivp + fDC + fAC = vi   
(1)
The total force acting on vortex i is fi, fivv is the total force from all the other vortices, fivp is the force from the substrate, fDC is the force from the DC drive and fAC is the force from the AC drive. The simulation is in 2D with periodic boundary conditions in the x and y directions. For the square pinning case we place an array of Np = N ×N pinning sites in the sample, where each pinning site is an attractive parabolic potential of radius rp and a maximum force fp. To create a triangular pinning array, we displace every other row of pinning sites by half a pinning lattice constant. The force from the pinning sites is fivp = ∑kNp(fp/rp) |rirk(p)|  Θ(rp −|rirk(p)|)rik(p), where Θ is the step function, rk(p) is the location of pinning site k, and rik(p) = (rirk(p))/| rirk(p)|. In our system each pin captures only one vortex. The total force from the vortex-vortex interaction is fivv = −∑jiNvi Uv(rij) where we use U(r) = −ln(r), the Pearl vortex-vortex interaction potential, appropriate for thin film superconductors. The experiments with periodic pinning arrays are in this 2D limit. For computational efficiency we use a summation technique [30] to evaluate the vortex-vortex interaction. Temperature can also be applied to the system by adding a noise term fiT to the equation of motion. This noise term has the properties < fiT(t) > = 0.0 and < fiT(t)fjT(t) > = 2ηkBTδijδ(tt). Here we set η = kB = 1.
We have considered pinning arrays from 4×4 to 10×10 pins and observe the same results in each case. The initial vortex configurations are obtained by annealing from a high temperature where the vortices are in a liquid state and cooling to T=0. The DC driving is in the x-direction, fDC = fDCx, and the AC force is in the y-direction, fAC = Asin(ωt)y. The DC force is increased from zero in increments of 0.0009. We average the vortex velocities V = ∑vi ·x at each increment for 175000 MD steps, and the resulting DC force versus velocity curve is proportional to the DC voltage-current curve.

III.  FRACTIONAL STEPS FOR SQUARE PINNING ARRAYS

Fig1.png
Figure 1: Velocity V vs applied DC drive fDC for AC amplitudes A = 0.25 (upper curve) and 0.35 (lower curve) for a square pinning array. The upper curve has been offset upwards by 0.02 for clarity.
Fig2.png
Figure 2: Magnified regions of vortex velocity V versus applied DC drive fDC for A=0.35. (a) 0.222 < fDC < 0.241, showing phase locking steps below the main step. (b) 0.4 < fDC < 0.45, showing phase locking steps above the main step.
In Fig. 1 we show the vortex velocity V versus applied DC drive fDC for two different AC amplitudes, A=0.25 (upper curve) and A=0.35 (lower curve), for a fixed frequency of ω = 0.002. Here there is a large step, centered near fDC = 0.32 for A=0.25 and fDC = 0.35 for A=0.35, which corresponds to a phase where the vortex orbit is commensurate with the pinning, forming a sinusoidal like orbit as studied previously. We label this step the "main step" or 1:1 step. In addition to this step, a number of smaller or fractional steps are visible both above and below the main step. For example, for A=0.35 a prominent step appears near fDC=0.27, and a small step is visible near fDC=0.46. The widths of all the steps, including the depinning threshold, are smaller for the lower AC amplitude. The phase locking steps shown in Fig. 1 are flat throughout the step as predicted analytically in Ref. [14]. The depinning threshold drops from fDC=0.225 for A=0.35 to fDC=0.190 for A=0.25, while the width ∆ of the main step drops from ∆ = 0.09 for A=0.35 to ∆ = 0.04 for A=0.25. In Fig. 2(a) we show a magnified region of 0.222 < fDC < 0.241, near the depinning threshold, for the A = 0.35 curve in Fig. 1. Here the large number of fractional steps present are clearly visible, with the step widths getting progressively smaller for lower fDC. In Fig. 2(b) we show a magnified region of the A = 0.35 curve above the main step, from 0.4 < fDC < 0.45, where a series of fractional steps appear. Again the step widths decrease as fDC is lowered toward the main step.

A.  Commensurate Vortex Orbits and Noise

Fig3.png
Figure 3: Vortex trajectories (lines) and vortex positions (black dots) over equal time intervals for constant fDC values chosen from the lower curve in Fig. 1 with A=0.35. The vortices in the square lattice are trapped in pinning sites and remain immobile; only the interstitial vortices are moving. The trajectory of only a single mobile vortex is presented for clarity. fDC = (a) 0.235, (b) 0.243, (c) 0.28, (d) 0.305, (e) 0.36, and (f) 0.429.
On steps at small fDC values, a vortex spends more than one AC cycle in a single plaquette, while on steps at larger fDC, the vortex moves through more than one plaquette in a single AC cycle. In Fig. 3 we illustrate the vortex trajectories (lines) and the vortex positions (dots) for fixed fDC drives on and near the steps in the V versus fDC curve of Fig. 1 for A = 0.35. Fig. 3(a) shows the vortex trajectory for the step near fDC = 0.235, which is most clearly visible in Fig. 2(a). Here, a stable vortex orbit occurs in which the vortex spends two AC cycles in one plaquette before moving over to the next plaquette to repeat the sequence. We observe similar behavior at the smaller steps for fDC < 0.235, where in the stable orbits, the vortex spends n or n + 1/2 complete AC cycles in one plaquette. In Fig. 3(b), in the stable orbit for the step at fDC = 0.243 in Fig. 1, the vortex spends 3/2 of an AC cycle in each plaquette. In Fig. 3(c) we show the vortex trajectory for fDC = 0.28, which corresponds to the second largest step in Fig. 1. Here the vortex goes through one AC cycle per plaquette. In the non-step region of Fig. 3(d), at fDC = 0.305, there is no single stable vortex orbit. Instead the vortex trajectory wanders over time. There is an area close to the occupied pinning sites where the vortex never flows due to the vortex-vortex repulsion. We find similar orbits for the other non-step regions. On the main step, illustrated in Fig. 3(e) at fDC = 0.36, the vortex moves through two plaquettes in a single AC cycle. In Fig. 3(f) the vortex orbit for a step above the main step, fDC = 0.429, has a similar pattern to that seen on the main step, Fig. 3(e), except that the vortex moves through three plaquettes in each complete AC cycle.
Fig4.png
Figure 4: Velocity noise S(f) versus frequency f for A = 0.35. Lower curve: Noise signature along the main step corresponding to the vortex orbit at fDC = 0.36 shown in Fig. 3(e). Upper curve: Noise signature in the non-step region for the vortex orbit at fDC=0.305 shown in Fig. 3(d).
The presence of stable orbits can also be inferred through measurement of the velocity noise, which corresponds experimentally to the voltage noise. We acquire a time series of the velocity in the x-direction for a fixed fDC value. The corresponding noise spectrum is given by S(f) = |∫V(t)eif t dt|2. In Fig. 4, we examine the noise spectra for A = 0.35 for a step region, fDC = 0.36, and a non-step region, fDC = 0.305, corresponding to the orbits in Fig. 3(e) and Fig. 3(d). In the step region (lower curve), a strong periodic signal is present at the frequency induced by the AC driving, as indicated by the narrow large spike and the higher harmonics. For the non-step region (upper curve) there is is a broadened peak near the AC driving frequency. The noise power for the lower frequencies is over 4 orders of magnitude higher than for the step region. This lower frequency noise power comes from the vortex orbits drifting over a time scale that is longer than the AC driving time scale. The noise spectra does not have a broad band or 1/fα characteristic. We find a similar noise spectra for the other non step regions.

B.  Scaling Velocity vs Drive and Fractional Steps

The velocity curves in Fig. 1 show considerable curvature near the depinning threshold and just above each step. Fisher has suggested that depinning can be considered a dynamical critical phenomena [16] where
V = (ffc)β,
(2)
where f is the DC driving force, fc is the driving force at which depinning occurs, and V is the velocity of the driven media. In addition, in numerical work on CDW systems a similar scaling is found near the mode locked steps [17,18] in the form
|VVq| = |ffq|β ,
(3)
where Vq is the velocity along the qth step and fq is the driving force at which the step ends or begins. For a single particle moving in a 1D periodic substrate, β = 1/2. In charge density wave systems with random pinning, simulations of the depinning and step transitions give β = 0.67 in 2D and 0.83 for 3D, while experimental results are consistent with the results for the 3D regime [18]. In our system, one might expect to find scaling with β = 1/2 as in the 1D periodic substrate picture since the vortices are commensurate with the periodic pinning. On the other hand, the orbits in Fig. 3 indicate that the vortices have a 2D velocity component and do not flow in strictly 1D channels, so it is not clear if or how the velocities will scale.
Fig5.png
Figure 5: (a) Log-log plot just above depinning of V = (ffc) for A=0.35, where fc=0.196 is the depinning threshold and f is the DC driving force. The solid line shows a slope of β = 1/2. (b) Log-log plot above the main step of VVq = (ffq) where Vq=0.24 is the velocity along the main step and fq=0.395 is the DC driving force where the step ends. The solid line shows a slope of β = 1/2.
Fig6.png
Figure 6: The dV/dfDC curve for A = 0.35 starting at the DC depinning threshold of fDC=0.196.
In Fig. 5(a) we plot on a log scale V = ffc just above depinning for A = 0.25, with the depinning threshold of fc=0.196, and in Fig. 5(b) we plot |VVq| = ffq above the main step for A = 0.25, with the velocity Vq=0.24 along the main step, and where the end of the step is at fq=0.395. Here in both cases for low f the curves fit well to β = 1/2, with a deviation to linear behavior for higher f. Our velocity resolution was too low to obtain adequate scaling for steps other than the main step. We find similar scaling for the depinning and the main step for all filling fractions at which the interstitial vortices form a symmetrical configuration. For non-symmetrical vortex configurations, the scaling breaks down due to the fact that the depinning process for the non-symmetrical configurations is plastic, rather than elastic as in the case of the symmetrical configurations. Scaling may still occur for the incommensurate systems as found in simulations with random pinning where plastic flow occurs, where scaling in the velocity versus drive was observed [31] with β > 1.5. Very large systems beyond the scope of this work would be needed in order to determine if such scaling occurs for the incommensurate cases. In addition, some of the scaling breaks down for high AC amplitudes, as seen for A = 0.35 in Fig. 1 where there are sharp jumps into and out of certain steps. For example, in Fig. 6 we plot the dV/dfDC curve for A = 0.35, showing peaks going into and out of the phase locked regions. For β = 1/2 scaling, the overall shape of dV/dfDC should scale with a power −1/2, which is consistent with the curve in Fig. 6.
Fig7.png
Figure 7: The scaling of the step width ∆ as a function of AC amplitude A for the fractional steps corresponding to: (diamonds) fDC=0.235 [Fig. 3(a)], (triangles) fDC=0.243 [Fig. 3(b)], and (squares) fDC=0.28 [Fig. 3(c)]. The scaling of the main step at fDC=0.36 [Fig. 3(e)] is also shown (circles). The solid line is a quadratic fit.
We next show how the widths of different steps scale with AC amplitude. In earlier work it was shown that the increase in the depinning force and the width of the main step increase as the square of AC amplitude. In Fig. 7 we plot the step widths ∆ vs AC amplitude A corresponding to the steps at fDC=0.235 [Fig. 3(a)], fDC=0.243 [Fig. 3(b)], and fDC=0.28 [Fig. 3(c)]. We also show the scaling for the main step, fDC=0.36 [Fig. 3(e)], for a comparison. The widths all fit well to A2 with some deviations at higher AC amplitudes, where the widths increase faster than A2.

C.  Effect of Filling Fraction

Fig8.png
Figure 8: The V vs fDC curves for different vortex filling fractions. The curves have been shifted up from V = 0.0 for presentation. From lowest to highest: B/Bϕ = 17/16, 5/4, 0.34, 3/2, 0.67, 1.97, 2.0, and 2.04. Here A = 0.35.
In Fig. 8 we show a series of velocity vs fDC curves for increasing filling fractions from (bottom to top) B/Bϕ = 17/16, 5/4, 0.34, 3/2, 0.67, 1.97, 2.0, and 2.04. The interstitial vortex lattice forms an ordered symmetrical ground state for B/Bϕ = 17/16, 5/4, 3/2, and 2.0. At these fillings the phase locking steps are the most pronounced, and the velocity curves are almost identical for each one. These are also the same filling fractions where peaks in the critical current are observed in experiments and simulations. Since the interstitial vortices form a symmetrical ground state, the effective interstitial vortex interactions cancel, and the system can be thought of as a single particle moving through a periodic substrate. In the absence of an AC drive, the vortices collectively move in 1D paths under a DC drive. For the filling fractions B/Bϕ=0.34 and 0.67, the ground state is disordered and the phase locking is absent. In the absence of an AC drive the vortices move plastically in winding paths. Under an applied AC drive, this winding motion destroys any phase locking.
Fig9.png
Figure 9: Vortex trajectories (lines) and positions (black dots) along the main step for fDC=0.36 and A=0.35 for (a) B/Bϕ = 2.0, showing complete phase locking; (b) B/Bϕ = 2.04, showing that only a certain portion of the moving vortices are undergoing phase locking.
For filling fractions B/Bϕ=1.97 and 2.04, just below and just above the commensurate filling at B/Bϕ=2.0, the phase locking still occurs; however, the steps have an additional linear velocity increase superimposed on them. In Fig. 9(a) we illustrate vortex trajectories along the main step for B/Bϕ = 2.0 and in Fig. 9(b) for B/Bϕ = 2.04. For B/Bϕ = 2.0 the vortices move in well defined stable sinusoidal trajectories, while for B/Bϕ = 2.04 only certain rows of vortices have this ordered motion while the vortices in the other rows have unstable ordering. Only the rows with stable orbits are phase locked and remain at the same velocity along the step for increasing fDC. The vortices moving through the unstable channels are not phase locked and therefore their velocity increases with fDC, accounting for the linear velocity increase in the V - fDC curves along the step. The stable moving vortex rows have a commensurate number of vortices. In the system presented here, for an 8×8 pinning lattice there are eight interstitial vortices in each commensurate row. There are more than eight vortices in the rows with unstable vortex trajectories, so the rows are incommensurate. For certain filling fractions such as B/Bϕ = 0.67, all the rows are incommensurate and there is no phase locking. For B/Bϕ=1.97, where the unstable or incommensurate rows have less than eight vortices, we observe vortex trajectories similar to those in Fig. 9(b). We note that similar behavior occurs just above and below the filling fractions of 5/4 and 3/2. These results are consistent with experimental results in which Shapiro steps were most clearly defined at B/Bϕ = 2.0 [8].

D.  Effect of Temperature

Fig10.png
Figure 10: 
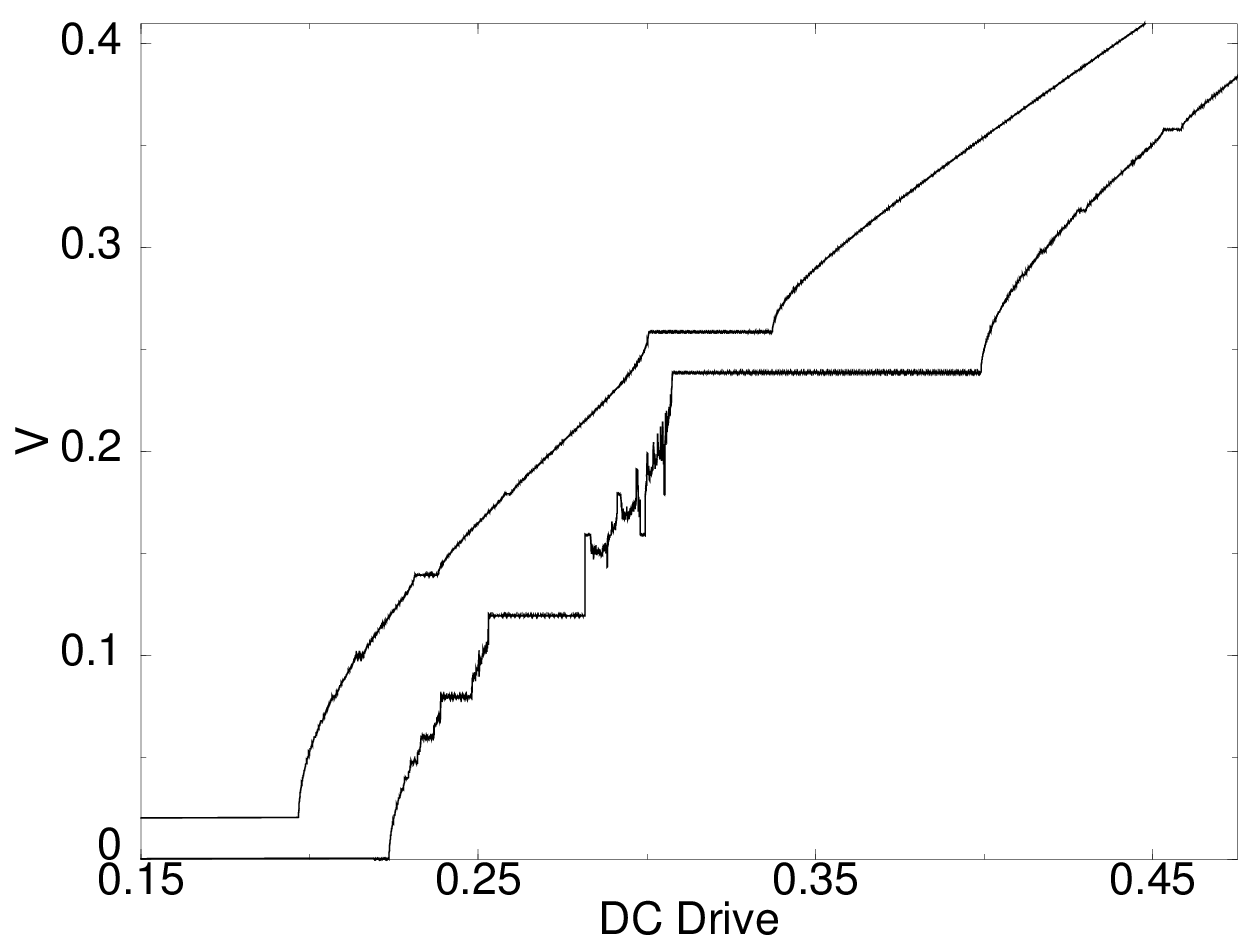
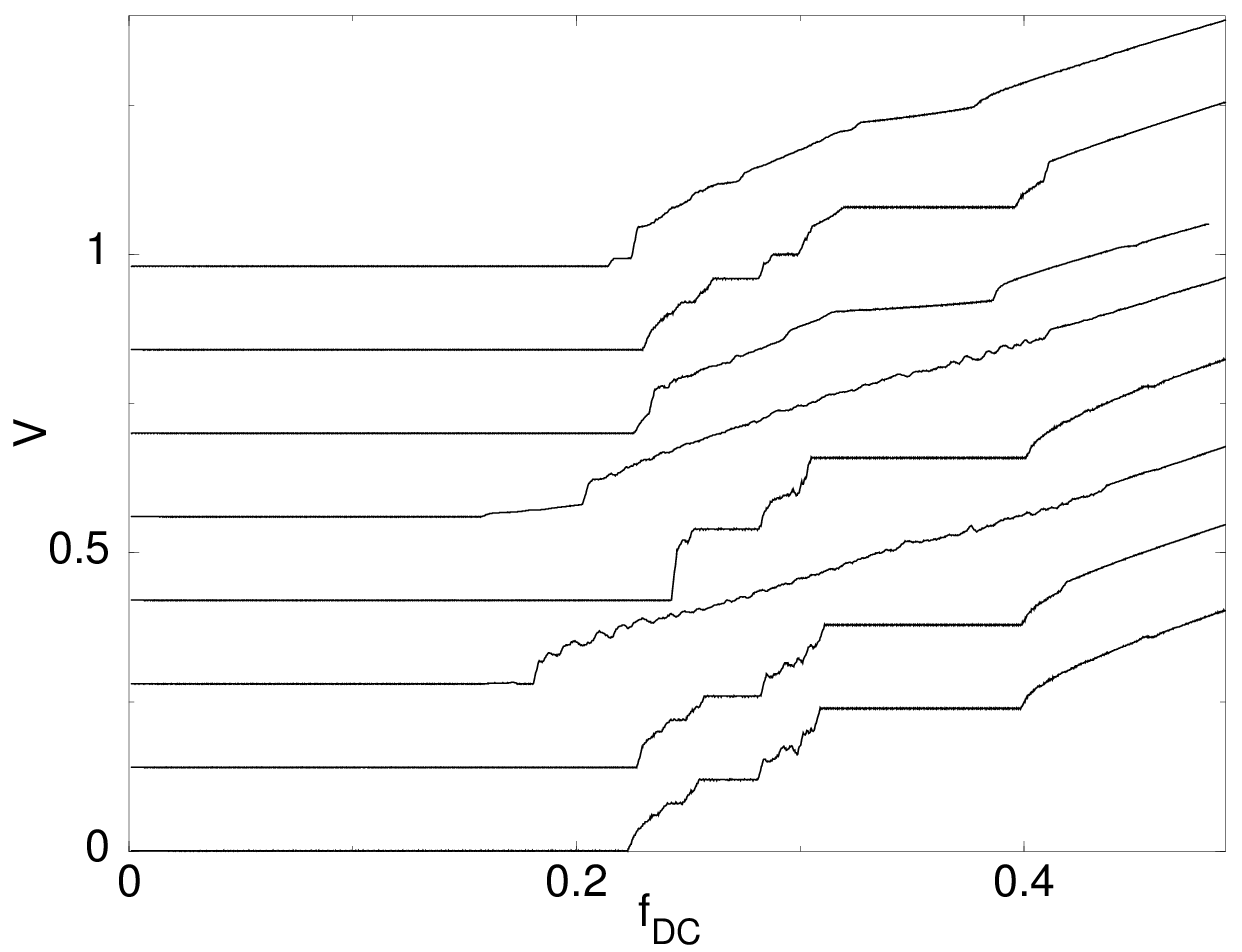
The V vs fDC curves for different temperatures for B/Bϕ = 2.0 and A = 0.35. The curves have been shifted up from zero for presentation. From lowest to highest, T/Tm = 0.0, 0.07, 0.28, 0.64, 0.75, 0.87, and 0.96, where Tm is the melting temperature.
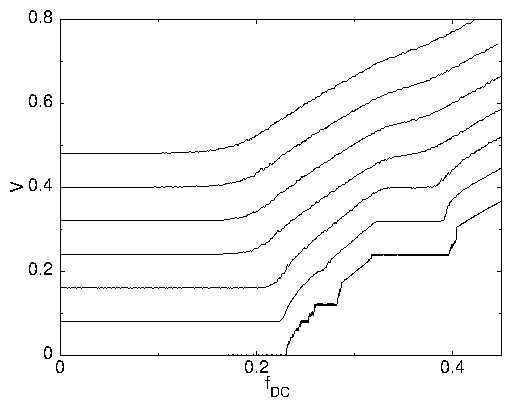
We consider the effects of temperature by adding a noise term fiT to the equation of motion for the vortices. We normalize our temperature by the melting temperature Tm, where Tm is the temperature at which the vortices began to diffuse in the absence of an external drive. In our system this onset is sharp and well defined, due to the fact that the vortices are sitting in a periodic substrate. In the absence of a substrate the onset of diffusion is more gradual and a well defined melting temperature does not appear. Experimentally, the melting of the interstitial vortices occurs at or just below Tc [21,23] so that TmTc. In Fig. 10 we show a series of V vs fDC curves for A = 0.35 for T/Tm = 0.0, 0.07, 0.28, 0.64, 0.75, 0.87, and 0.96, from bottom to top. The fractional steps wash out very quickly with temperature at about T/Tm = 0.1. The main step is visible all the way up to Tm but is more cusp like for T/Tm > 0.64. This washing out of the step with temperature is also consistent with the Shapiro step experiments near Tc which found only a cusp feature [8]. Experimentally it would still be possible to measure the increase of the step width with AC amplitude by taking the derivative of the IV curves, which shows a dip at each side of the step. Since most transport experiments are performed close to Tc, it will be very difficult to observe the fractional steps. The widths of the steps can be increased by increasing A, allowing fractional steps to be visible for T > 0.1Tm. In practice, however, there will be a limit to how large A can be made before the vortices at the pinning sites begin to depin.
Along the phase locking steps the vortices flow in attracting periodic orbits. The finite temperature adds random forces to the vortices, perturbing the orbits. If the temperature is low the perturbations are small and the vortex orbits remain nearly periodic. As the temperature increases, the vortex orbits become increasingly perturbed away from the phase locked orbits. Due to these perturbations, at any instant a number of the vortices will be in a disordered orbit, instead of in the periodic phase locked orbit. Although the velocities of the vortices in the phase locked orbits are fixed, the velocities of the vortices in disordered orbits are not fixed, and as a result there is a linear velocity increase along the step. A portion of the vortices can intermittently lock back into the fixed velocity periodic orbits, so the slope of the step is still less than the slope expected for free vortex flow. At very high temperatures the orbits are too strongly perturbed for periodic orbits to occur and evidence of the step vanishes in a continuous fashion.

IV.  TRANSVERSE PHASE LOCKING FOR TRIANGULAR PINNING

Fig11.png
Figure 11: The velocity V vs DC driving force fDC curves for a triangular pinning array at different AC amplitudes A. The system size and pinning density are the same as for the system in Fig. 1. The curves have been shifted up for presentation. From lowest to highest, A = 0.35, 0.25, 0.15, 0.05, and 0.0.
Next we study the transverse phase locking for the case where the pinning is triangular rather than square. We use the same system size and pinning density as for the square pinning array, but every other pinning row is shifted in the x-direction by half a lattice constant. Here the motion of an interstitial vortex for zero AC amplitude has a periodic transverse velocity component, unlike the square case where for zero AC amplitude the motion is strictly 1D. In Fig. 11 we show V vs fDC for different values of A. We find phase locking similar to that seen in the square pinning case. The step widths all increase monotonically with AC drive, rather than oscillating as expected for Shapiro steps. There are some noticeable differences from the square case, in that the depinning force is only weakly affected by increases in A. In addition the main step is wider than that observed for square pinning at the same AC amplitudes. We also find that the step widths increase linearly with AC amplitude, rather the quadratically as in the square pinning array.
Fig12.png
Figure 12: Vortex trajectories for triangular pinning on various steps for (a) A = 0.0 and (b-f) A = 0.25. (a) For A = 0.0 above depinning, fDC=0.3, there is a periodic transverse motion of the vortex even for zero AC drive. Remaining panels: A=0.25 and (b) fDC = 0.07, (c) fDC=0.11, (d) fDC=0.1375, (e) fDC=0.2, and (f) fDC=0.3.
In Fig. 12(a) we show the vortex motion above depinning for A = 0.0, indicating that the vortex moves with a periodic transverse component even in the absence of an AC drive. In Fig. 12(b-f) we show the vortex orbits along various steps for A = 0.25. In Fig. 12(b), at fDC = 0.07, a stable periodic orbit forms where the vortex goes through an interesting loop that alternates from up to down. This loop feature appears for stable orbits where fDC < 0.1. For the step near fDC = 0.11 [Fig. 12(c)], corresponding to the second largest step, a stable orbit forms similar to that in Fig. 12(b) but the loop feature is absent. On the small step at fDC = 0.1375 [Fig. 12(d)], a stable orbit forms which is not symmetrical in the y-direction. A vortex trajectory for a non-step region at fDC=0.2 [Fig. 12(e)] has similar characteristics as the trajectories for the non-step regions for square pinning. In Fig. 12(f) we show the vortex orbit along the main step, fDC = 0.3, where a well defined sinusoidal orbit can be seen as the transverse frequency generated by the DC motion matches one-to-one with the frequency of the transverse AC drive. For higher DC drives, there are additional stable orbits along the steps as in the case for the square pinning. Similar noise signals for step and non-step regions as seen in Fig. 4 are also observed for the triangular pinning case.
Fig13.png
Figure 13: Scaling of the step width ∆ versus AC amplitude A of the main step for triangular pinning (squares), along with the scaling for the main step for square pinning (circles) for comparison. The solid line is a linear fit.
In Fig. 13 we show the scaling of the width ∆ of the main step for triangular pinning with AC drive A, along with the width ∆ of the main step for square pinning for comparison. Here the magnitude of ∆ for the triangular pinning is greater than that for the square pinning for all AC values considered here. The width of the triangular steps also scales linearly with AC amplitude rather than quadratically as in the square pinning, so that for smaller AC amplitudes the difference in the magnitudes of ∆ becomes greater. This result suggests that the detection of transverse phase locking would be easiest for a system with triangular rather than square pinning arrays.
Fig14.png
Figure 14: Scaling of the step width ∆ vs A for triangular pinning for (circles) fDC=0.11 [Fig. 12(c)], along with (triangles) the depinning force. We also show the scaling of the main step (squares) for comparison.
In Fig. 14 we show the scaling of the step width ∆ with AC amplitude A for the fractional step at fDC=0.11 (the orbit shown in Fig. 12(c)), along with the width of the main step and the change in value of the depinning force. Here the fractional step scales linearly with AC amplitude, just as the main step does. The difference in the depinning force at different values of A, which is much smaller than the widths of the main step and the fractional step, does not scale linearly with A but increases quadratically or even faster.
We can compare our results for transverse phase locking in the triangular pinning to the results for random pinning. For random pinning [15] the vortices in the highly driven phase regain partial triangular ordering and a washboard signal appears. Unlike the square pinning case, in random pinning in the absence of a transverse AC drive the vortices do not move in strictly 1D channels but have a transverse velocity component centered around zero which can also have a washboard signal. For the random pinning it was found that the width of the transverse phase locking step oscillates as a function of AC amplitude, which is different from the results for the triangular or square pinning. For low AC amplitudes, however, the increase in the step width is linear with AC amplitude in the random pinning case. Using a simple model it was shown that any form of disorder that induces a transverse temporal order in the absence of an AC drive gives rise to a linear dependence of the step width for small AC amplitudes [15]. This is similar to the case of the triangular pinning, where there is transverse temporal order present in the zero AC drive limit. In addition, for the case of random pinning, the vortex trajectories along the step show stable sinusoidal orbits in a similar manner to the stable orbits found in the periodic pinning cases.

V.  CONCLUSION

We have investigated the transverse phase locking in square and triangular pinning arrays. For square arrays we find a series of fractional steps which correspond to stable vortex orbits. Along the non-step regions there are no stable periodic vortex orbits. All the fractional steps increase monotonically in width with AC amplitude. Along the steps a narrow band noise signal is present, while in the non-step regions the narrow band signal is broadened and large low frequency noise power appears. We have shown explicitly that the width of several of the fractional steps increases as the the square of the AC amplitude. The velocity vs drive near the depinning threshold and the main step scale with β = 1/2.
We find that the phase locking is most pronounced for interstitial vortex filling fractions at which the interstitial vortices form a symmetrical ground state, such as at B/Bϕ = 1.25, 1.5 and 2.0. For filling fractions near these commensurate fillings, a partial phase locking occurs where certain regions of the sample have stable phase locked orbits while other regions are unstable and the vortex velocity in these regions increases linearly. For filling fractions where the ground states are disordered the phase locking is absent. With a finite temperature, the fractional steps appear only at low temperatures and are washed out at higher temperatures, while the presence of the main step can be detected up to the melting temperature Tm.
For triangular pinning arrays, where moving interstitial vortices have a periodic transverse motion even in the absence of a transverse AC drive, we again observe a transverse phase locking with all the step widths increasing monotonically with AC amplitude rather than oscillating as in the case of Shapiro steps. The depinning force is only weakly increased by increasing the AC amplitude. The main step for the triangular case is larger than that observed in the square pinning case, and its width increases linearly with AC amplitude, unlike the quadratic increase observed for the square case. The linear increase in the step widths with AC amplitude is similar to the results for transverse phase locking with random disorder with small AC drives, where there is also an ordered transverse motion in the absence of an AC drive. We show that the width of the fractional steps also increase linearly with AC amplitude, but the difference in the depinning force increases quadratically.
Our predictions should be testable for superconductors with periodic pinning arrays where only one flux line is captured per pinning site. The steps can best be observed in samples where Shapiro steps have already been observed with longitudinal DC and AC drives at filling fractions where a symmetrical vortex configuration occurs, such as B/Bϕ=17/16, 5/4, 3/2, or 2. For experiments performed near Tc, it is unlikely that the fractional steps can be observed; however, the main steps should be visible. A particular advantage of transverse phase locking steps over longitudinal (or Shapiro) steps is that the step width can be made arbitrarily large by increasing the AC amplitude or lowering the AC frequency. Our results should also be relevant for vortex motion in Josephson-junction arrays at commensurate fillings.
Acknowledgments: We thank D. Domínguez, N. Grønbech-Jensen, A. Kolton, V. Moshchalkov, D. Stroud, and L. Van Look for useful discussions. This work was supported by the US Department of Energy under contract W-7405-ENG-36.

References

[1]
S. Shapiro, Phys. Rev. Lett. 11, 80 (1963).
[2]
A. Barone and G. Paterno, Physics and Applications of the Josephson Effect (Wiley, New York, 1982).
[3]
S.P. Benz, M.S. Rzchowski, M. Tinkham, and C.J. Lobb, Phys. Rev. Lett. 64, 693 (1990); K.H. Lee and D. Stroud, Phys. Rev. B 43, 5280 (1991); D. Domínguez and J.V. José, Phys. Rev. Lett. 69, 514 (1992).
[4]
G. Grüner, Rev. Mod. Phys. 60, 1129 (1988).
[5]
G. Grüner, Rev. Mod. Phys. 66, 1 (1994).
[6]
P. Martinoli, O. Daldina, C. Leemann, and E. Stocker, Sol. St. Commun. 17, 205 (1975).
[7]
Y. Yuzhelevski, G. Jung, C. Camerlingo, M. Russo, M. Ghinovker, and B. Ya. Shapiro, Phys. Rev. B 60, 9726 (1999).
[8]
L. Van Look, E. Rosseel, M.J. Van Bael, K. Temst, V.V. Moshchalkov, and Y. Bruynseraede, Phys. Rev. B 60, R6998 (1999).
[9]
C. Reichhardt, R.T. Scalettar, G.T. Zimányi, and N. Grønbech-Jensen, Phys. Rev. B 61, R11914 (2000).
[10]
T. Tsuboi, T. Hanaguri and A. Maeda, Phys. Rev. Lett. 80, 4550 (1998); A.M. Troyanovski, J. Aarts, and P.H. Kes, Nature 399, 665 (1999); Y. Togawa, R. Abiru, K. Iwaya, H. Kitano, and A. Maeda, Phys. Rev. Lett. 85, 3716 (2000).
[11]
C.J. Olson, C. Reichhardt, and F. Nori, Phys. Rev. Lett. 81, 3757 (1998); D. Domínguez, Phys. Rev. Lett. 82, 181 (1999); A.B. Kolton, D. Domínguez, and N. Grønbech-Jensen, Phys. Rev. Lett. 83, 3061 (1999).
[12]
A.T. Fiory, Phys. Rev. Lett. 27, 501 (1971); J.M. Harris, N.P. Ong, R. Gagnon, and L. Taillefer, Phys. Rev. Lett. 74, 3684 (1995).
[13]
A.B. Kolton, D. Domínguez, and N. Grønbech-Jensen, Phys. Rev. Lett. 86, 4112 (2001).
[14]
C. Reichhardt, A.B. Kolton, D. Domínguez, and N. Grønbech-Jensen, Phys. Rev. B 64, 134508 (2001).
[15]
A.B. Kolton, D. Domínguez, and N. Grønbech-Jensen, cond-mat/0112318.
[16]
D.S. Fisher, Phys. Rev. B 31, 1396 (1985).
[17]
A.A. Middleton, O. Biham, P.B. Littlewood, and P. Sibani, Phys. Rev. Lett. 68, 1586 (1992).
[18]
M.J. Higgins, A.A. Middleton, and S. Bhattacharya, Phys. Rev. Lett. 70, 3784 (1993).
[19]
C. Reichhardt, C.J. Olson, and F. Nori, Phys. Rev. B 57, 7937 (1998); C. Reichhardt and N. Grønbech-Jensen, Phys. Rev. B 63, 054510 (2001).
[20]
A.T. Fiory, A.F. Hebard, and S. Somekh, Appl. Phys. Lett. 32, 73 (1978).
[21]
M. Baert, V.V. Metlushko, R. Jonckheere, V.V. Moshchalkov, and Y. Bruynseraede, Phys. Rev. Lett. 74, 3269 (1995); A. Castellanos, R. Wördenweber, G. Ockenfuss, A. v.d. Hart, and K. Keck, Appl. Phys. Lett 71, 962 (1997); V. Metlushko, U. Welp, G.W. Crabtree, Z. Zhang, S.R.J. Brueck, B. Watkins, L.E. DeLong, B. Ilic, K. Chung, and P.J. Hesketh, Phys. Rev. B 59, 603 (1999).
[22]
S.B. Field, S.S. James, J. Barentine, V. Metlushko, G. Crabtree, H. Shtrikman, B. Ilic, and S.R.J. Brueck, cond-mat/0003415; A.N. Grigorenko, G.D. Howells, S.J. Bending, J. Bekaert, M.J. Van Bael, L. Van Look, V.V. Moshchalkov, Y. Bruynseraede, G. Borghs, I.I. Kaya, and R.A. Stradling, Phys. Rev. B 63, 052504 (2001).
[23]
E. Rosseel, M. Van Bael, M. Baert, R. Jonckheere, V.V. Moshchalkov, and Y. Bruynseraede, Phys. Rev. B 53, R2983 (1996).
[24]
K. Harada, O. Kamimura, H. Kasai, T. Matsuda, A. Tonomura, and V.V. Moshchalkov, Science 274, 1167 (1996).
[25]
J.I. Martín, M. Vélez, J. Nogués, and I.K. Schuller, Phys. Rev. Lett. 79, 1929 (1997); D.J. Morgan and J.B. Ketterson, Phys. Rev. Lett. 80, 3614 (1998); Y. Fasano, J.A. Herbsommer, F. de la Cruz, F. Pardo, P.L. Gammel, E. Bucher, and D.J. Bishop, Phys. Rev. B 60, R15047 (1999); A. Hoffmann, P. Prieto and I.K. Schuller, Phys. Rev. B 61, 6958 (2000); A. Terentiev, D.B. Watkins, L.E. De Long, L.D. Cooley, D.J. Morgan, and J.B. Ketterson, Phys. Rev. B 61, R9249 (2000); M. Lange, M.J. Van Bael, L. Van Look, K. Temst, J. Swerts, G. Güntherodt, V.V. Moshchalkov, and Y. Bruynseraede, Europhys. Lett. 53, 646 (2001).
[26]
J.I. Martín, M. Vélez, A. Hoffmann, I.K. Schuller, and J.L. Vicent, Phys. Rev. Lett. 83, 1022 (1999); J.I. Martín, M. Vélez, A. Hoffmann, I.K. Schuller, and J.L. Vicent, Phys. Rev. B 62, 9110 (2000); C. Reichhardt, G.T. Zimányi, and N. Grønbech-Jensen, Phys. Rev. B 64, 014501 (2001).
[27]
D.J. Morgan and J.B. Ketterson, J. Low Temp. Phys. 122, 37 (2001); M.F. Laguna, C.A. Balseiro, D. Domínguez, and F. Nori, Phys. Rev. B 64, 104505 (2001).
[28]
C. Reichhardt, C.J. Olson, and F. Nori, Phys. Rev. Lett. 78, 2648 (1997).
[29]
B.Y. Zhu, L. Van Look, V.V. Moshchalkov, B.R. Zhao, and Z.X. Zhao, Phys. Rev. B 64, 012504 (2001).
[30]
N. Grønbech-Jensen, Int. J. Mod. Phys. C 7, 873 (1996); Comp. Phys. Comm. 119, 115 (1999).
[31]
D. Domínguez, Phys. Rev. Lett. 72, 3096 (1994).


File translated from TEX by TTHgold, version 4.00.

Back to Home