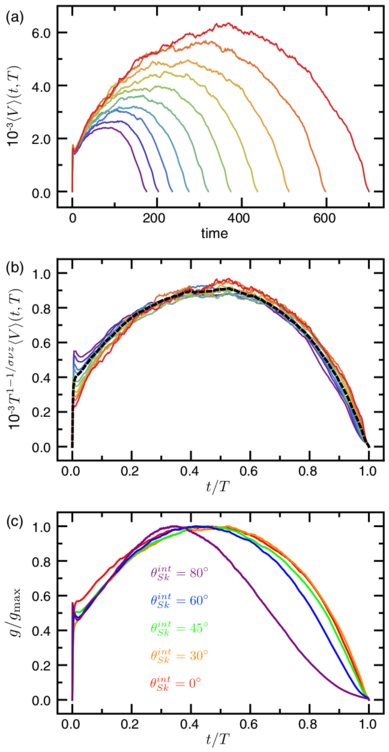
 Figure 3: (a)
The time averaged avalanche velocity 〈V〉(t,T)
in a system with θintSk=30°, for avalanches of duration T, versus time in simulation time steps. The curves represent the time average over ten logarithmically-spaced bins
for T = 150, 175, 204, 238, 278, 324, 378, 441, 514, 600, and 700
simulation time steps, from left to right.
(b) Scaling collapse of the data in panel (a) plotted as
T1 − 1/σνz〈V〉(t,T) vs t/T,
where 1/σνz = 1.63.
The dashed curve indicates the overall average avalanche shape.
(c) The average avalanche shapes g/gmax vs t/T for
θintSk = 0° (red), 30° (orange), 45° (green),
60° (blue), and 80° (purple).
|
