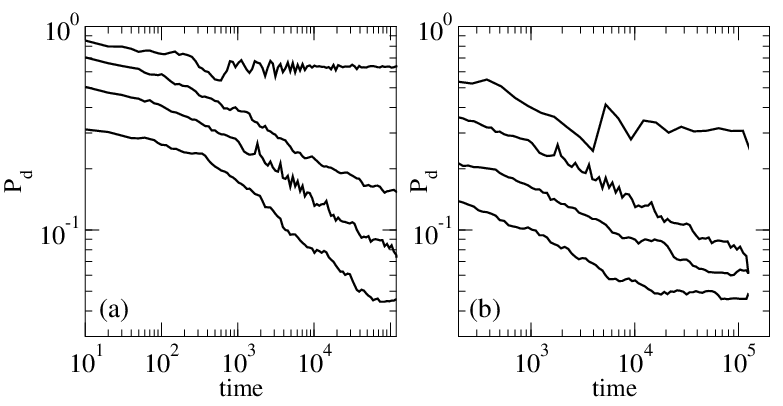
Physical Review E 73, 046122 (2006)

Coarsening of Topological Defects in Oscillating Systems with Quenched Disorder

C. Reichhardt and C.J. Olson Reichhardt

Theoretical Division and Center for Nonlinear Studies, Los Alamos National Laboratory, Los Alamos, New Mexico 87545

(Received 30 May 2005; revised manuscript received 9 January 2006; published 18 April 2006)

We use large scale simulations to study interacting particles in two dimensions in the presence of both an ac drive and quenched disorder. As a function of ac amplitude, there is a crossover from a low drive regime where the colloid positions are highly disordered to a higher ac drive regime where the system dynamically reorders. We examine the coarsening of topological defects formed when the system is quenched from a disordered low ac amplitude state to a high ac amplitude state. When the quench is performed close to the disorder-order crossover, the defect density decays with time as a power law with α = 1/4 to 1/3. For deep quenches, in which the ac drive is increased to high values such that the dynamical shaking temperature is strongly reduced, we observe a logarithmic decay of the defect density into a grain boundary dominated state. We find a similar logarithmic decay of defect density in systems containing no pinning. We specifically demonstrate these effects for vortices in thin film superconductors, and discuss implications for dynamical reordering transition studies in these systems.
I. INTRODUCTION
II. SIMULATION
III. DYNAMICAL REORDERING WITH AC DRIVES
IV. DEFECT DECAY AFTER A QUENCH OF THE AC DRIVE
V. EFFECTS OF VARIED DISORDER STRENGTH, AC DRIVE FREQUENCY, AND SYSTEM SIZE
VI. SUMMARY
References


I.  INTRODUCTION

There are a wide variety of systems that can be modeled as an elastic lattice driven over an underlying random quenched substrate by an external force. Examples include moving vortex lattices in type-II superconductors [1,2,3,4], sliding charge density wave systems [5], models of atomic friction [6], colloidal particles moving over a rough substrate [7], driven Wigner crystals, and stripe forming systems [8]. Typically, when the quenched disorder is strong, the elasticity of the system breaks down and topological defects proliferate in the form of dislocations and disclinations. It has also been shown that when a sufficiently large external drive is applied, the system can exhibit a dynamical reordering process where the density of topological defects is sharply reduced in the presence of a high dc drive [1,2,4]. Conversely, if the external drive is reduced from a high value where the system is ordered, the underlying disorder acts as a fluctuating force on the moving particles which increases as the drive is lowered, causing the system to dynamically melt via the proliferation of defects [1]. This dynamical reordering effect has been demonstrated for vortices in superconductors through simulations [1,2], transport [3], and imaging experiments [4], and has also been verified for sliding charge density waves [5], colloids [7], and electron crystals [8].
Experiments have produced evidence that an applied ac drive can also induce a dynamical ordering transition in vortex systems [10]. Further, simulations with various types of ac drives have shown that the vortex lattice can reorder and that the reordered lattice is aligned in the direction of the ac drive [9].
Since these driven systems show both and ordered and disordered phases as a function of external drive, it is also possible to study the dynamics of a quench from either the ordered regime to the disordered regime or the converse. An open question is how the density of topological defects decays if the system is quenched from a regime where the steady state is disordered to a regime where it is ordered, such as by suddenly changing an external ac or dc drive.
The decay of topological defects after a quench has been studied in systems without quenched disorder through both simulations [14,15,16,17] and experiments on convection and electroconvection in fluids [18,19]. In general in these systems, the quench is performed between ordered and disordered phases that are separated by a continuous phase transition. A number of these studies find that the density of defects, or of grain boundaries which are comprised of defects, decays as a power law t−α, where the exponent α = 1/5, 1/4 [14,18], or 1/3 [15,16,17,19]. The different exponents that are obtained depend on the model of the depth of the quench.
It has also been shown that in some cases the defects form grain boundaries, and that there is a tendency for the system to create its own intrinsic pinning of the grain boundaries [16]. This can lead to glassy effects [16], and in this case the defect density decays very slowly or logarithmically with time rather than as a power law. Recent experiments with colloidal particles which form a triangular lattice in equilibrium showed that in a system with a large number of defects, the dislocations coarsen into grain boundaries and the defect density decays logarithmically with time rather than as a power law [20]. Simulations of two-dimensional vortex lattices driven with ac drives over quenched disorder also provided evidence that the defect density decays logarithmically with time; however, this data was very noisy [9].
We note that in the absence of a dc or ac drive, it has been found that a vortex lattice does not reorder into a crystal in the presence of disorder. Instead, if the disorder is weak, the system is dominated by grain boundaries whose motion becomes frozen [11,12]. Similar behavior occurs for a small number of strong pinning sites [13].
Here, we address how the density of topological defects decays in the presence of quenched disorder when the ac driving force is suddenly changed. Such a system can be realized readily in experiment for vortices interacting with random disorder and an oscillatory applied current.
Simulations of quench dynamics generally employ continuum models such as the Swift-Hohenberg model. A complementary approach which we adopt here is to model the individual particles of the elastic lattice directly, and allow the topological defects to emerge naturally from particle rearrangements. The drawback to such an approach is that very large systems are needed to produce reasonable statistics for the defect densities. Recent advances in computational speed have made it possible to access the defect density over long periods of time with particle based simulations and obtain defect numbers that are comparable with those of other simulation methods. An additional benefit of the particle based method is that processes such as effective pinning due to the ordering of the system into a triangular lattice are readily captured.

II.  SIMULATION

We consider elastic lattices interacting with quenched disorder in two dimensions for the specific cases of vortices in thin-film type II superconductors and charged colloids. In both cases, the equilibrium configuration of the N=6000 repulsive overdamped particles in the absence of disorder and temperature is a defect-free triangular lattice. Particle i obeys the overdamped equation of motion
d ri

dt
= N

ji 
fijpp + fp + fAC
(1)
Here the interaction force between particles a distance rij apart is fijpp = −∇i U(rij)rij, where U(rij) = ln(rij) for vortices in superconducting films, and U(rij) = exp(−rij)/rij for colloids. The force fp from the disordered substrate is exerted by Np randomly placed parabolic pinning sites of radius rp=0.2 and strength fp. An external ac force fAC=Asin(ωt)x is applied to all particles. We consider only the T=0 case, so that the only source of intrinsic noise is the fluctuations caused when the particles move over the quenched disorder.
Fig1.png
Figure 1: (a) Pd vs A/fp, for fixed fp=1.5 and ω = 3×10⁻⁴. (b) Ac/fp vs ω at fixed fp=1.5. (b) Ac vs fp at fixed ω = 3×10⁻⁴.

III.  DYNAMICAL REORDERING WITH AC DRIVES

We first identify where the disordered and ordered phases occur as a function of pinning strength, pinning density, and ac drive parameters. We slowly increase the magnitude of the ac force, A, and measure the density of topological defects by determining the fraction Pd of particles that are not sixfold coordinated. In a triangular lattice, Pd = 0. The regimes we observe can also be distinguished via time-dependent fluctuations in Pd. At low A, a disordered pinned phase appears in which the particles remain mostly immobile and Pd is roughly constant with time. For intermediate A, there is a disordered plastic flow phase where only a portion of the particles are moving. At high A, the system orders into a smectic type state where the lattice aligns in the direction of the drive and there are only a small number of dislocations present which have aligned Burgers vectors. These results are consistent with those obtained in simulations with slowly increasing or decreasing dc drives [1,2].
In Fig. 1(a) we plot the density of defects Pd vs A/fp for superconducting vortices with fixed pinning density ρp=1.3, pinning strength fp=1.5, and ac drive frequency ω = 3×10⁻⁴. We normalize A by fp so that the crossover from the disordered phase to the ordered phase occurs near A/fp = 1.0. For A/fp < 1.0 the system is strongly disordered and a large fraction of the particles are not sixfold coordinated. For A/fp > 1.3 the system orders and the density of defects is strongly reduced. The disorder to order crossover occurs for a wide range of parameters. In Fig. 1(b) we plot the crossover line Ac/fp from the disordered to the ordered state vs ac drive frequency ω for fixed fp. As ω is lowered, a larger A must be applied to order the system. For high ω, the crossover saturates near Ac/fp = 1.3. In Fig. 1(c) we plot Ac vs fp at fixed ω. Here, Ac increases roughly linearly with fp.
Fig2.png
Figure 2: Delaunay triangulation showing defect coarsening for the system in Fig. 1(a) at A*/fp=2.0. (a) Initial state at t=0; (b) t = 1×10⁴; (c) t = 7×10⁴; (d) t = 4.5×10⁵.

IV.  DEFECT DECAY AFTER A QUENCH OF THE AC DRIVE

We study the effect of a sudden quench by abruptly changing A from the low drive disordered regime to a high drive value A* where the steady state would be ordered. The defects present in the disordered phase coarsen after A is changed. We first consider the case A* >~Ac. In Fig. 2 we show the real space time evolution of the coarsening of the defects for the system in Fig. 1(a) with fp=1.5 where A/fp = 0.25 is suddenly changed to A*/fp=2.0. In this case, Ac/fp = 1.3. The initial strongly disordered state is illustrated in Fig. 2(a), and the defects in the Delaunay triangulation are highlighted in black. In Fig. 2(b) at time t = 1×10⁴ a large portion of the defects have annihilated and some grain boundary structures appear. In Fig. 2(c) at t = 7×10⁴ the ordered domains are larger, while in Fig. 2(d) (t = 4.5×10⁵) all of the grain boundaries are gone and only a small number of isolated dislocations are present. The system is also aligned in the x direction with the ac drive. The remaining isolated dislocations do not annihilate with time when we continue the simulation over a longer interval.
Fig3.png
Figure 3: (a) Pd(t) for A*/fp=2.0 for the system in Fig. 2 with fp=1.5. Dashed line: power law fit to 1/tα with α = 0.25. Inset: linear-log plot. (b) Pd(t) for the same system with A*/fp = 4.0. Dashed line: power law fit with α = 0.33. Inset: linear-log plot.
In Fig. 3(a) we plot the time dependent defect density Pd(t) for the system in Fig. 1(a) and Fig. 2. Here Pd(t) decays as 1/tα at long times with α very close to 1/4. The dashed line is a fit over three decades with α = 0.25. Since the exponent is small, it may be difficult to distinguish a logarithmic decay from a power law decay. In the inset to Fig. 3(a) we plot Pd(t) on a linear-log scale which would give a straight line if the decay was purely logarithmic. A logarithmic decay can only be fit at shorter times, whereas the power law fit is clearly better at the longer times. In Fig. 3(b) we show Pd(t) for the same system in Fig. 1(a) when A*/fp = 4.0. In this case we find a similar long time power law decay of Pd(t); however, the decay is faster than in Fig. 3(a) with α = 0.33 as indicated by the dashed line. In the inset of Fig. 3(b) we plot the curve on a linear-log scale, which shows that the long time behavior is consistent with a power law rather than a logarithmic decay. As A* is increased further, the exponent α remains close to 0.33; however, at very large A* the grain boundaries do not completely anneal.
Fig4.png
Figure 4: Topological defects (black dots) for the system in Fig. 1(a) with A*/fp = 12. (a) t = 200; (b) t = 2×10⁵.
The power law decay in the defect density with exponent 1/5 < α < 1/3 is consistent with the exponents observed in quench studies of continuum simulations [14,15,16,17] and convection experiments [18,19]. The change of the exponent with A* likely reflects the different effective pinning and defect production rates for different values of A*. Studies of particles driven with a dc force over quenched disorder have found that even at T = 0 the particles experience an effective shaking temperature Ts due to the randomness of the disorder. This shaking temperature varies inversely with the average particle velocity, Ts ∝ 1/v [1], so at higher velocities the shaking effect is reduced. When A* is only slightly higher than Ac, the effective temperature is high enough both to create and to destroy defects, so the overall rate of defect annihilation is slower. For higher A* values, the shaking temperature is lower, which reduces the rate at which new defects are created; however, the shaking temperature is still large enough to permit a significant amount of thermally activated defect hopping to occur, so the net rate of defect annihilation is higher. We note that if A* is very large, the net defect annihilation rate decreases because the defect mobility from the shaking temperature is considerably reduced.
When A* is much larger than the crossover value, the effective shaking temperature is very low since the average velocity of the particle is larger. Additionally, it was shown in the work of Boyer and Viñals [16] that defects and grain boundaries can be pinned effectively by the underlying pattern that the system forms. This pinning can lead to long time configurations that do not completely order and have very slow dynamics. For the particular system studied in Ref. [16], the pinning was caused when the ordered regime formed stripes. In our system the ordered phase is a triangular lattice rather than a stripe pattern; however, this still generates an effective periodic potential through which the defects and grain boundaries move. When the effective shaking temperature is low, activated motion of defects is suppressed. In Fig. 4 we show the real space evolution of the coarsening of the defects for the same system in Fig. 1(a) with A/fp = 0.25 quenched to A*/fp = 12.0. In Fig. 4(a) we illustrate the configuration close to the start of the quench at t = 200 where a large number of defects are present. At long times, the defect density saturates and a grain boundary network remains, as shown in Fig. 4(b) for t = 2×10⁵. These grain boundaries show no motion over extended periods of time, indicating that they are effectively pinned by the potential created by the triangular ordering of the particles.
Fig5.png
Figure 5: Pd(t) for the same system as in Fig. 1(a) at A*/fp=12. Dashed line: logarithmic fit. Inset: log-log plot. (b) Pd(t) for a system with the same parameters as in Fig. 5(a) with colloidal particles. Dashed line: logarithmic fit. Inset: log-log plot.
In Fig. 5(a) we plot Pd(t) for the same system in Fig. 1(a) and Fig. 4, where A*/fp = 12.0. Here the decay is not well fit by a power law, as shown by the inset. There is a regime at intermediate times that can be fit to a logarithmic decay with Pd(t) = aln(t) + b, as indicated by the dashed line. At longer times, the decay slows as the grain boundaries form. Quenches with even higher A* give very similar results. We find similar behavior for the case of colloidal particles, as illustrated in Fig. 5(b) for the same parameters; however, we observe a much stronger arrest of the decay at long times. The final configurations in the colloidal case are also grain boundary structures. In the inset of Fig. 5(b) a log-log plot indicates that the data cannot be fit by a power law. Recent experiments with colloidal particles in two dimensions where a mechanical shaking was applied produced a logarithmic decay in the length of the grain boundaries over two decades of time. In some cases, a long time defect saturation has also been observed [20]. We note that for smaller A* in the colloidal system, we obtain the same power law decays found for the vortex system.

V.  EFFECTS OF VARIED DISORDER STRENGTH, AC DRIVE FREQUENCY, AND SYSTEM SIZE

We next consider the effects of varying other parameters. We focus on the case with A/fp = 4.0 where there is a power law decay with an exponent close to 0.25.
We first consider whether the exponent for the decay of the defect density is affected by variations in the system size. In Fig. 6 we plot the defect decay for systems with the same parameters as in Fig. 3(b), fp=1.5, A*/fp=4, and ω = 3×10⁻⁴ for sizes of L = 48, 36, and 24. The dashed line indicates a fit to 1/tα for α = 0.25. The exponent does not change with system size, although the smaller system shows more fluctuations due to the smaller overall number of defects. This indicates that the system sizes we are using are large enough to avoid finite size effects.
Fig6.png
Figure 6: Pd(t) for the same system as in Fig. 3(a) for varied system sizes L = 48 (top), 36 (center), and 24 (bottom). The straight line is a power law fit to 1/tα with α = 0.25.
We next consider the effect of changing the disorder strength fp. As noted earlier, if the final ac amplitude is large, the defect decay appears to have a logarithmic form and the system reorders to a grain boundary dominated state rather than to a state where all the remaining defects are aligned in the direction of the ac drive. This occurs when the final ac drive is large enough that the effective pinning is no longer felt by the rapidly moving particles, and implies that if the pinning is absent, the defects will decay in a logarithmic fashion to a grain boundary dominated state. In Fig. 7 we plot Pd(t) for the same system as in Fig. 6 for L = 36 and fp = 0.0 where the particles were initially placed in random positions. Here we observe a logarithmic decay with a saturation at long times as the system forms a grain boundary dominated state. This is consistent with the results for high A*/fp in which the effective pinning is strongly reduced so the system is closer to the clean limit. The pinning is necessary for the creation of the smectic state and the coarsening of the domain walls. In the inset we show the same data on a log-log scale, indicating that a power law decay cannot be fit. We note that there have been several studies for superconducting vortices in two dimensions interacting with random disorder where a domain dominated ground state is observed [11]. This state only occurs for weak disorder; if strong disorder is present, the entire system is disordered. In our system the grain boundary dominated state occurs for weak or no disorder when the system is initialized in a random configuration. In the absence of pinning, the ground state would be a completely ordered state; however, the grain boundaries we observe do not completely coarsen at long times, and the final state of the system is metastable or glassy.
Fig7.png
Figure 7: Pd(t) for the same system as in Fig. 6 with L = 36 and no disorder. Inset: log-log plot of the same curve.
Fig8.png
Figure 8: (a) Pd(t) for the same system as in Fig. 6 with L = 36 and A*=6 for varied disorder strength. From top to bottom, A*/fp = 0.7, 1.25, 2.0, and 3.0. (b) Pd(t) for the same system in (a) for varied ac frequencies. From top to bottom, ω/3×10−4 = 0.1, 0.25, 1, and 10.
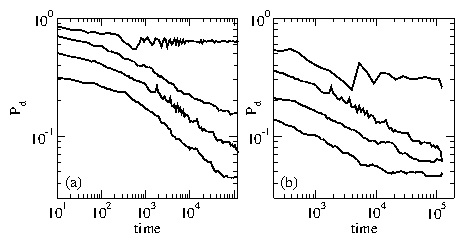
In Fig. 8(a) we plot the decays for the same system as in Fig. 6 at L=36 with A* held fixed at A*=6 while fp is varied. This is in contrast to Fig. 3, where fp was kept fixed at fp=1.5 and A* was varied. Here we consider fp=8.57, 4.8, 3.0, and 2.0, corresponding to A*/fp = 0.7, 1.25, 2.0, and 3.0 in Fig. 8(a). For weak disorder, A*/fp = 3.0, the decay is rapid with an exponent α somewhat higher than 0.25. This is consistent with the results presented in Fig. 2(b) at A*/fp = 4.0 where the effective pinning is weak but still present and the exponent α = 0.33. Higher values of α indicate a more rapid decay in the defect density. When the pinning strength is increased, there is also some creation of defects caused by the motion over the disordered substrate which competes with the annihilation of the defects. This results in a slower decay of Pd, as shown in Fig. 8(a) for larger pinning forces A*/fp = 1.25, where α is smaller than 0.25. For the largest pinning force fp=8.57, plotted in Fig. 8(a) at A*/fp = 0.7, Pd decays only briefly before saturating to a constant value at which the rate of generation and annihilation of defects balances. These results show that the if the disorder is too strong, coarsening of the defects cannot occur.
In Fig. 8(b) we examine the effects of changing ω for the same system as in Fig. 6 with L = 36, fixed A*/fp = 2.0, A*=6, and fp=3.0. In Fig. 6 the frequency is ω = 3×10⁻⁴. Fig. 8(b) shows Pd(t) for ω/3×10−4 = 0.1, 0.25, 1, and 10, from top to bottom. For very low frequencies the system remains strongly disordered, as indicated by the saturation of Pd at long times for ω/3×10−4=0.1, since the particles have time to become partially pinned during the portion of each drive cycle when the ac amplitude is near zero. If the frequency is high enough, as for ω/3×10−4 ≥ 0.25 in Fig. 8(b), the system is able to coarsen and a power law decay of defect density can occur. The slope α is somewhat less than 0.25, indicating a relatively slow decay of defect density, which is consistent with the fact that some defects are being created even as other defects annihilate. For the higher values of ω, such as for ω/3×10−4=10 in Fig. 8(b), a power law decay of Pd still occurs; however, there is a cutoff in the coarsening process at long times. This may be due to the fact that the effective temperature is dropping due to the reduced sampling of the pinning landscape, and as a result, the last of the defects cannot be annihilated away. We note that at frequencies ω/3×10−4 = 200, the effect of the ac drive is negligible and the system decays as if there were no ac drive and only pinning. In this case the defect density decays logarithmically but reaches saturation at much earlier times than for the case of no pinning illustrated in Fig. 7.
Our results showing logarithmic decay for weak effective disorder and no disorder are in agreement with the recent experimental results for the coarsening of domain walls in colloidal systems where there was no disorder present. The simulations by Valenzuela found evidence for a logarithmic decay in the presence of quenched disorder [9]; however, the scaling range was small and the data was very noisy so it was not clear if those results indicated a true logarithmic decay.

VI.  SUMMARY

In summary, we have examined the coarsening of topological defects in two dimensional systems with quenched disorder when an external oscillating drive is suddenly changed from a disordered steady state value to an ordered steady state value. For quenches where the final value of the ac drive is close to the disorder-order crossover, the defect density decays as a power law in time, 1/tα, with α = 1/4 to 1/3, in agreement with studies of quenched dynamics in continuum models. The final state is free of grain boundaries and the system aligns in the direction of the ac drive. The remaining dislocations are also aligned with the direction of the ac drive and the system forms a smectic state as seen in previous simulations by Valenzuela. If the final value of the ac drive is much larger than the maximum pinning force, the defect density decays in a logarithmic fashion and the final state is dominated by grain boundaries. We also find that if the disorder is very weak or absent, the defect density decreases logarithmically with time. We interpret our results according to an effective shaking temperature, which is low when the ac amplitude is much larger than the pinning force or when the pinning is absent. In this case, domain walls of defects are formed which do not completely anneal. We specifically show that these results can be applied to vortices in superconductors and to colloidal particles.
We thank M.B. Hastings and W. Zureck for useful discussions. This work was supported by the U.S. Department of Energy under Contract No. W-7405-ENG-36.

References

[1]
A.E. Koshelev and V.M. Vinokur, Phys. Rev. Lett. 73, 3580 (1994).
[2]
K. Moon, R.T. Scalettar, and G.T. Zimányi, Phys. Rev. Lett. 77, 2778 (1996); S. Ryu, M. Hellerqvist, S. Doniach, A. Kapitulnik, and D. Stroud, ibid. 77, 5114 (1996); C.J. Olson, C. Reichhardt, and F. Nori, ibid. 81, 3757 (1998); A.B. Kolton, D. Domínguez, and N. Grønbech-Jensen, ibid. 83, 3061 (1999); H. Fangohr, S.J. Cox, and P.A.J. de Groot, Phys. Rev. B 64, 064505 (2001).
[3]
S. Bhattacharya and M.J. Higgins, Phys. Rev. Lett. 70, 2617 (1993); M.C. Hellerqvist, D. Ephron, W.R. White, M.R. Beasley, and A. Kapitulnik, ibid. 76, 4022 (1996); W. Henderson, E.Y. Andrei, M.J. Higgins, and S. Bhattacharya, ibid. 77, 2077 (1996).
[4]
U. Yaron, P.L. Gammel, D.A. Huse, R.N. Kleiman, C.S. Oglesby, E. Bucher, B. Batlogg, D.J. Bishop, K. Mortensen, and K.N. Clausen, Nature (London) 376, 753 (1995); M. Marchevsky, J. Aarts, P.H. Kes, and M.V. Indenbom, Phys. Rev. Lett. 78, 531 (1997); F. Pardo, F. de la Cruz, P.L. Gammel, E. Bucher, and D.J. Bishop, Nature (London) 396, 238 (1998).
[5]
L. Balents and M.P.A. Fisher, Phys. Rev. Lett. 75, 4270 (1995); L.-W. Chen, L. Balents, M.P.A. Fisher, and M.C. Marchetti, Phys. Rev. B 54, 12798 (1996); R. Danneau, A. Ayari, D. Rideau, H. Requardt, J.E. Lorenzo, L. Ortega, P. Monceau, R. Currat, and G. Grubel, Phys. Rev. Lett. 89, 106404 (2002).
[6]
O.M. Braun, M. Paliy, and S. Consta, Phys. Rev. Lett. 92, 256103 (2004); J. Tekic, O.M. Braun, and B. Hu, Phys. Rev. E 71, 026104 (2005).
[7]
C. Reichhardt and C.J. Olson, Phys. Rev. Lett. 89, 078301 (2002); J.X. Chen, Y.G. Cao, and Z.K. Jiao, Phys. Rev. E 69, 041403 (2004).
[8]
C. Reichhardt, C.J. Olson Reichhardt, I. Martin, and A.R. Bishop, Phys. Rev. Lett. 90, 026401 (2003); Y. Horibe, C.H. Chen, S.W. Cheong, and S. Mori, Europhys. Lett. 70, 383 (2005).
[9]
S.O. Valenzuela, Phys. Rev. Lett. 88, 247003 (2002).
[10]
S.O. Valenzuela and V. Bekeris, Phys. Rev. Lett. 86, 504 (2001).
[11]
M. Chandran, R.T. Scalettar, and G.T. Zimányi Phys. Rev. B 69, 024526 (2004).
[12]
P. Moretti, M.-Carmen Miguel, and S. Zapperi, Phys. Rev. B 72, 014505 (2005).
[13]
C. Dasgupta and O.T. Valls, Phys. Rev. B 72, 094501 (2005).
[14]
K.R. Elder, J. Viñals, and M. Grant, Phys. Rev. Lett. 68, 3024 (1992); M.C. Cross and D.I. Meiron, ibid. 75, 2152 (1995).
[15]
H. Qian and G.F. Mazenko, Phys. Rev. E 67, 036102 (2003).
[16]
D. Boyer and J. Viñals, Phys. Rev. E 65, 046119 (2002).
[17]
D. Boyer, Phys. Rev. E 69, 066111 (2004).
[18]
L. Purvis and M. Dennin, Phys. Rev. Lett. 86, 5898 (2001).
[19]
C. Kamaga, F. Ibrahim, and M. Dennin, Phys. Rev. E 69, 066213 (2004).
[20]
Q.H. Wei and X.L. Wu, Phys. Rev. E 70, 020401 (2004).


File translated from TEX by TTHgold, version 4.00.

Back to Home