 Figure 9:
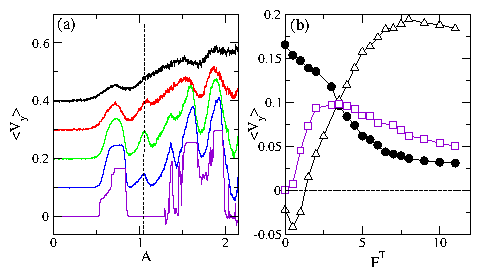
(a) 〈Vy〉 vs A for the system in Fig. 2 with
an oblique lattice of L-shaped barriers and
counterclockwise moving particles (si=1) at different thermal force values
FT = 0.0, 1.0, 2.0, 4.0, and 6.0, from bottom to top. The
curves have been successively shifted up for clarity.
The dashed line highlights the appearance of a new peak
near A = 1.05 for finite temperature.
(b) 〈Vy〉 vs FT for
A = 0.75 (circles), which monotonically decreases;
A = 1.05 (squares), which starts at 〈Vy〉 = 0,
reaches a maximum and then decreases; and
A = 2.12 (triangles), which starts with 〈Vy〉 < 0,
reverses to a positive value, and then
decreases at higher FT.
|


