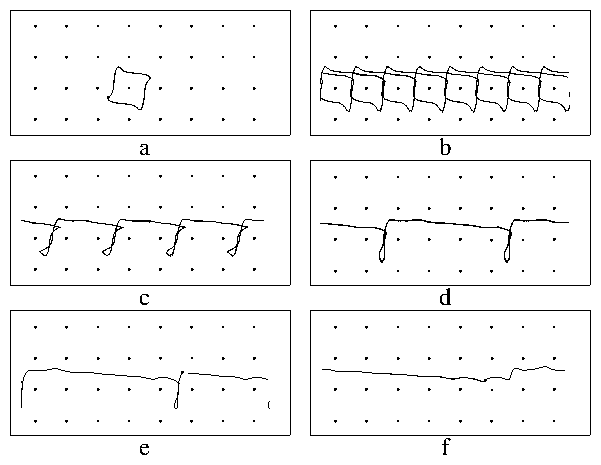
 Figure 2:
Trajectories for fixed fDC for different non- rectifying regions
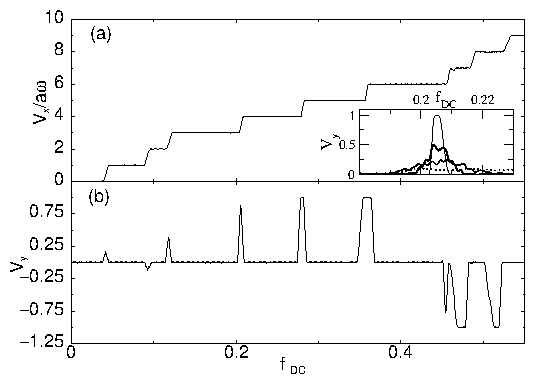
seen in Fig. 1.
The black dots denote the location
of the fixed particles or the potential maxima of the periodic substrate.
Shown are steps with:
(a) n = 0, (b) n = 1, (c) n = 2, (d) n = 4,
(e) n = 5,
and (f) n = 8.
|

