Statics and Dynamics of Two-Dimensional Vortex Liquid Crystals
C. Reichhardt and C.J. Olson Reichhardt
Theoretical Division and Center for Nonlinear Studies,
Los Alamos National Laboratory, Los Alamos, New Mexico 87545
received 28 November 2005; accepted in final form 7 June 2006
published online 28 June 2006
PACS. 74.25.Qt - Vortex lattices, flux pinning, flux creep.
Abstract. -
With numerical simulations
we examine static and dynamic properties
of two-dimensional
vortices with anisotropic interactions.
We find evidence for a smectic-A phase in the absence of
pinning.
Quenched disorder can induce a smectic type state even at T=0.
When an external drive is applied, a variety of
novel anisotropic dynamical flow states
with distinct voltage signatures occur, including
elastic depinning in the hard direction and
plastic depinning in the easy direction.
We compare our work to recent experiments on two-dimensional colloids
with anisotropic interactions.
We also discuss the implications
of the anisotropic transport for other systems which exhibit
depinning phenomena, such as stripes and electron
liquid crystals.
Recently, a new state of vortex matter termed a vortex liquid
crystal was argued to occur
in superconductors
with anisotropic vortex-vortex interactions [1].
In such systems, the vortex lattice first melts in the soft direction,
giving rise to an intermediate vortex smectic-A state, followed at
higher temperatures by a melting into a nematic state.
The smectic-A state is distinct from
smectic-C states observed for vortices
or colloids
interacting with one-dimensional
(1D) periodically modulated substrates
[2].
In the smectic-A case,
the anisotropy arises from the elliptical vortex
cross section
produced by the anisotropic superfluid stiffness which leads to
different effective masses in the three crystalline
directions [1].
The prediction in Ref. [1]
combined an elastic model with the Lindemann
criterion for melting, but it was later
argued in Ref. [3] that this approach is not
sufficient to determine whether the smectic-A state
exists, since scaling theory alone predicts that the smectic-A state will
not occur. The Lindemann criterion does not take
into account the proliferation of dislocations
which occurs
in the smectic state. It is possible that once dislocations
appear, melting will
immediately occur in both directions, precluding the smectic-A state.
Although a true
2D smectic-A state
has been predicted to be unstable for rod like colloids
[4],
recent experiments on anisotropically interacting 2D colloids have found
evidence for a smectic state in which the dislocations are aligned only
along the symmetry directions of the lattice [5].
Here, the anisotropic particle interactions may
be producing collective motions that
allow for only one type of dislocation.
It is thus an open question
whether the smectic-A state exists.
The physics of a 2D vortex system with
anisotropic interactions
should be generic to the class of problems
involving anisotropically interacting 2D particles, such as
colloidal systems with anisotropic magnetic interactions,
as well as 2D electron crystal states
formed by anisotropic
interactions in classical electron crystals
[6].
Evidence for such states has
been observed in transport measurements which show
hard and soft directions for flow [7,8].
The interaction of the proposed
anisotropic vortex lattice with quenched disorder
is unexplored, and
it is not known whether disorder would completely destroy
possible smectic type orderings.
The transport properties of vortex
systems with anisotropic interactions
have not been studied previously; these
could be used to identify new states in experiment, and
may show new
dynamical phenomena.
Of broader interest is the fact that
understanding the behavior of vortex smectic states
in the presence of disorder
can offer insight into the effect of disorder
on the general class of systems of
particles with anisotropic repulsive interactions,
including dynamics in electron liquid crystal states.
We consider a 2D system of Nv interacting vortices
with periodic boundary conditions in the
x and y directions. The
overdamped equation of motion for a single vortex i is
η
dri
dt
= fivv + fTi + fpi + fdi
(1)
The damping constant η = 1.
The vortex-vortex interaction force is
fivv = ∑Nvj ≠ iAvK1(rij/λ)∧rij,
where K1 is the modified Bessel function
appropriate for stiff, 3D vortex lines [9],
which decays exponentially for large distances,
λ is the London penetration depth,
Av=Φ02/(2πμ0λ3),
and rij is the distance between
vortices i and j.
The thermal force fTi arises from random
Langevin kicks with the properties 〈fTi〉 = 0 and
〈fiT(t)fjT(t′)〉 = 2ηkBT δ(t−t′)δij.
The quenched disorder fip
is modeled as random pinning sites
in the form of
attractive parabolic traps of radius rp=0.2λ and strength fp.
The Lorentz driving force from an external applied current is fd.
The system size is measured in units
of λ, forces in units of Av, energies in
Avλ, and temperature in Avλ/kB.
The anisotropic interactions
are introduced
by multiplying the
vortex-vortex interaction force in the x and y
directions by a vector (Cx, Cy), where the anisotropy C=Cx/Cy.
In this work we concentrate on the case
C = 1/√{10} considered in Ref. [1].
We take the x axis to be
the soft direction and the y axis as the hard direction.
We have also modeled vortices
in a thin film superconductor,
where the vortex-vortex interaction
has the form fvv = Av∧rij/rij,
with Av = Φ20/μ0πΛ and where Λ is the
thin film screening length [10].
To evaluate the long-range interactions we use a fast summation
method [11].
We find the same qualitative features with this potential, and also with
a screened Coulomb potential of inverse screening length κ,
exp(−rκ)/r, appropriate for charge-stabilized colloids.
The initial vortex configurations are obtained through
simulated annealing.
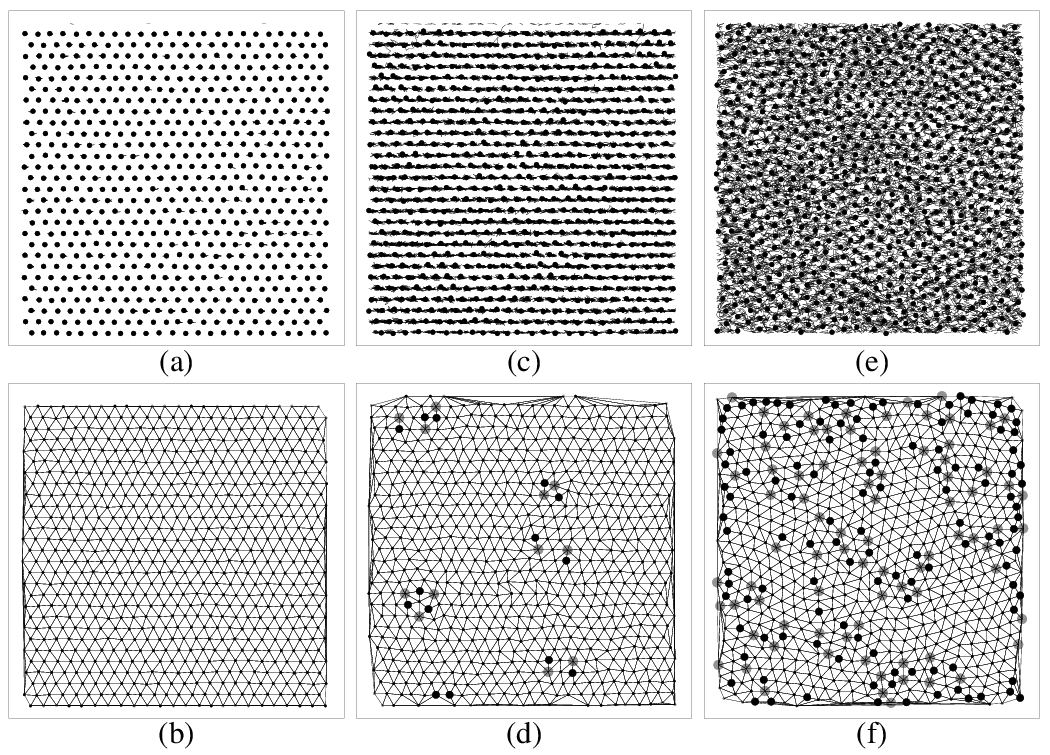
Figure 1:
(a,c,e) Black dots: vortices; black lines: vortex trajectories.
(b,d,f) Delaunay triangulation, with topological defects (5 and 7-fold
coordinated particles) marked as filled circles.
(a,b) T = 0.5;
(c,d) T = 1.2;
(e,f) T = 1.35.
We first consider the case where the pinning and the external driving
force are absent.
In Fig. 1 we illustrate the melting of a
24λ×24λ system with a vortex density of
ρv=1.2/λ2.
Figure 1(a) shows
the vortex positions (dots) and trajectories (lines)
for a fixed period of time with a fixed T = 0.5, and
Fig. 1(b) shows a corresponding Delaunay triangulation.
At this temperature,
the system remains in a crystalline state with no
dislocations.
The vortices are undergoing
larger random displacements in the soft (x) direction than
in the hard (y) direction; however, there is no
long time diffusion of the particles.
Figures 1(c) and 1(d) present the
smectic-A
state at T=1.2.
Here the trajectories have
a 1D liquid structure with motion
along the soft x direction and no significant
translation
of the vortices
in the y direction. The
Delaunay triangulation
indicates the presence of dislocations with
aligned Burgers
vectors, which is
characteristic of the smectic-A state and is
similar to the recent colloid experiments [5].
In
Fig. 2(d) we plot the density of sixfold coordinated particles P6
versus system size L in the crystal and smectic-A states, showing the
saturation of P6 for all but the smallest samples. In the
smectic-A state,
motion in the soft direction
occurs in the form of a pulse in which the vortices
translate by a single lattice constant a in the +x or −x direction.
Similar pulse-like motion has been observed in vortex chain states
[12].
It is possible for neighboring vortices in the same row to trade
places
by moving
into the y direction a distance smaller than a.
Figures 1(e) and 1(f) illustrate the vortex liquid phase at
T = 1.35.
The vortex trajectories show
clear
diffusion in both the x and y directions, with more pronounced motion
in the x direction.
The dislocations are no longer aligned,
indicating the loss of long-range order in both
the x and y directions.
We note that when the anisotropy
ratio C is too small, the two-step melting transition
illustrated here is lost.
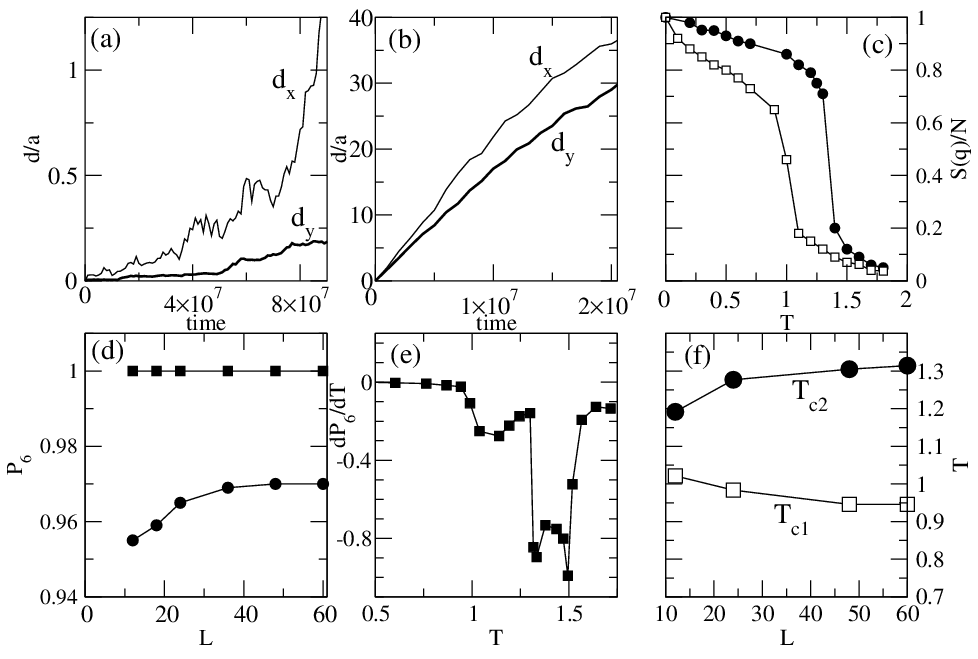
To further characterize the smectic state,
in Fig. 2 we plot the average particle displacements
for the x and y directions,
dx = 〈∑iNv|xi(0) − xi(t)|〉/Nv
and dy = 〈∑iNv|yi(0) − yi(t)|〉/Nv.
In the smectic phase at T = 1.21, shown in Fig. 2(a),
dx/a increases much more rapidly than dy/a,
and
does not saturate but increases to
a value over 1, indicating that the
vortices can diffuse more than a lattice constant
in the x direction over time.
This is due to the formation
of dislocations which allow adjacent rows of vortices to slip past
each other while remaining confined in the y direction.
The saturation value of
dy/a is approximately 1/5,
larger than the Lindemann criterion value of 1/10.
Excess motion in the y direction occurs during a sliding event when two
rows slip past each other and the vortices in each row are
temporarily displaced in the direction perpendicular to the slip plane.
This transverse motion is
too small to permit the formation of
dislocations aligned in the hard direction.
Similar behavior was observed experimentally in the smectic phase
in Ref. [5].
For times longer than illustrated in the figure, dy saturates
completely.
In the
anisotropic liquid
phase, shown in
Fig. 2(b)
at T = 1.35,
dx still increases
more rapidly than dy; however, the continuous increase of both quantities
indicates that the particles are diffusing throughout the
entire system.
We have not determined whether the diffusion is normal or anomalous
in the smectic region, but in the liquid region it appears normal.
In
Fig. 2(c) we plot the peak values
of the structure factor
S(q) = (1/L2)∑i,jexp(iq·[ri(t) −rj(t)])
for the two different directions.
Fig. 2(c) shows that the peak corresponding to the
soft direction, S(qs), decreases in magnitude
much more rapidly with T than the peak corresponding to
the hard direction, S(qh).
Near T = 1.0 the value S(qs) drops markedly while
S(qh) does not undergo a steep drop
until T = 1.32, showing that the system is in a smectic
phase for 1.0 < T < 1.32. For T > 1.32 the system is in the
anisotropic liquid
phase.
The smectic-A state illustrated in Fig. 1 also appears for
1/r vortex-vortex interactions appropriate for thin film
superconductors. Due to the reduced shear modulus,
the smectic-A phase occurs over a lower range of
temperatures; however, a similar
sequence of phases occurs.
Figure 2:
Average particle displacements in each direction,
dx and dy,
normalized by the lattice constant a, vs
time, measured in molecular dynamics steps.
(a) Smectic-A state at T = 1.21.
(b) Anisotropic liquid phase at T=1.35.
(c) The peaks in the structure factor
vs temperature T for the soft direction
S(qs) (squares)
and hard direction S(qh) (circles).
(d) P6 vs system size L at T=0.5 (upper curve) and T=1.21 (lower
curve) for the system in Fig. 1.
(e) dP6/dT vs T.
(f) Tc1 (squares) and Tc2 (circles) vs L.
We have also measured P6 vs T which shows a two step feature with an
initial dip at the onset of the smectic phase followed at higher temperature
by a larger dip when the system enters the anisotropic liquid phase, as
illustrated in Fig. 2(e). For larger systems the two peaks become more
pronounced. We extract the temperatures for the onset of the smectic phase,
Tc1 and the liquid phase, Tc2, for different system sizes and
find that for large systems Tc2−Tc1 saturates to a constant
nonzero value, as shown in Fig. 2(f). We do not find hysteresis in any
of these quantities if we cycle the temperature through these transitions.
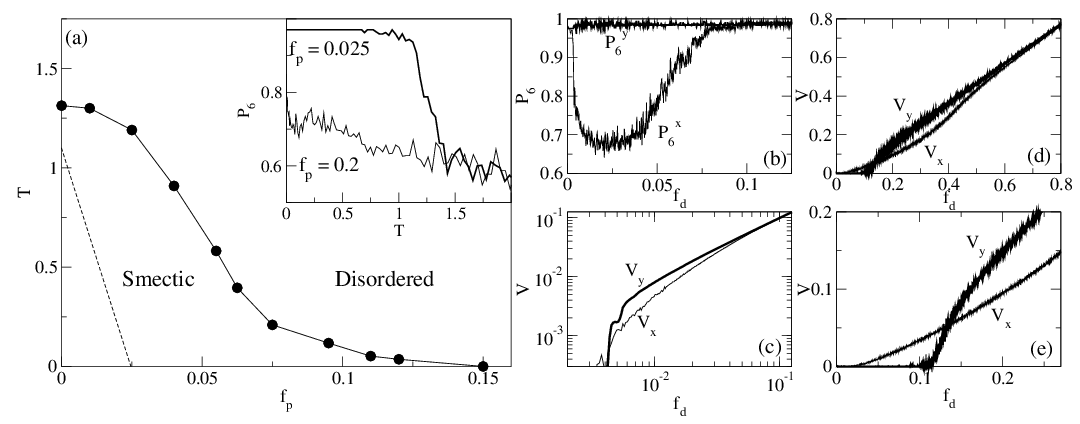
We next consider the effect of random disorder by adding Np=2Nv randomly
located pinning sites to the same system studied in Fig. 1, and
then conducting a
series of simulations at varied T and varied pinning strength fp.
For high temperatures we
obtain a liquid phase, while
for low T and small fp we observe
what we term a pinned smectic phase
similar to that shown in
Fig. 1(c,d), where the vortex lattice
contains a small number of
dislocations aligned in the soft direction.
In this pinned state, diffusion along the rows is suppressed by the
pinning.
For higher fp we observe that dislocations which are not aligned with
the soft direction start to appear, and the system enters a disordered
phase.
In Fig. 3(a) we indicate the regions in which the smectic and disordered
phases appear as a function of temperature and pinning strength.
The boundaries in Fig. 3(a) are identified
via Delaunay triangulations, which enable both the orientation of the
dislocations and
the density of sixfold coordinated particles P6
to be measured.
In the crystal phase, there are no defects and P6=1. In the
smectic phase, P6=0.91 to 0.95, and in the disordered phase
P6 < 0.9 and misoriented defects appear.
In the inset of Fig. 3(a) we plot
P6 vs T
for two different disorder strengths.
For fp = 0.025 (upper line) the
system is in the pinned smectic state at T = 0.
As T increases, there is a
clear transition to the
disordered state, as indicated
by the drop in P6 near T = 1.19.
The lower line shows P6
for fp=0.2, when the pinning is strong enough to disorder
the system even at T = 0.
These results suggest that weak random disorder can increase the
extent of the regions where the smectic-A phase occurs
when there are anisotropic interactions,
by suppressing the crystalline
phase at low temperatures and raising the melting temperature of the
smectic state.
Figure 3: (a) Regions in which the smectic and disordered phases
occur
in a system with quenched disorder
as a function of temperature T and pinning strength fp.
Dashed line roughly indicates the weak pinning region in which a 2D anisotropic
Bragg glass forms.
Inset: the density of six-fold coordinated particles
P6 vs T for
(top curve) fp = 0.025 and (bottom curve) fp = 0.2.
(b)
P6 vs driving force fd for a
system with fp = 0.04 at T=0.
Upper curve:
Py6 for fd=fd∧y.
Lower curve:
Px6 for fd=fd∧x.
(c) Average velocities vs fd for the same system.
Upper curve:
Vy for fd=fd∧y.
Lower curve:
Vx for fd=fd∧x.
(d) Vx and Vy vs fd
for a system with fp = 0.2.
(e) A blowup of (c) in the region near depinning
showing the crossing of the velocity force
curves.
One question is whether the smectic state with random disorder is stable
for very large systems. It has been argued that dislocations are always
present for weak disorder in 2D isotropic systems; however, the distance
between
between the dislocations can become arbitrarily large
compared to the range of the translational order,
so that for a wide range of temperatures and disorder strengths the
system behaves as a dislocation free 2D Bragg glass [13].
In the vortex liquid crystal case there are
two length scales associated with the hard and soft directions, and
the disorder induced dislocations first form in the soft direction.
It may be possible that, on very large
length scales, dislocations in the hard direction will also appear and
create a true smectic state.
For the parameters considered here,
dislocations are present except at the lowest pinning strengths, roughly
indicated by a dashed line in Fig. 3(a),
where a 2D anisotropic Bragg glass forms.
The positions of the lines in Fig. 3(a) do not shift with
system size.
We next consider dynamical effects in the presence of pinning.
In the smectic state,
there should be distinct
transport signatures for the hard and soft directions.
When the
disorder is strong enough to destroy the smectic phase, there may still
be an anisotropic transport signature.
We first consider the pinned smectic state found at
fp = 0.04 and T = 0.
We
perform separate simulations for driving in the
soft direction, fd=fd∧x, and the
hard direction, fd=fd∧y,
increasing the applied drive
for a total of 5 ×10⁷ MD steps which is slow enough to avoid any
transient effects. In
Fig. 3(c)
we plot
Vy=(1/Nv)〈∑iNvvy〉 (upper curve) for driving
in the hard direction and
Vx=(1/Nv)〈∑iNvvx〉 (lower curve)
for driving in the soft direction.
Above depinning in
Fig. 3(c), Vx < Vy,
indicating that pinning has the largest effect on motion in the soft
direction.
In
Fig. 4(b) we plot
P6 for the two different driving directions.
At fd = 0, P6 is slightly less than one due to the presence of
a small number of dislocations in the smectic state.
For driving in the hard direction, P6y (upper curve),
the system depins elastically without
additional proliferation of defects, and
the vortices do not exchange neighbors as they move.
For driving in the
easy direction, P6x (lower curve) drops substantially when the
vortices depin plastically, and
a portion of the vortices remain pinned while others flow past.
A similar proliferation of defects has been associated with
the so called peak effect, where the effective pinning force
suddenly increases as a function of temperature or applied
magnetic field
[14].
Further, the elastic and plastic depinning transitions produce
different scaling responses in the
velocity force curves. At depinning, the velocity scales with the
driving force in the
form V = (fd −fc)β [16].
For the plastic flow regime we find β > 1.0 while
in the elastic flow regime we find β < 1.0,
in agreement with theoretical expectations.
Figure 4(b)
shows that at higher drives, the system dynamically
reorders [15],
as indicated by the
increase in P6x,
as well as by the merging of Vx and Vy in
Fig. 4(c).
At finite temperatures and for fp large enough
that we observe only plastic
depinning in both directions, we observe that the depinning force
in the soft direction, fcx, is
lower than the depinning force in the hard direction, fcy,
even though Vx < Vy
at intermediate drives.
This implies that the anisotropic flow
exhibits a reversal from Vx > Vy to Vx < Vy at low drives.
We explicitly demonstrate this effect for a system with fp=0.25 and
T=0.25 in
Fig. 4(d,e).
Here,
fcx=0.015 and fcy=0.11, and
the depinning is plastic in both directions.
There are fewer dislocations for fd=fd∧y
and the system reorders at fdy = 0.2.
For
fd=fd∧x, the
system does not reorder until fdx = 0.8.
There is a clear crossing of the
velocity force curves
at fd = 0.13 so that the flow is easier in the soft direction
for fd < 0.13 and easier in the hard direction for fd > 0.13.
In
Fig. 4(e) we show a blowup of this region.
The crossing of the velocity force curves can be understood
by considering that the depinning in the
soft direction is plastic. At low drives,
individual vortices can be thermally activated,
giving rise to creep. For driving in the hard direction,
the depinning is elastic and individual vortex hopping is not possible,
so that only collective creep can occur.
In the case of the disordered phase, when there is some plastic flow in the
y-direction, there is still
a large correlated length scale that must move so
thermal effects are greatly reduced.
Thus, creep in the pinned smectic phase and pinned disordered phase is
enhanced in the soft direction
compared to the hard direction.
In conclusion, using numerical simulations we find evidence that
an intermediate vortex smectic-A state can occur
when the vortex-vortex interactions are anisotropic for both
short and long range interaction potentials.
The smectic-A state contains
a small fraction of dislocations which are all aligned in the soft
direction.
In the presence of disorder, a pinned smectic state can occur
where dislocations oriented only in the soft direction appear for the
system sizes we have considered.
The system depins plastically in the soft direction
but elastically in the hard direction.
We predict that, for equal intermediate
drives, the velocity in the soft direction will be lower than in
the hard direction. At finite
temperatures the creep is much larger in the soft direction due to the fact
that individual vortex hopping can occur,
whereas creep is suppressed in the hard direction since the vortex
motion is much more correlated.
For high temperatures and disorder strengths, the system
is disordered.
For strong quenched disorder,
anisotropic transport should still be observable.
Our results
may also apply to electron liquid crystals.
We thank E. Carlson for useful discussions.
This work was supported by the U.S. Department of Energy under
Contract No. W-7405-ENG-36.
Balents L and Nelson D.R.
Phys. Rev. B 52 (1995) 12951;
Wei Q.-H., Bechinger C., Rudhardt D., and Leiderer P.
Phys. Rev. Lett. 81 (1998) 2606;
Radzihovsky L., Frey E., and Nelson D.R.
Phys. Rev. E 63 (2001) 031503.