Figure 4:
(a)
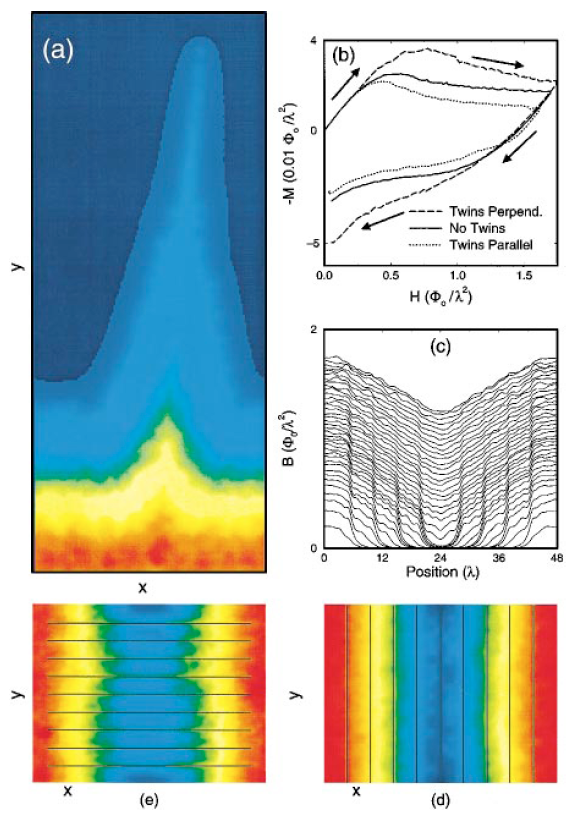
Bz(x,y) along a TB at θ = 85° with
fpTB/fp = 0.05, fp = 0.4f0, and
np = 152/λ2. Bz(x,y) exhibits a "flame"
front profile. The same-color contours of constant Bz
indicate the current flow around the twin.
The images 4(a,d,e) show Bz(x,y), which is obtained by
approximating the field due to each vortex by a monopole
located 1λ below the surface and computing
Bz(x,y) at z = 0.6λ above the surface
(see Ref. [20]).
(b)
M(H(t)) for heavily twinned samples; the TBs are
5.6 λ apart. TBs, indicated by black lines in
(d) and (e), act as barriers (for TBs perpendicular to
the vortex flow as in (d)) or as easy-flow channels
(for TBs parallel to the vortex flow as in (e)).
For comparison, M(H(t)) for an untwinned sample is
also shown in (b).
In (b-e), fpTB/fp = 0.1, fp = 0.2f0,
and np = 496/λ2.
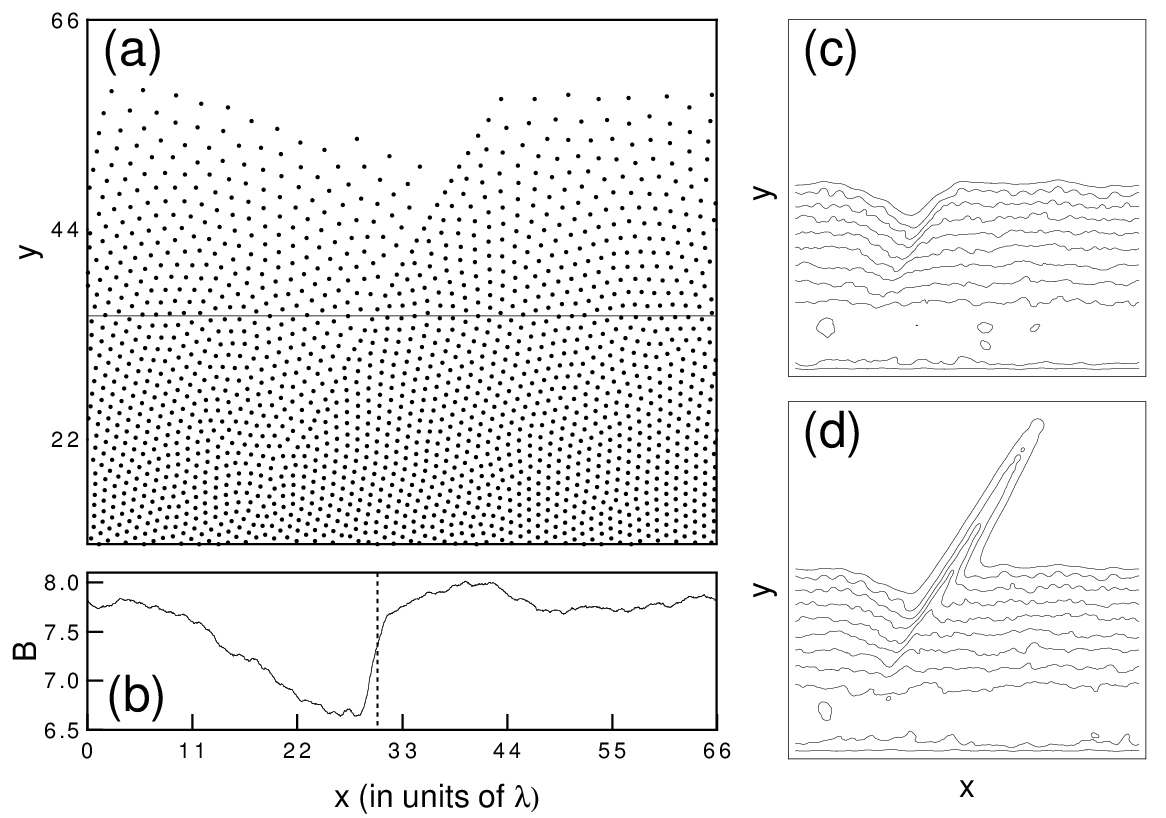
(c)
B(x) for the sample shown in (d).
Notice the sudden decrease in B(x)
(leading to high-currents) at each of the TBs.
This "terraced" B(x) profile produces a periodic array of alternating
high and low current regions (see Ref. [21]).
In (c,d) the TBs act as a series of "flux dams".
Figure 4:
(a)
Bz(x,y) along a TB at θ = 85° with
fpTB/fp = 0.05, fp = 0.4f0, and
np = 152/λ2. Bz(x,y) exhibits a "flame"
front profile. The same-color contours of constant Bz
indicate the current flow around the twin.
The images 4(a,d,e) show Bz(x,y), which is obtained by
approximating the field due to each vortex by a monopole
located 1λ below the surface and computing
Bz(x,y) at z = 0.6λ above the surface
(see Ref. [20]).
(b)
M(H(t)) for heavily twinned samples; the TBs are
5.6 λ apart. TBs, indicated by black lines in
(d) and (e), act as barriers (for TBs perpendicular to
the vortex flow as in (d)) or as easy-flow channels
(for TBs parallel to the vortex flow as in (e)).
For comparison, M(H(t)) for an untwinned sample is
also shown in (b).
In (b-e), fpTB/fp = 0.1, fp = 0.2f0,
and np = 496/λ2.
(c)
B(x) for the sample shown in (d).
Notice the sudden decrease in B(x)
(leading to high-currents) at each of the TBs.
This "terraced" B(x) profile produces a periodic array of alternating
high and low current regions (see Ref. [21]).
In (c,d) the TBs act as a series of "flux dams".
|